Zip Codes with the Highest Percentage of Population Employed in Arts, Entertainment & Recreation in Pasadena, TX
RELATED REPORTS & OPTIONS
Arts, Entertainment & Recreation
Pasadena
Compare Zip Codes
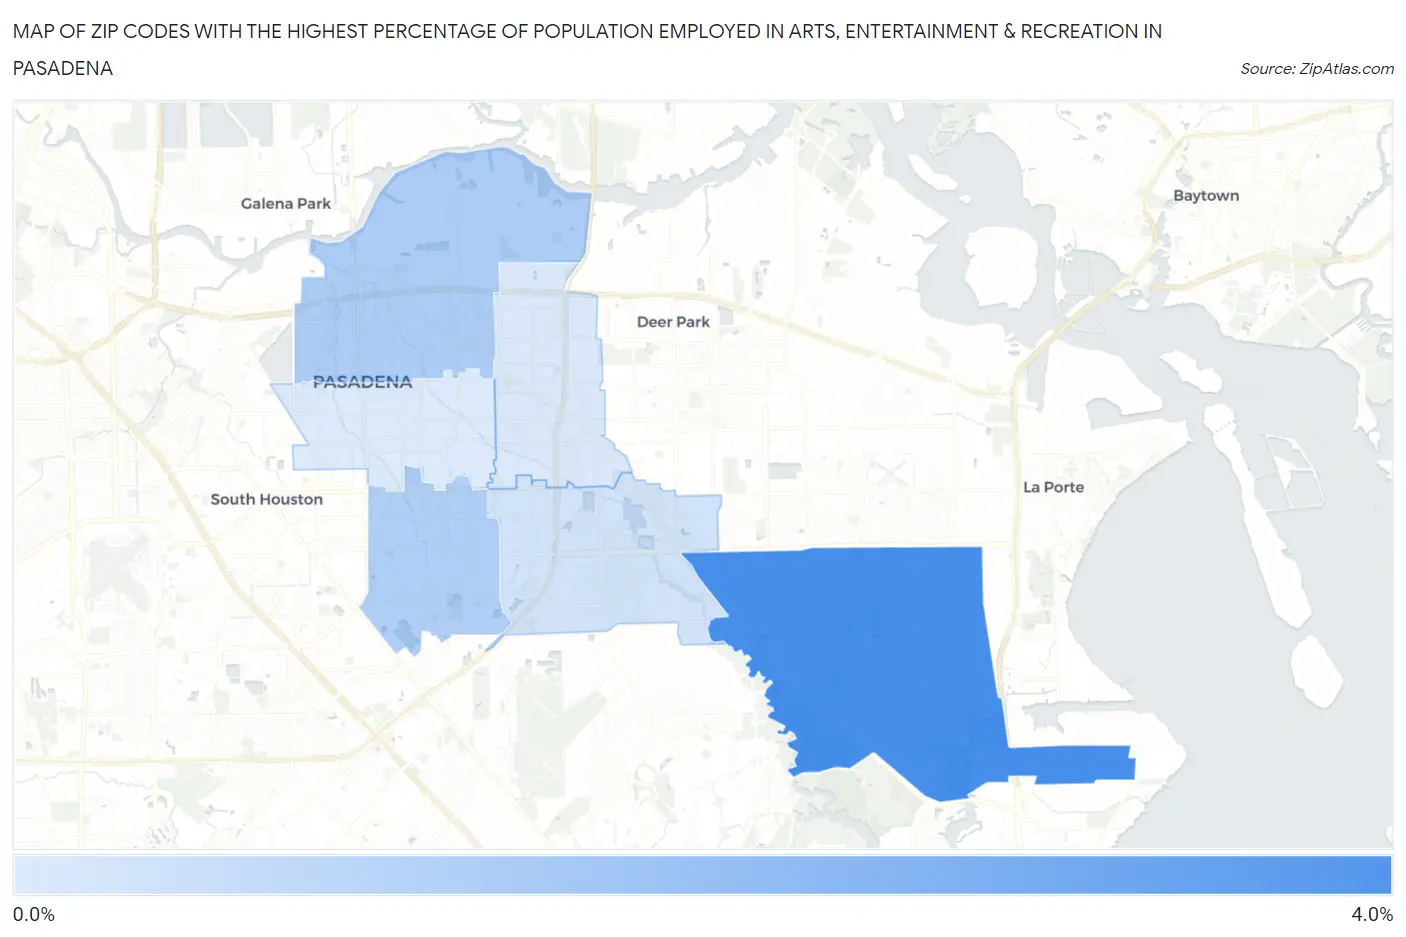
Map of Zip Codes with the Highest Percentage of Population Employed in Arts, Entertainment & Recreation in Pasadena
0.63%
3.6%
Zip Codes with the Highest Percentage of Population Employed in Arts, Entertainment & Recreation in Pasadena, TX
| Zip Code | % Employed | vs State | vs National | |
| 1. | 77507 | 3.6% | 1.5%(+2.18)#93 | 2.1%(+1.56)#3,864 |
| 2. | 77506 | 1.6% | 1.5%(+0.121)#510 | 2.1%(-0.499)#12,584 |
| 3. | 77504 | 1.5% | 1.5%(+0.032)#553 | 2.1%(-0.588)#13,262 |
| 4. | 77505 | 0.86% | 1.5%(-0.605)#894 | 2.1%(-1.22)#18,010 |
| 5. | 77503 | 0.68% | 1.5%(-0.786)#979 | 2.1%(-1.41)#19,316 |
| 6. | 77502 | 0.63% | 1.5%(-0.832)#1,004 | 2.1%(-1.45)#19,618 |
1
Common Questions
What are the Top 5 Zip Codes with the Highest Percentage of Population Employed in Arts, Entertainment & Recreation in Pasadena, TX?
Top 5 Zip Codes with the Highest Percentage of Population Employed in Arts, Entertainment & Recreation in Pasadena, TX are:
What zip code has the Highest Percentage of Population Employed in Arts, Entertainment & Recreation in Pasadena, TX?
77507 has the Highest Percentage of Population Employed in Arts, Entertainment & Recreation in Pasadena, TX with 3.6%.
What is the Percentage of Population Employed in Arts, Entertainment & Recreation in Pasadena, TX?
Percentage of Population Employed in Arts, Entertainment & Recreation in Pasadena is 1.1%.
What is the Percentage of Population Employed in Arts, Entertainment & Recreation in Texas?
Percentage of Population Employed in Arts, Entertainment & Recreation in Texas is 1.5%.
What is the Percentage of Population Employed in Arts, Entertainment & Recreation in the United States?
Percentage of Population Employed in Arts, Entertainment & Recreation in the United States is 2.1%.