Zip Codes with the Highest Percentage of Population Employed in Life, Physical & Social Science in Carrollton, TX
RELATED REPORTS & OPTIONS
Life, Physical & Social Science
Carrollton
Compare Zip Codes
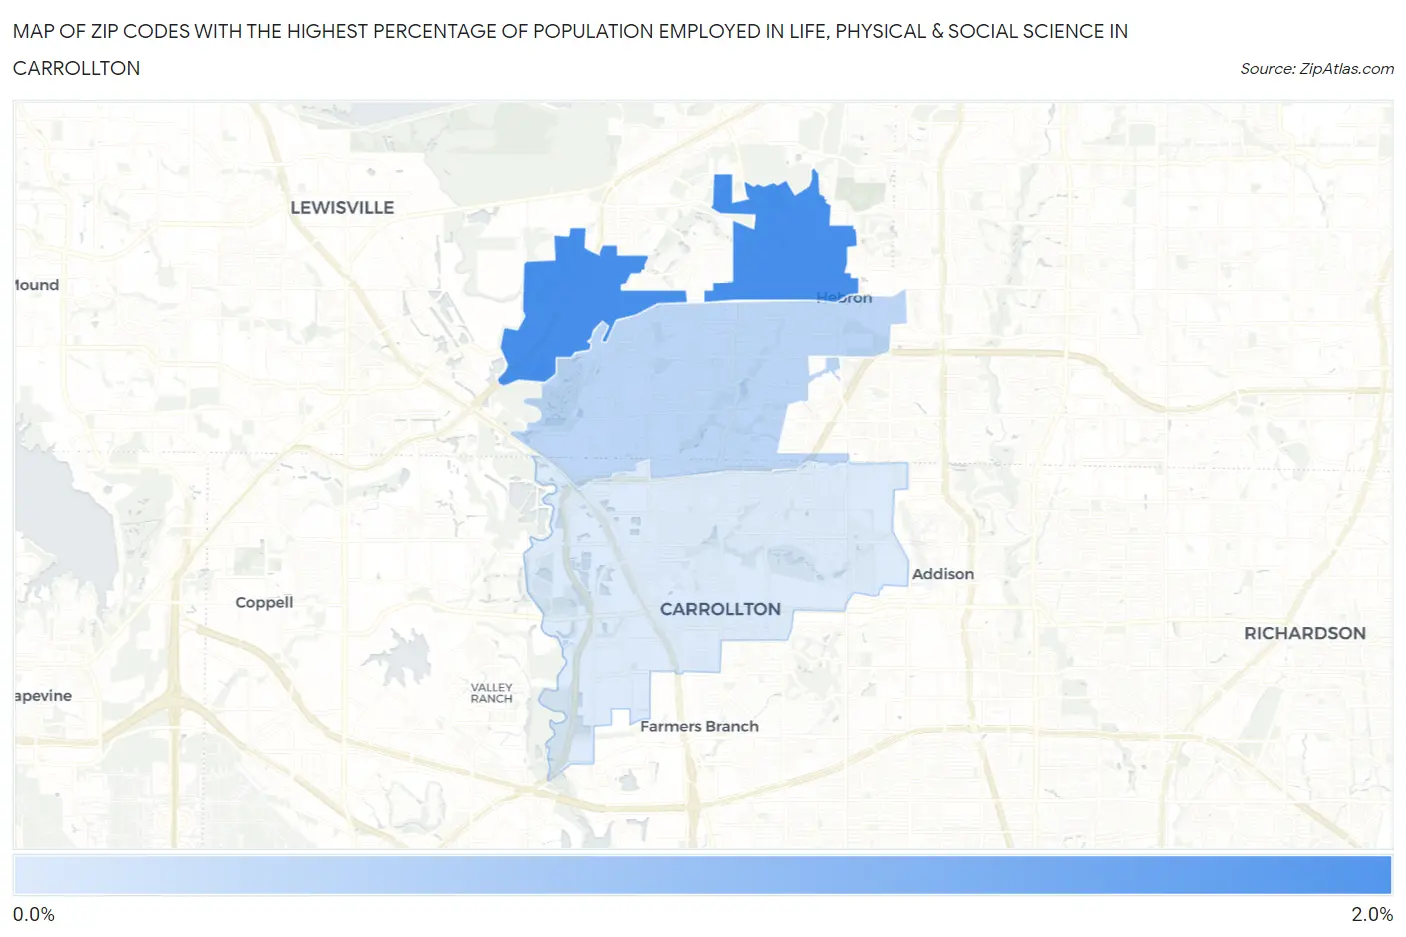
Map of Zip Codes with the Highest Percentage of Population Employed in Life, Physical & Social Science in Carrollton
0.11%
1.8%
Zip Codes with the Highest Percentage of Population Employed in Life, Physical & Social Science in Carrollton, TX
| Zip Code | % Employed | vs State | vs National | |
| 1. | 75010 | 1.8% | 0.84%(+0.957)#156 | 1.1%(+0.709)#4,324 |
| 2. | 75007 | 0.48% | 0.84%(-0.359)#750 | 1.1%(-0.608)#14,715 |
| 3. | 75006 | 0.11% | 0.84%(-0.729)#1,077 | 1.1%(-0.977)#18,987 |
1
Common Questions
What are the Top Zip Codes with the Highest Percentage of Population Employed in Life, Physical & Social Science in Carrollton, TX?
Top Zip Codes with the Highest Percentage of Population Employed in Life, Physical & Social Science in Carrollton, TX are:
What zip code has the Highest Percentage of Population Employed in Life, Physical & Social Science in Carrollton, TX?
75010 has the Highest Percentage of Population Employed in Life, Physical & Social Science in Carrollton, TX with 1.8%.
What is the Percentage of Population Employed in Life, Physical & Social Science in Carrollton, TX?
Percentage of Population Employed in Life, Physical & Social Science in Carrollton is 0.69%.
What is the Percentage of Population Employed in Life, Physical & Social Science in Texas?
Percentage of Population Employed in Life, Physical & Social Science in Texas is 0.84%.
What is the Percentage of Population Employed in Life, Physical & Social Science in the United States?
Percentage of Population Employed in Life, Physical & Social Science in the United States is 1.1%.