Zip Codes with the Highest Percentage of Population Employed in Computer, Engineering & Science in Carrollton, TX
RELATED REPORTS & OPTIONS
Computer, Engineering & Science
Carrollton
Compare Zip Codes
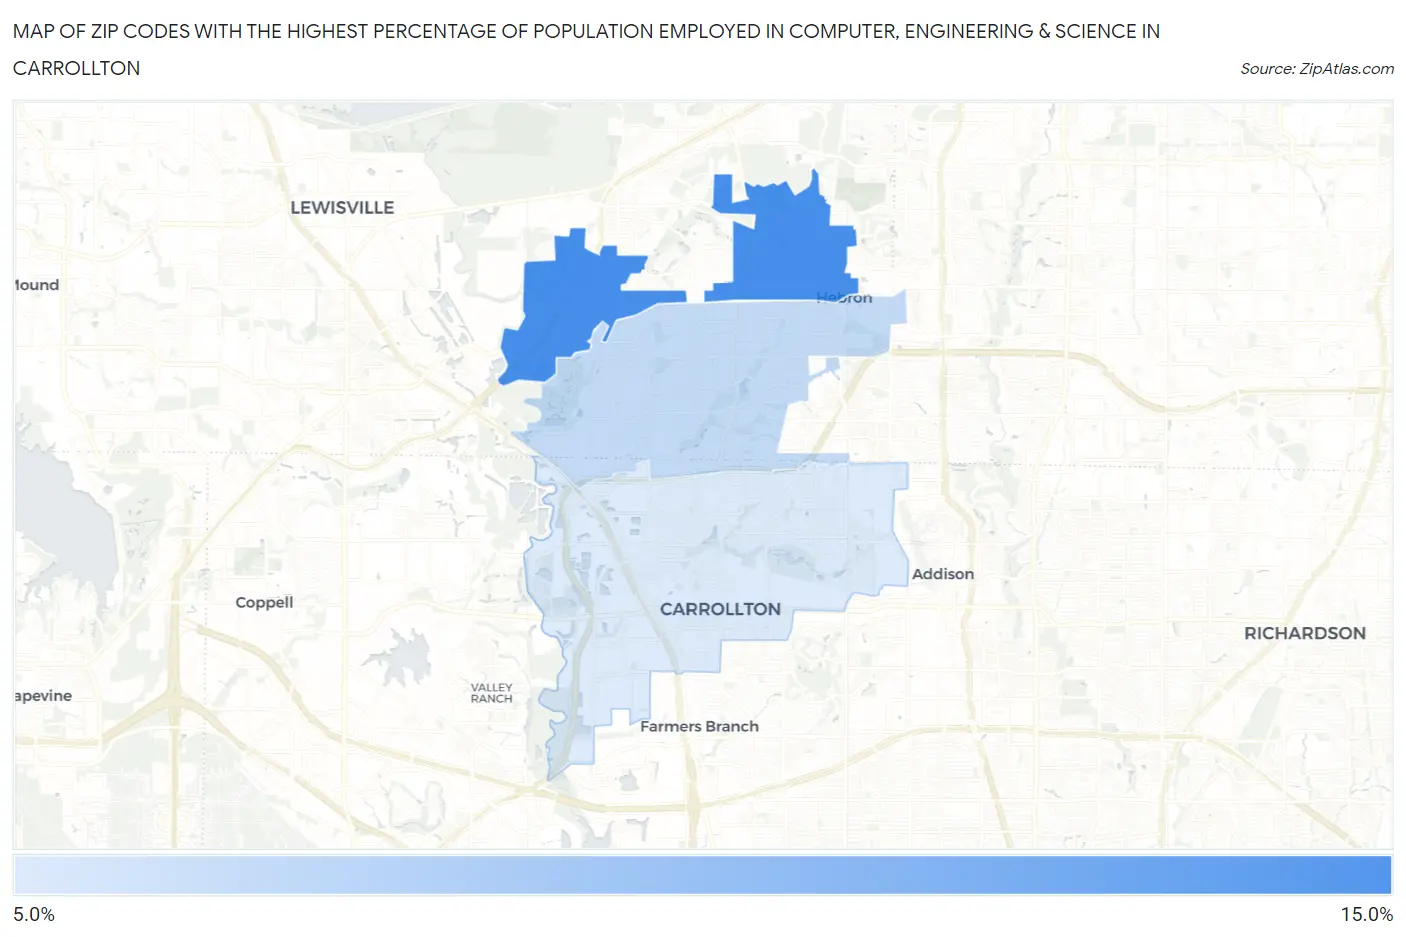
Map of Zip Codes with the Highest Percentage of Population Employed in Computer, Engineering & Science in Carrollton
6.9%
12.0%
Zip Codes with the Highest Percentage of Population Employed in Computer, Engineering & Science in Carrollton, TX
| Zip Code | % Employed | vs State | vs National | |
| 1. | 75010 | 12.0% | 6.5%(+5.47)#123 | 6.8%(+5.20)#2,054 |
| 2. | 75007 | 7.8% | 6.5%(+1.28)#295 | 6.8%(+1.01)#5,577 |
| 3. | 75006 | 6.9% | 6.5%(+0.407)#365 | 6.8%(+0.143)#6,955 |
1
Common Questions
What are the Top Zip Codes with the Highest Percentage of Population Employed in Computer, Engineering & Science in Carrollton, TX?
Top Zip Codes with the Highest Percentage of Population Employed in Computer, Engineering & Science in Carrollton, TX are:
What zip code has the Highest Percentage of Population Employed in Computer, Engineering & Science in Carrollton, TX?
75010 has the Highest Percentage of Population Employed in Computer, Engineering & Science in Carrollton, TX with 12.0%.
What is the Percentage of Population Employed in Computer, Engineering & Science in Carrollton, TX?
Percentage of Population Employed in Computer, Engineering & Science in Carrollton is 8.4%.
What is the Percentage of Population Employed in Computer, Engineering & Science in Texas?
Percentage of Population Employed in Computer, Engineering & Science in Texas is 6.5%.
What is the Percentage of Population Employed in Computer, Engineering & Science in the United States?
Percentage of Population Employed in Computer, Engineering & Science in the United States is 6.8%.