Zip Codes with the Highest Percentage of Population Employed in Computer, Engineering & Science in Greeneville, TN
RELATED REPORTS & OPTIONS
Computer, Engineering & Science
Greeneville
Compare Zip Codes
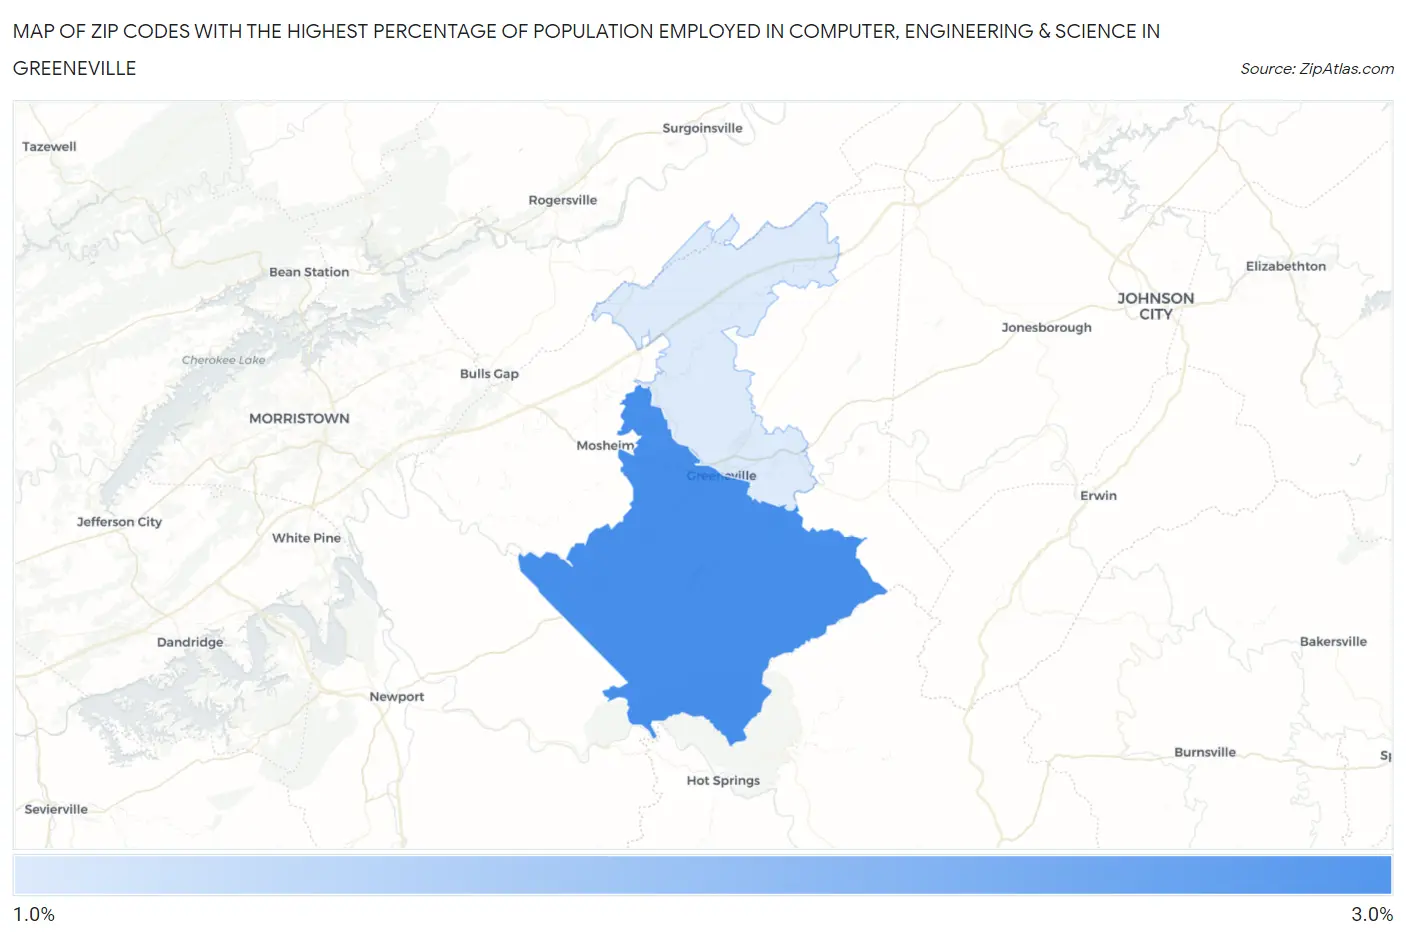
Map of Zip Codes with the Highest Percentage of Population Employed in Computer, Engineering & Science in Greeneville
1.9%
2.7%
Zip Codes with the Highest Percentage of Population Employed in Computer, Engineering & Science in Greeneville, TN
| Zip Code | % Employed | vs State | vs National | |
| 1. | 37743 | 2.7% | 5.1%(-2.43)#357 | 6.8%(-4.11)#19,418 |
| 2. | 37745 | 1.9% | 5.1%(-3.16)#426 | 6.8%(-4.84)#22,166 |
1
Common Questions
What are the Top Zip Codes with the Highest Percentage of Population Employed in Computer, Engineering & Science in Greeneville, TN?
Top Zip Codes with the Highest Percentage of Population Employed in Computer, Engineering & Science in Greeneville, TN are:
What zip code has the Highest Percentage of Population Employed in Computer, Engineering & Science in Greeneville, TN?
37743 has the Highest Percentage of Population Employed in Computer, Engineering & Science in Greeneville, TN with 2.7%.
What is the Percentage of Population Employed in Computer, Engineering & Science in Greeneville, TN?
Percentage of Population Employed in Computer, Engineering & Science in Greeneville is 1.3%.
What is the Percentage of Population Employed in Computer, Engineering & Science in Tennessee?
Percentage of Population Employed in Computer, Engineering & Science in Tennessee is 5.1%.
What is the Percentage of Population Employed in Computer, Engineering & Science in the United States?
Percentage of Population Employed in Computer, Engineering & Science in the United States is 6.8%.