Zip Codes with the Highest Percentage of Population Employed in Life, Physical & Social Science in Greeneville, TN
RELATED REPORTS & OPTIONS
Life, Physical & Social Science
Greeneville
Compare Zip Codes
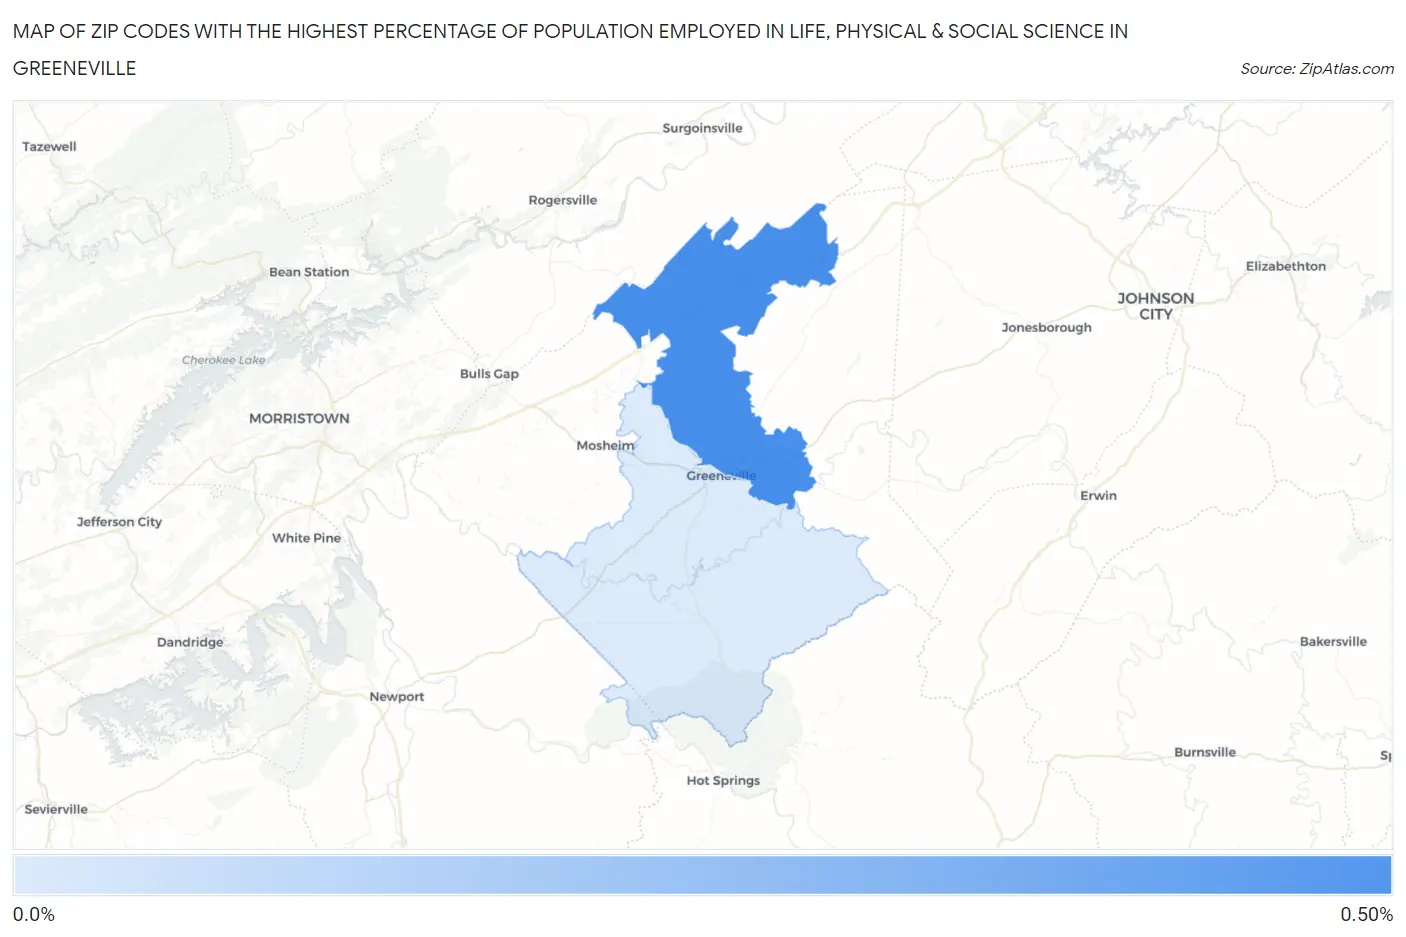
Map of Zip Codes with the Highest Percentage of Population Employed in Life, Physical & Social Science in Greeneville
0.081%
0.43%
Zip Codes with the Highest Percentage of Population Employed in Life, Physical & Social Science in Greeneville, TN
| Zip Code | % Employed | vs State | vs National | |
| 1. | 37745 | 0.43% | 0.83%(-0.405)#262 | 1.1%(-0.665)#15,421 |
| 2. | 37743 | 0.081% | 0.83%(-0.750)#359 | 1.1%(-1.01)#19,187 |
1
Common Questions
What are the Top Zip Codes with the Highest Percentage of Population Employed in Life, Physical & Social Science in Greeneville, TN?
Top Zip Codes with the Highest Percentage of Population Employed in Life, Physical & Social Science in Greeneville, TN are:
What zip code has the Highest Percentage of Population Employed in Life, Physical & Social Science in Greeneville, TN?
37745 has the Highest Percentage of Population Employed in Life, Physical & Social Science in Greeneville, TN with 0.43%.
What is the Percentage of Population Employed in Life, Physical & Social Science in Greeneville, TN?
Percentage of Population Employed in Life, Physical & Social Science in Greeneville is 0.12%.
What is the Percentage of Population Employed in Life, Physical & Social Science in Tennessee?
Percentage of Population Employed in Life, Physical & Social Science in Tennessee is 0.83%.
What is the Percentage of Population Employed in Life, Physical & Social Science in the United States?
Percentage of Population Employed in Life, Physical & Social Science in the United States is 1.1%.