Zip Codes with the Highest Percentage of Population Employed in Administrative & Support Services in Summerville, SC
RELATED REPORTS & OPTIONS
Administrative & Support Services
Summerville
Compare Zip Codes
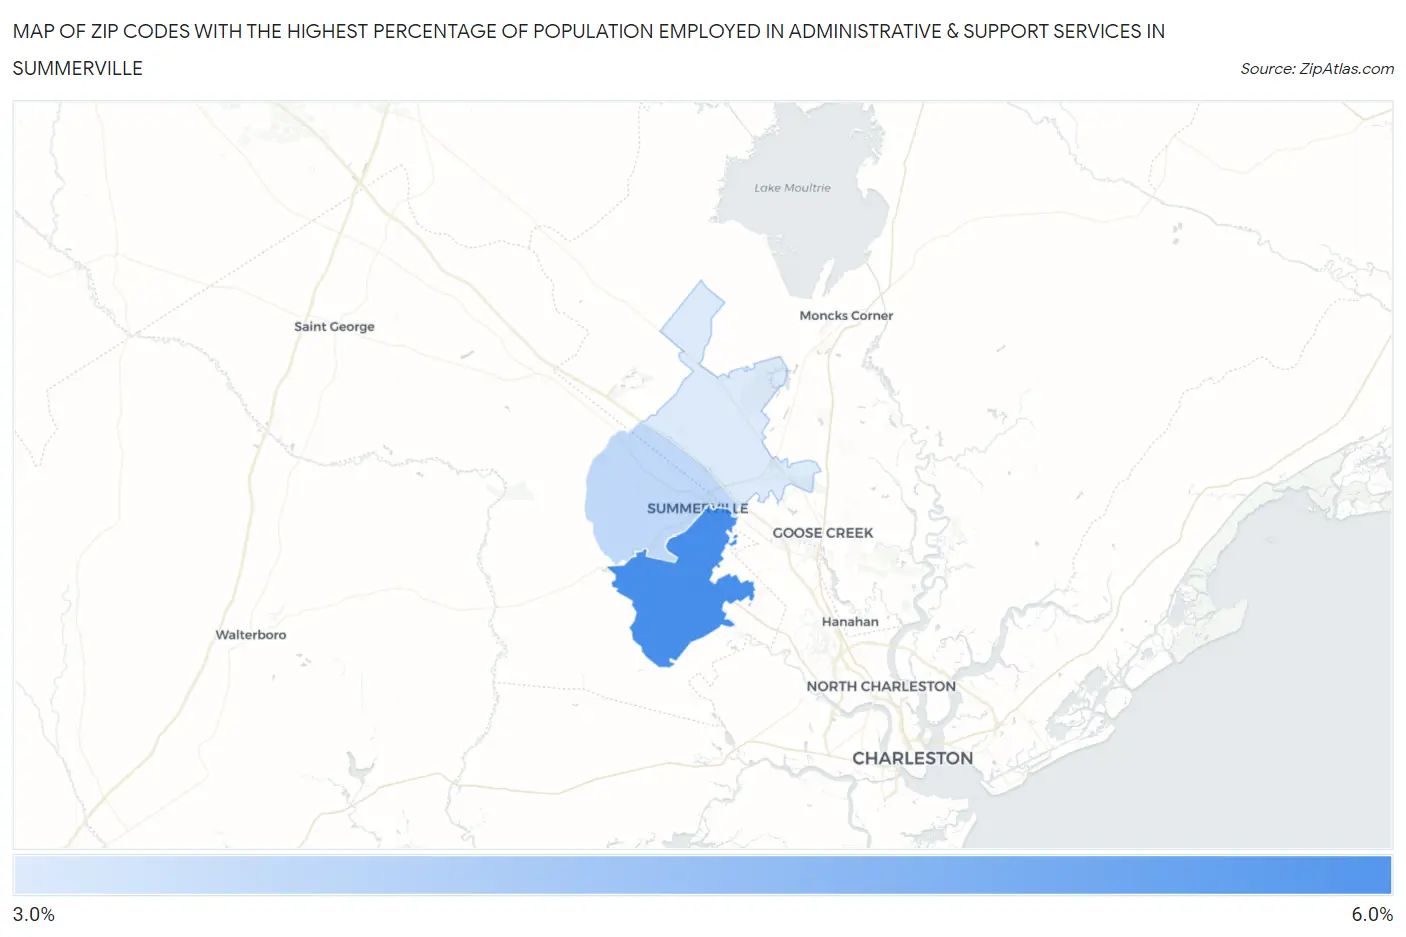
Map of Zip Codes with the Highest Percentage of Population Employed in Administrative & Support Services in Summerville
3.4%
5.6%
Zip Codes with the Highest Percentage of Population Employed in Administrative & Support Services in Summerville, SC
| Zip Code | % Employed | vs State | vs National | |
| 1. | 29485 | 5.6% | 4.8%(+0.707)#124 | 4.1%(+1.40)#5,707 |
| 2. | 29483 | 3.8% | 4.8%(-1.03)#242 | 4.1%(-0.331)#11,456 |
| 3. | 29486 | 3.4% | 4.8%(-1.47)#263 | 4.1%(-0.778)#13,581 |
1
Common Questions
What are the Top Zip Codes with the Highest Percentage of Population Employed in Administrative & Support Services in Summerville, SC?
Top Zip Codes with the Highest Percentage of Population Employed in Administrative & Support Services in Summerville, SC are:
What zip code has the Highest Percentage of Population Employed in Administrative & Support Services in Summerville, SC?
29485 has the Highest Percentage of Population Employed in Administrative & Support Services in Summerville, SC with 5.6%.
What is the Percentage of Population Employed in Administrative & Support Services in Summerville, SC?
Percentage of Population Employed in Administrative & Support Services in Summerville is 4.1%.
What is the Percentage of Population Employed in Administrative & Support Services in South Carolina?
Percentage of Population Employed in Administrative & Support Services in South Carolina is 4.8%.
What is the Percentage of Population Employed in Administrative & Support Services in the United States?
Percentage of Population Employed in Administrative & Support Services in the United States is 4.1%.