Zip Codes with the Highest Percentage of Population Employed in Food Preparation & Serving in Summerville, SC
RELATED REPORTS & OPTIONS
Food Preparation & Serving
Summerville
Compare Zip Codes
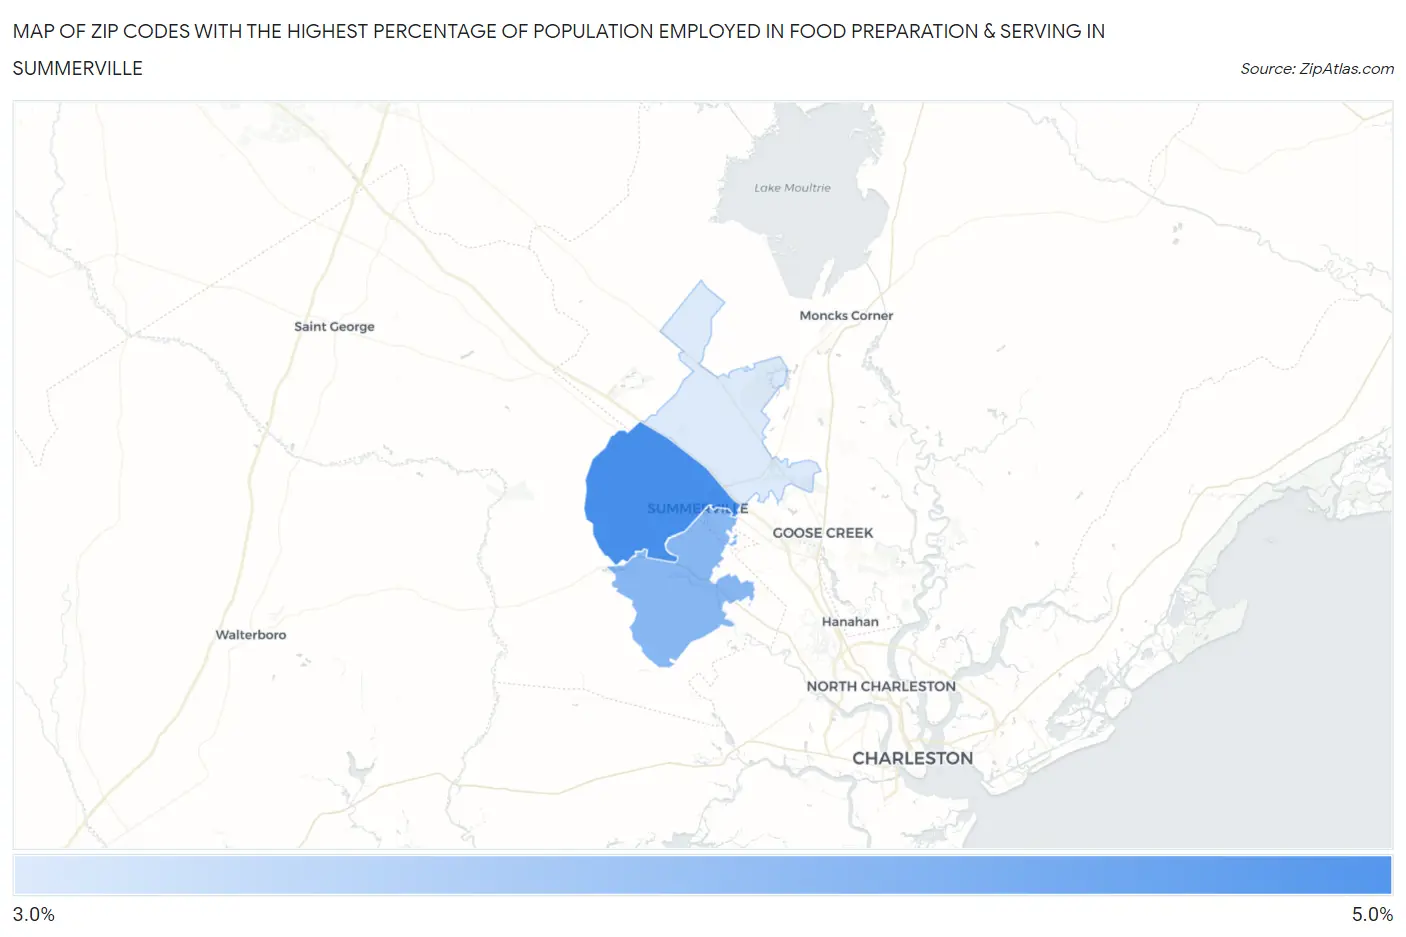
Map of Zip Codes with the Highest Percentage of Population Employed in Food Preparation & Serving in Summerville
3.8%
4.9%
Zip Codes with the Highest Percentage of Population Employed in Food Preparation & Serving in Summerville, SC
| Zip Code | % Employed | vs State | vs National | |
| 1. | 29483 | 4.9% | 5.8%(-0.914)#198 | 5.3%(-0.430)#13,533 |
| 2. | 29485 | 4.4% | 5.8%(-1.38)#233 | 5.3%(-0.901)#15,485 |
| 3. | 29486 | 3.8% | 5.8%(-2.00)#264 | 5.3%(-1.51)#18,029 |
1
Common Questions
What are the Top Zip Codes with the Highest Percentage of Population Employed in Food Preparation & Serving in Summerville, SC?
Top Zip Codes with the Highest Percentage of Population Employed in Food Preparation & Serving in Summerville, SC are:
What zip code has the Highest Percentage of Population Employed in Food Preparation & Serving in Summerville, SC?
29483 has the Highest Percentage of Population Employed in Food Preparation & Serving in Summerville, SC with 4.9%.
What is the Percentage of Population Employed in Food Preparation & Serving in Summerville, SC?
Percentage of Population Employed in Food Preparation & Serving in Summerville is 5.8%.
What is the Percentage of Population Employed in Food Preparation & Serving in South Carolina?
Percentage of Population Employed in Food Preparation & Serving in South Carolina is 5.8%.
What is the Percentage of Population Employed in Food Preparation & Serving in the United States?
Percentage of Population Employed in Food Preparation & Serving in the United States is 5.3%.