Zip Codes with the Highest Percentage of Population Employed in Security & Protection in Summerville, SC
RELATED REPORTS & OPTIONS
Security & Protection
Summerville
Compare Zip Codes
Map of Zip Codes with the Highest Percentage of Population Employed in Security & Protection in Summerville
2.1%
3.4%
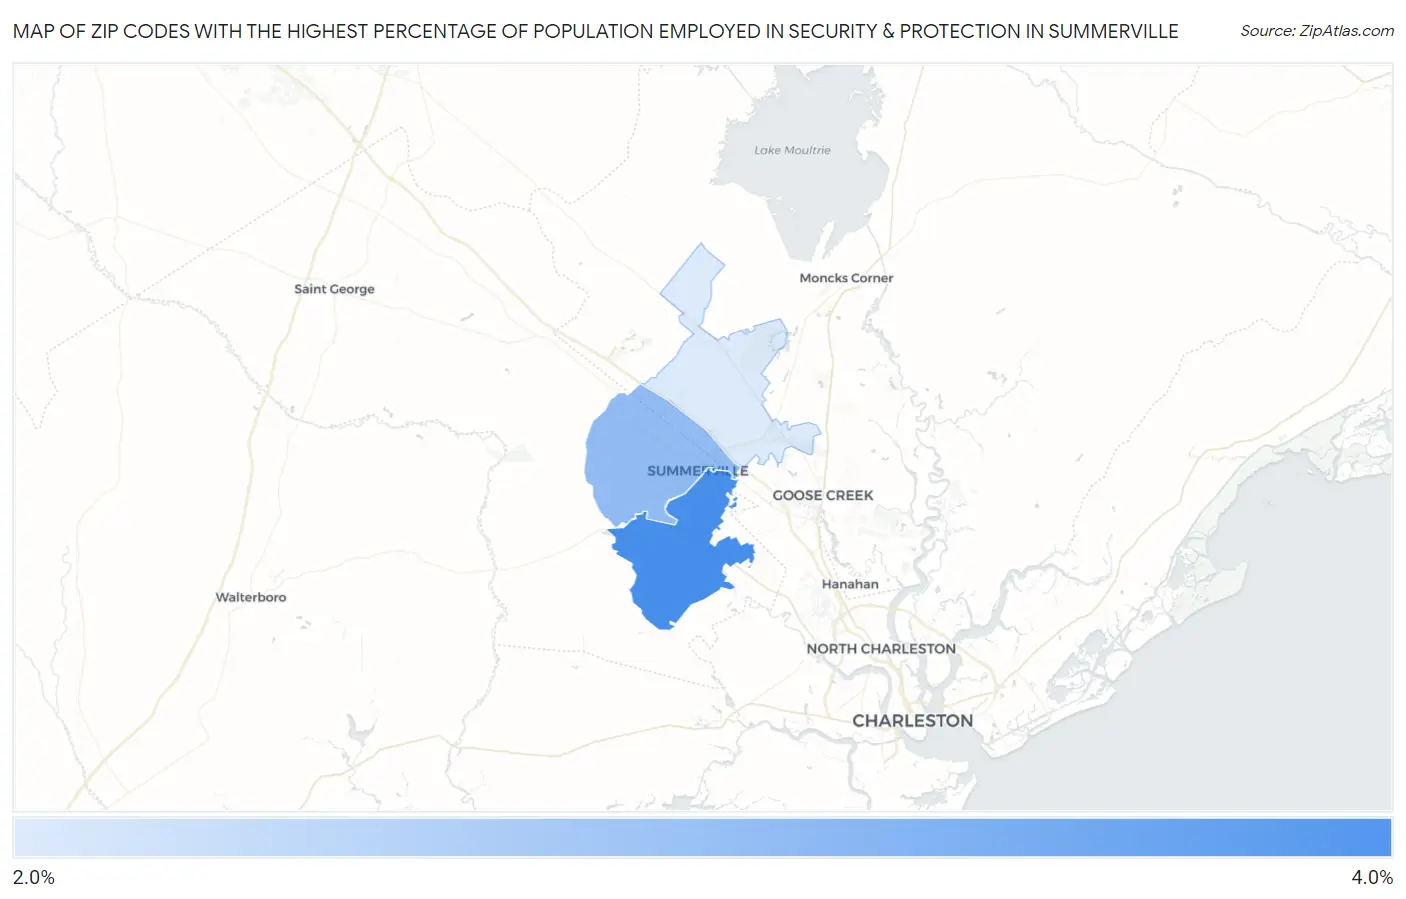
Zip Codes with the Highest Percentage of Population Employed in Security & Protection in Summerville, SC
| Zip Code | % Employed | vs State | vs National | |
| 1. | 29485 | 3.4% | 2.1%(+1.29)#85 | 2.1%(+1.24)#5,974 |
| 2. | 29483 | 2.8% | 2.1%(+0.678)#125 | 2.1%(+0.629)#8,199 |
| 3. | 29486 | 2.1% | 2.1%(+0.046)#168 | 2.1%(-0.003)#11,600 |
1
Common Questions
What are the Top Zip Codes with the Highest Percentage of Population Employed in Security & Protection in Summerville, SC?
Top Zip Codes with the Highest Percentage of Population Employed in Security & Protection in Summerville, SC are:
What zip code has the Highest Percentage of Population Employed in Security & Protection in Summerville, SC?
29485 has the Highest Percentage of Population Employed in Security & Protection in Summerville, SC with 3.4%.
What is the Percentage of Population Employed in Security & Protection in Summerville, SC?
Percentage of Population Employed in Security & Protection in Summerville is 3.3%.
What is the Percentage of Population Employed in Security & Protection in South Carolina?
Percentage of Population Employed in Security & Protection in South Carolina is 2.1%.
What is the Percentage of Population Employed in Security & Protection in the United States?
Percentage of Population Employed in Security & Protection in the United States is 2.1%.