Zip Codes with the Highest Percentage of Households with Income Below $10,000 in San Juan, PR
RELATED REPORTS & OPTIONS
Household Income | $0-10k
San Juan
Compare Zip Codes
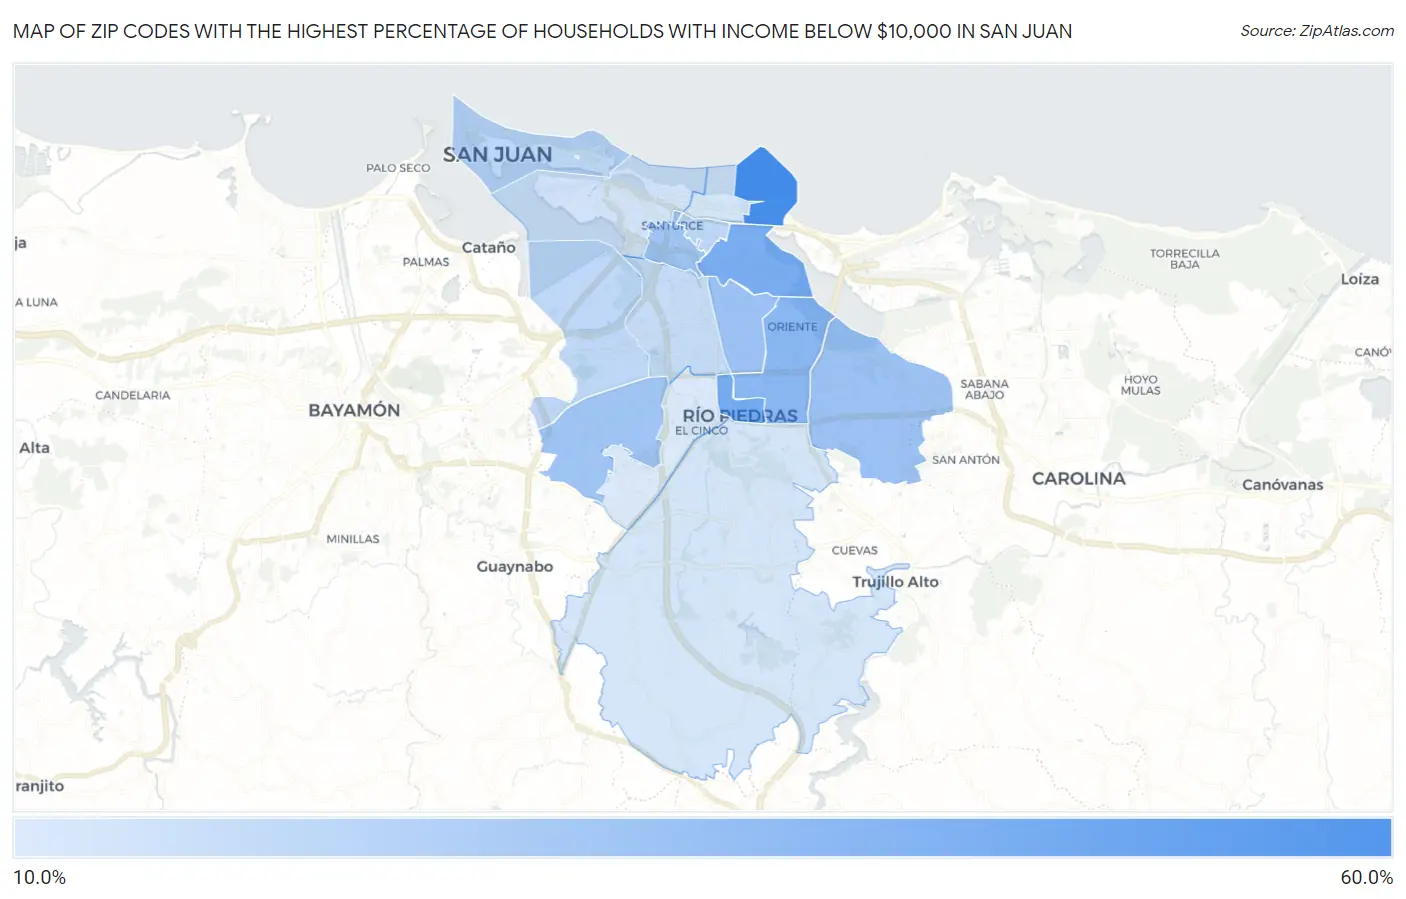
Map of Zip Codes with the Highest Percentage of Households with Income Below $10,000 in San Juan
12.8%
59.0%
Zip Codes with the Highest Percentage of Households with Income Below $10,000 in San Juan, PR
| Zip Code | Households with Income < $10k | vs State | vs National | |
| 1. | 00913 | 59.0% | 22.7%(+36.3)#2 | 4.9%(+54.1)#80 |
| 2. | 00925 | 42.9% | 22.7%(+20.2)#4 | 4.9%(+38.0)#151 |
| 3. | 00915 | 41.2% | 22.7%(+18.5)#5 | 4.9%(+36.3)#164 |
| 4. | 00923 | 36.4% | 22.7%(+13.7)#10 | 4.9%(+31.5)#205 |
| 5. | 00917 | 30.8% | 22.7%(+8.10)#23 | 4.9%(+25.9)#308 |
| 6. | 00924 | 30.5% | 22.7%(+7.80)#24 | 4.9%(+25.6)#316 |
| 7. | 00909 | 29.6% | 22.7%(+6.90)#27 | 4.9%(+24.7)#333 |
| 8. | 00921 | 29.2% | 22.7%(+6.50)#30 | 4.9%(+24.3)#344 |
| 9. | 00901 | 21.7% | 22.7%(-1.000)#75 | 4.9%(+16.8)#651 |
| 10. | 00912 | 21.5% | 22.7%(-1.20)#78 | 4.9%(+16.6)#667 |
| 11. | 00920 | 21.0% | 22.7%(-1.70)#80 | 4.9%(+16.1)#706 |
| 12. | 00918 | 19.2% | 22.7%(-3.50)#96 | 4.9%(+14.3)#879 |
| 13. | 00907 | 15.6% | 22.7%(-7.10)#112 | 4.9%(+10.7)#1,411 |
| 14. | 00911 | 15.1% | 22.7%(-7.60)#115 | 4.9%(+10.2)#1,500 |
| 15. | 00926 | 14.8% | 22.7%(-7.90)#116 | 4.9%(+9.90)#1,560 |
| 16. | 00927 | 12.8% | 22.7%(-9.90)#121 | 4.9%(+7.90)#2,160 |
1
Common Questions
What are the Top 10 Zip Codes with the Highest Percentage of Households with Income Below $10,000 in San Juan, PR?
Top 10 Zip Codes with the Highest Percentage of Households with Income Below $10,000 in San Juan, PR are:
What zip code has the Highest Percentage of Households with Income Below $10,000 in San Juan, PR?
00913 has the Highest Percentage of Households with Income Below $10,000 in San Juan, PR with 59.0%.
What is the Percentage of Households with Income Below $10,000 in San Juan, PR?
Percentage of Households with Income Below $10,000 in San Juan is 24.9%.
What is the Percentage of Households with Income Below $10,000 in Puerto Rico?
Percentage of Households with Income Below $10,000 in Puerto Rico is 22.7%.
What is the Percentage of Households with Income Below $10,000 in the United States?
Percentage of Households with Income Below $10,000 in the United States is 4.9%.