Zip Codes with the Highest Percentage of Population Employed in Accommodation & Food Services in San Juan, PR
RELATED REPORTS & OPTIONS
Accommodation & Food Services
San Juan
Compare Zip Codes
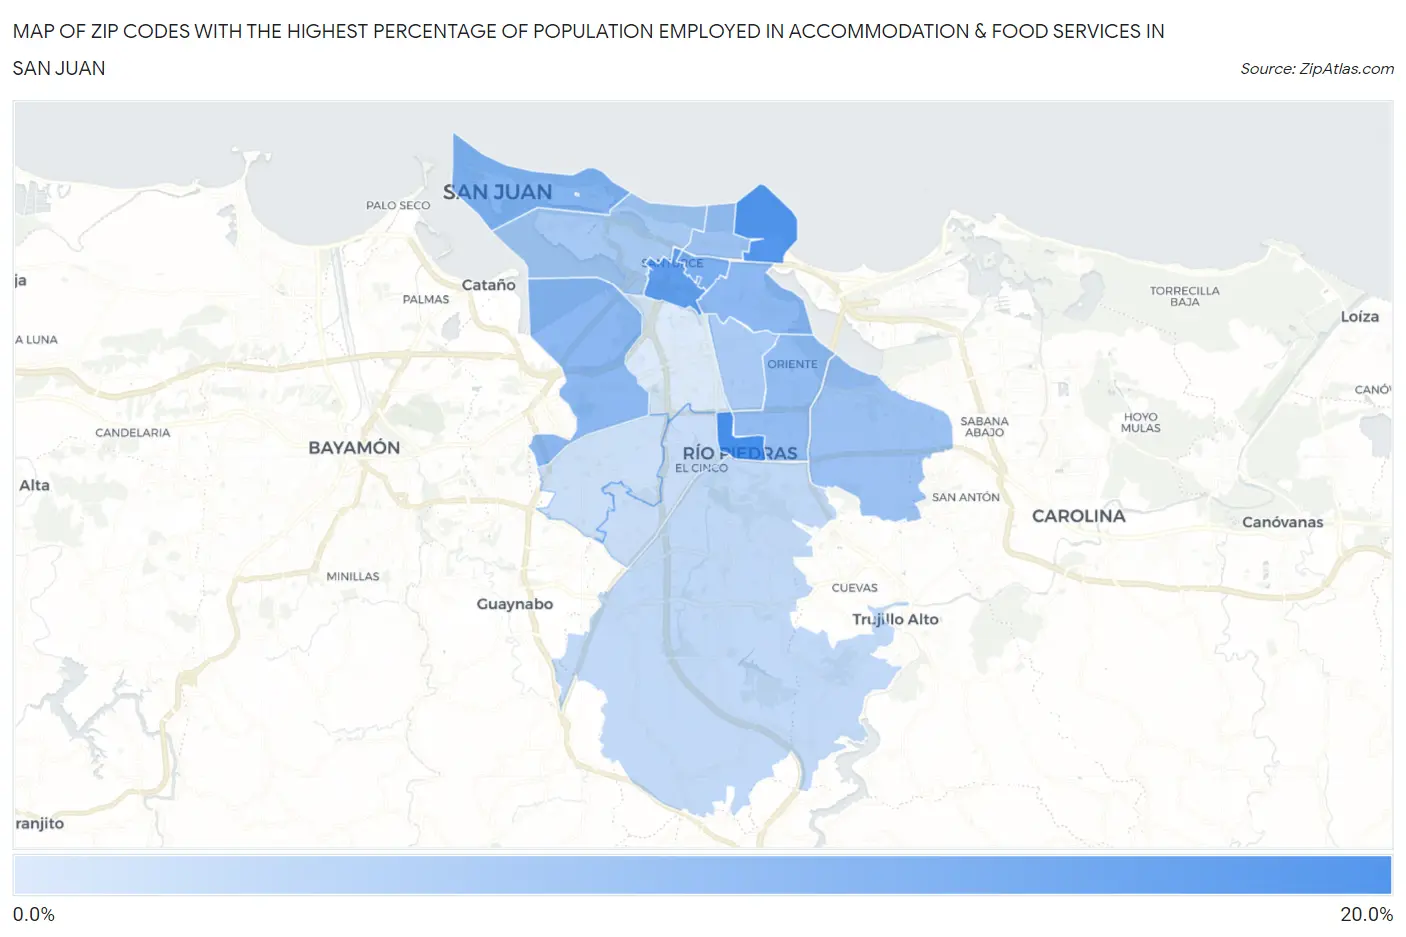
Map of Zip Codes with the Highest Percentage of Population Employed in Accommodation & Food Services in San Juan
4.3%
17.0%
Zip Codes with the Highest Percentage of Population Employed in Accommodation & Food Services in San Juan, PR
| Zip Code | % Employed | vs State | vs National | |
| 1. | 00925 | 17.0% | 8.2%(+8.75)#5 | 6.9%(+10.1)#1,272 |
| 2. | 00913 | 15.9% | 8.2%(+7.61)#9 | 6.9%(+8.97)#1,487 |
| 3. | 00909 | 14.7% | 8.2%(+6.50)#11 | 6.9%(+7.86)#1,748 |
| 4. | 00912 | 12.3% | 8.2%(+4.02)#17 | 6.9%(+5.38)#2,681 |
| 5. | 00901 | 11.5% | 8.2%(+3.24)#23 | 6.9%(+4.60)#3,170 |
| 6. | 00920 | 11.0% | 8.2%(+2.72)#29 | 6.9%(+4.08)#3,587 |
| 7. | 00915 | 10.9% | 8.2%(+2.64)#31 | 6.9%(+4.00)#3,654 |
| 8. | 00923 | 10.4% | 8.2%(+2.18)#34 | 6.9%(+3.54)#4,084 |
| 9. | 00911 | 9.7% | 8.2%(+1.46)#40 | 6.9%(+2.82)#4,926 |
| 10. | 00924 | 9.6% | 8.2%(+1.39)#44 | 6.9%(+2.75)#5,021 |
| 11. | 00907 | 8.7% | 8.2%(+0.423)#58 | 6.9%(+1.78)#6,539 |
| 12. | 00917 | 8.5% | 8.2%(+0.248)#62 | 6.9%(+1.61)#6,842 |
| 13. | 00926 | 6.5% | 8.2%(-1.73)#92 | 6.9%(-0.373)#11,827 |
| 14. | 00927 | 5.8% | 8.2%(-2.42)#102 | 6.9%(-1.06)#14,017 |
| 15. | 00921 | 5.7% | 8.2%(-2.54)#105 | 6.9%(-1.18)#14,376 |
| 16. | 00918 | 4.3% | 8.2%(-3.92)#120 | 6.9%(-2.56)#19,104 |
1
Common Questions
What are the Top 10 Zip Codes with the Highest Percentage of Population Employed in Accommodation & Food Services in San Juan, PR?
Top 10 Zip Codes with the Highest Percentage of Population Employed in Accommodation & Food Services in San Juan, PR are:
What zip code has the Highest Percentage of Population Employed in Accommodation & Food Services in San Juan, PR?
00925 has the Highest Percentage of Population Employed in Accommodation & Food Services in San Juan, PR with 17.0%.
What is the Percentage of Population Employed in Accommodation & Food Services in San Juan, PR?
Percentage of Population Employed in Accommodation & Food Services in San Juan is 8.3%.
What is the Percentage of Population Employed in Accommodation & Food Services in Puerto Rico?
Percentage of Population Employed in Accommodation & Food Services in Puerto Rico is 8.2%.
What is the Percentage of Population Employed in Accommodation & Food Services in the United States?
Percentage of Population Employed in Accommodation & Food Services in the United States is 6.9%.