Zip Codes with the Highest Percentage of Population with a Degree in Visual and Performing Arts in San Juan, PR
RELATED REPORTS & OPTIONS
Visual and Performing Arts
San Juan
Compare Zip Codes
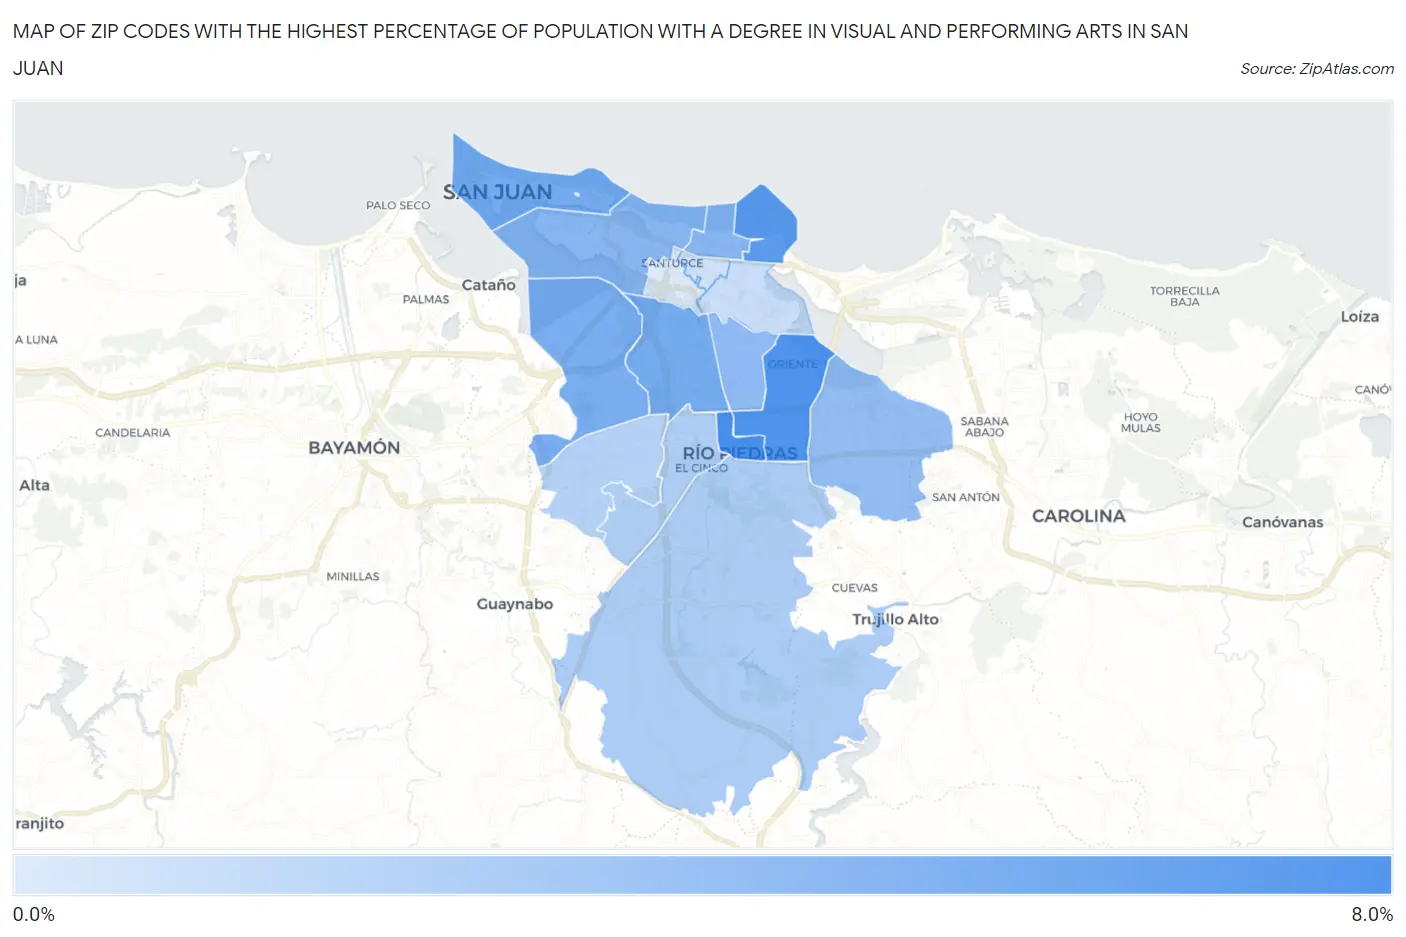
Map of Zip Codes with the Highest Percentage of Population with a Degree in Visual and Performing Arts in San Juan
1.2%
7.4%
Zip Codes with the Highest Percentage of Population with a Degree in Visual and Performing Arts in San Juan, PR
| Zip Code | % Graduates | vs State | vs National | |
| 1. | 00925 | 7.4% | 2.1%(+5.24)#2 | 4.3%(+3.14)#3,301 |
| 2. | 00923 | 7.1% | 2.1%(+4.92)#3 | 4.3%(+2.82)#3,591 |
| 3. | 00913 | 6.6% | 2.1%(+4.41)#4 | 4.3%(+2.31)#4,164 |
| 4. | 00901 | 5.4% | 2.1%(+3.27)#6 | 4.3%(+1.16)#5,825 |
| 5. | 00918 | 5.4% | 2.1%(+3.26)#7 | 4.3%(+1.16)#5,834 |
| 6. | 00920 | 5.3% | 2.1%(+3.14)#8 | 4.3%(+1.03)#6,085 |
| 7. | 00911 | 4.7% | 2.1%(+2.56)#9 | 4.3%(+0.460)#7,275 |
| 8. | 00907 | 4.7% | 2.1%(+2.52)#10 | 4.3%(+0.419)#7,363 |
| 9. | 00917 | 4.4% | 2.1%(+2.25)#13 | 4.3%(+0.143)#8,103 |
| 10. | 00924 | 4.2% | 2.1%(+2.06)#14 | 4.3%(-0.043)#8,600 |
| 11. | 00926 | 3.1% | 2.1%(+0.989)#26 | 4.3%(-1.12)#12,207 |
| 12. | 00927 | 3.0% | 2.1%(+0.890)#27 | 4.3%(-1.21)#12,596 |
| 13. | 00921 | 2.8% | 2.1%(+0.631)#31 | 4.3%(-1.47)#13,571 |
| 14. | 00915 | 2.0% | 2.1%(-0.149)#51 | 4.3%(-2.25)#16,457 |
| 15. | 00912 | 1.7% | 2.1%(-0.433)#65 | 4.3%(-2.54)#17,434 |
| 16. | 00909 | 1.2% | 2.1%(-0.951)#86 | 4.3%(-3.06)#19,094 |
1
Common Questions
What are the Top 10 Zip Codes with the Highest Percentage of Population with a Degree in Visual and Performing Arts in San Juan, PR?
Top 10 Zip Codes with the Highest Percentage of Population with a Degree in Visual and Performing Arts in San Juan, PR are:
What zip code has the Highest Percentage of Population with a Degree in Visual and Performing Arts in San Juan, PR?
00925 has the Highest Percentage of Population with a Degree in Visual and Performing Arts in San Juan, PR with 7.4%.
What is the Percentage of Population with a Degree in Visual and Performing Arts in San Juan, PR?
Percentage of Population with a Degree in Visual and Performing Arts in San Juan is 4.0%.
What is the Percentage of Population with a Degree in Visual and Performing Arts in Puerto Rico?
Percentage of Population with a Degree in Visual and Performing Arts in Puerto Rico is 2.1%.
What is the Percentage of Population with a Degree in Visual and Performing Arts in the United States?
Percentage of Population with a Degree in Visual and Performing Arts in the United States is 4.3%.