Zip Codes with the Highest Percentage of Population Employed in Legal Services & Support in San Juan, PR
RELATED REPORTS & OPTIONS
Legal Services & Support
San Juan
Compare Zip Codes
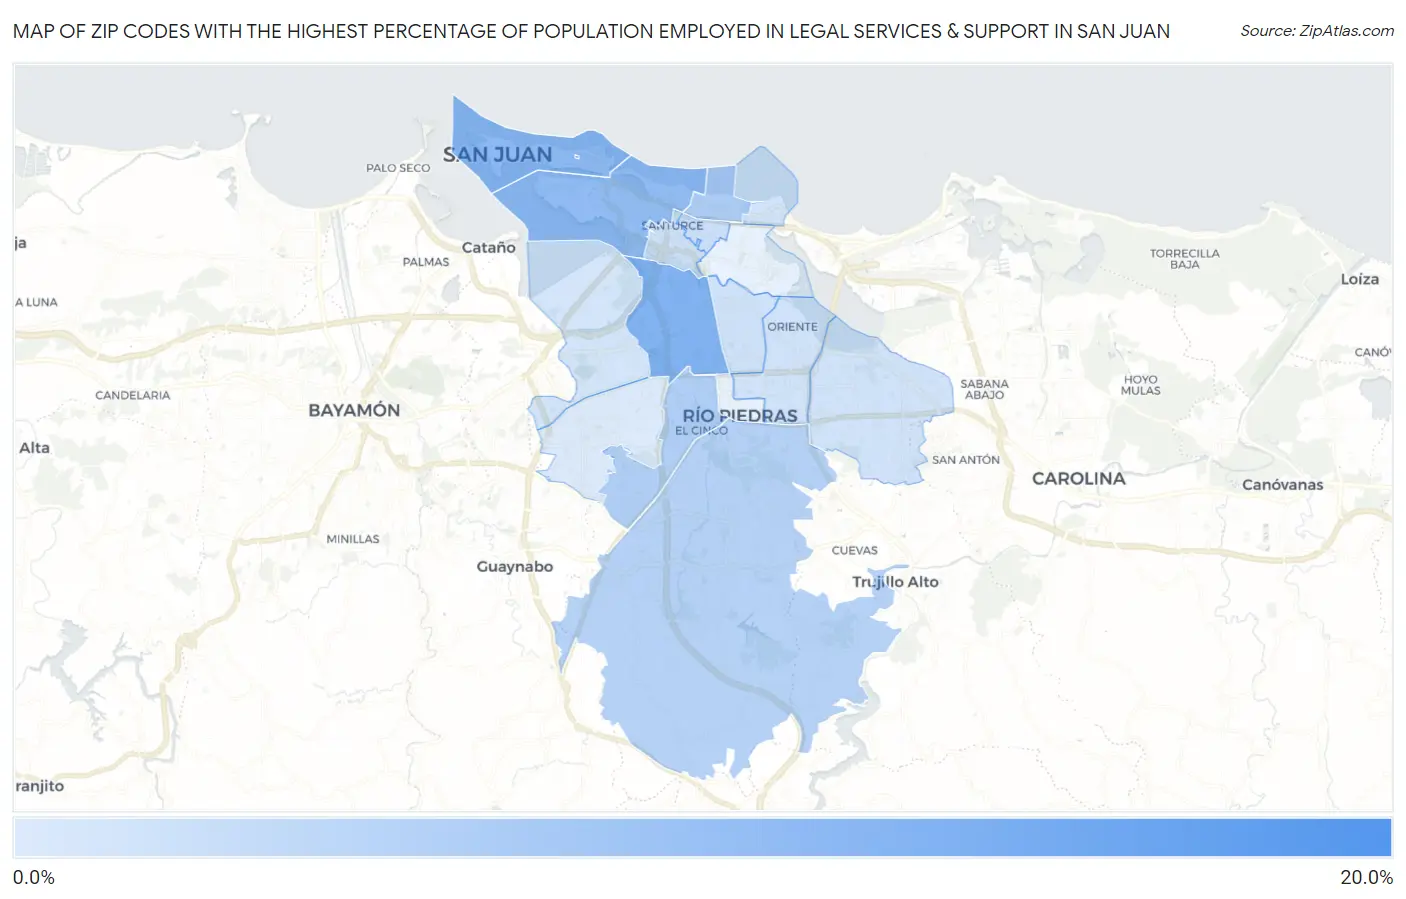
Map of Zip Codes with the Highest Percentage of Population Employed in Legal Services & Support in San Juan
0.11%
15.3%
Zip Codes with the Highest Percentage of Population Employed in Legal Services & Support in San Juan, PR
| Zip Code | % Employed | vs State | vs National | |
| 1. | 00906 | 15.3% | 1.0%(+14.3)#1 | 1.2%(+14.1)#78 |
| 2. | 00918 | 9.2% | 1.0%(+8.22)#3 | 1.2%(+8.03)#187 |
| 3. | 00901 | 7.9% | 1.0%(+6.94)#4 | 1.2%(+6.76)#272 |
| 4. | 00907 | 7.4% | 1.0%(+6.45)#5 | 1.2%(+6.27)#301 |
| 5. | 00911 | 4.7% | 1.0%(+3.67)#7 | 1.2%(+3.49)#818 |
| 6. | 00927 | 4.3% | 1.0%(+3.26)#8 | 1.2%(+3.08)#993 |
| 7. | 00926 | 3.9% | 1.0%(+2.90)#10 | 1.2%(+2.72)#1,180 |
| 8. | 00912 | 1.8% | 1.0%(+0.802)#14 | 1.2%(+0.618)#3,997 |
| 9. | 00909 | 1.7% | 1.0%(+0.740)#15 | 1.2%(+0.556)#4,176 |
| 10. | 00917 | 1.4% | 1.0%(+0.358)#22 | 1.2%(+0.174)#5,662 |
| 11. | 00924 | 1.3% | 1.0%(+0.313)#23 | 1.2%(+0.129)#5,870 |
| 12. | 00913 | 1.2% | 1.0%(+0.188)#25 | 1.2%(+0.005)#6,575 |
| 13. | 00923 | 1.2% | 1.0%(+0.156)#27 | 1.2%(-0.027)#6,784 |
| 14. | 00920 | 1.1% | 1.0%(+0.083)#28 | 1.2%(-0.100)#7,276 |
| 15. | 00921 | 0.11% | 1.0%(-0.891)#87 | 1.2%(-1.07)#17,041 |
1
Common Questions
What are the Top 10 Zip Codes with the Highest Percentage of Population Employed in Legal Services & Support in San Juan, PR?
Top 10 Zip Codes with the Highest Percentage of Population Employed in Legal Services & Support in San Juan, PR are:
What zip code has the Highest Percentage of Population Employed in Legal Services & Support in San Juan, PR?
00906 has the Highest Percentage of Population Employed in Legal Services & Support in San Juan, PR with 15.3%.
What is the Percentage of Population Employed in Legal Services & Support in San Juan, PR?
Percentage of Population Employed in Legal Services & Support in San Juan is 3.2%.
What is the Percentage of Population Employed in Legal Services & Support in Puerto Rico?
Percentage of Population Employed in Legal Services & Support in Puerto Rico is 1.0%.
What is the Percentage of Population Employed in Legal Services & Support in the United States?
Percentage of Population Employed in Legal Services & Support in the United States is 1.2%.