Zip Codes with the Highest Percentage of Households With Two or more Vehicles in San Juan, PR
RELATED REPORTS & OPTIONS
Households with 2 or more Cars
San Juan
Compare Zip Codes
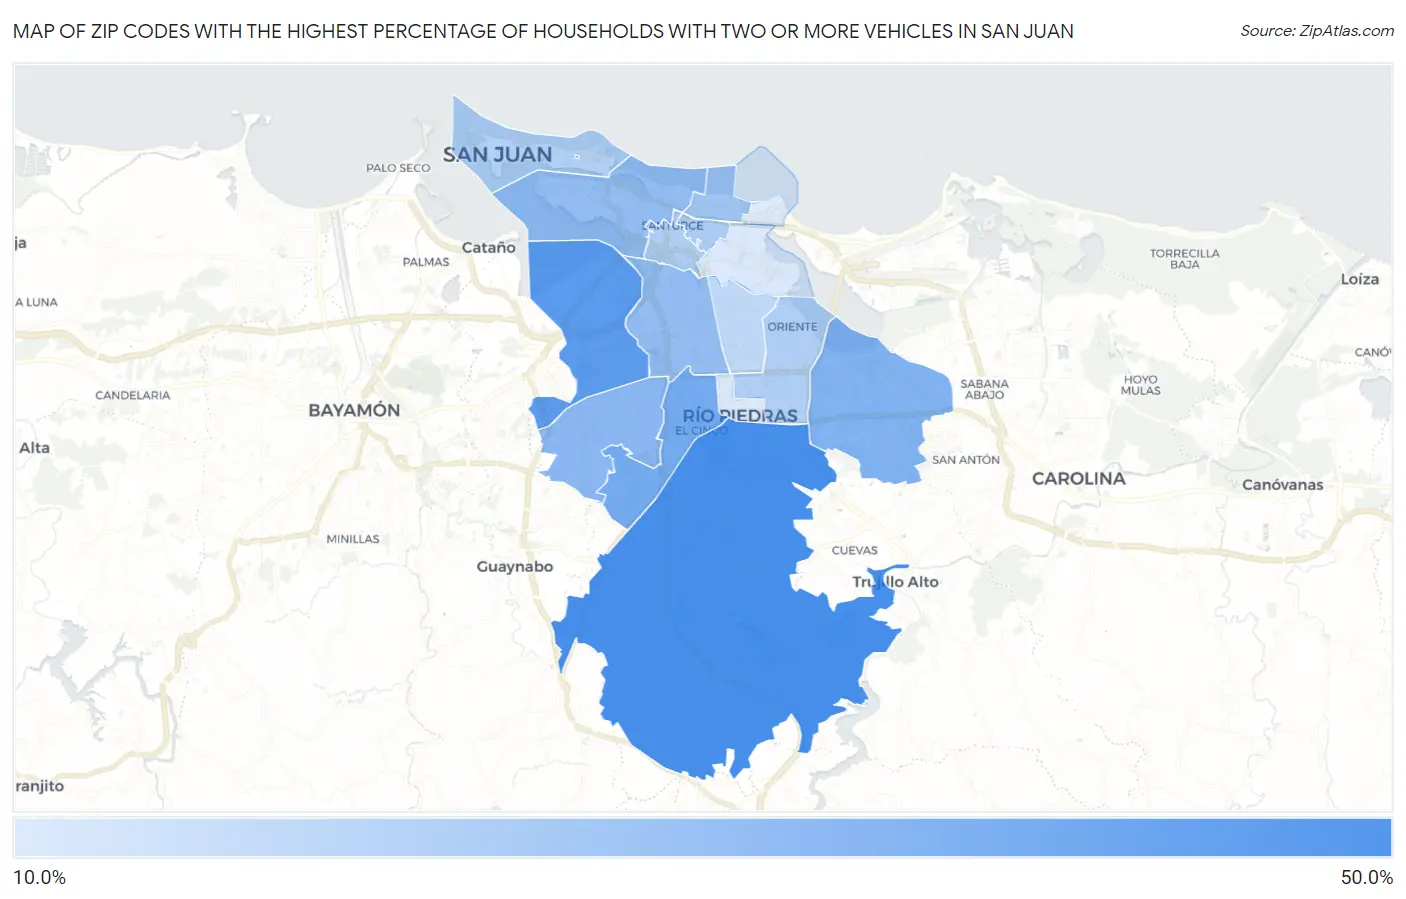
Map of Zip Codes with the Highest Percentage of Households With Two or more Vehicles in San Juan
13.7%
48.8%
Zip Codes with the Highest Percentage of Households With Two or more Vehicles in San Juan, PR
| Zip Code | Housholds With 2+ Cars | vs State | vs National | |
| 1. | 00926 | 48.8% | 44.9%(+3.90)#40 | 59.1%(-10.3)#28,435 |
| 2. | 00906 | 47.4% | 44.9%(+2.50)#51 | 59.1%(-11.7)#28,930 |
| 3. | 00920 | 43.2% | 44.9%(-1.70)#77 | 59.1%(-15.9)#29,886 |
| 4. | 00927 | 37.2% | 44.9%(-7.70)#100 | 59.1%(-21.9)#30,804 |
| 5. | 00924 | 34.0% | 44.9%(-10.9)#107 | 59.1%(-25.1)#31,145 |
| 6. | 00921 | 32.1% | 44.9%(-12.8)#110 | 59.1%(-27.0)#31,311 |
| 7. | 00907 | 30.0% | 44.9%(-14.9)#111 | 59.1%(-29.1)#31,468 |
| 8. | 00918 | 30.0% | 44.9%(-14.9)#112 | 59.1%(-29.1)#31,469 |
| 9. | 00911 | 27.4% | 44.9%(-17.5)#117 | 59.1%(-31.7)#31,644 |
| 10. | 00912 | 24.1% | 44.9%(-20.8)#120 | 59.1%(-35.0)#31,822 |
| 11. | 00909 | 22.9% | 44.9%(-22.0)#123 | 59.1%(-36.2)#31,880 |
| 12. | 00923 | 22.8% | 44.9%(-22.1)#124 | 59.1%(-36.3)#31,883 |
| 13. | 00901 | 22.7% | 44.9%(-22.2)#125 | 59.1%(-36.4)#31,885 |
| 14. | 00917 | 20.1% | 44.9%(-24.8)#127 | 59.1%(-39.0)#31,990 |
| 15. | 00925 | 14.3% | 44.9%(-30.6)#128 | 59.1%(-44.8)#32,182 |
| 16. | 00915 | 14.2% | 44.9%(-30.7)#129 | 59.1%(-44.9)#32,194 |
| 17. | 00913 | 13.7% | 44.9%(-31.2)#130 | 59.1%(-45.4)#32,206 |
1
Common Questions
What are the Top 10 Zip Codes with the Highest Percentage of Households With Two or more Vehicles in San Juan, PR?
Top 10 Zip Codes with the Highest Percentage of Households With Two or more Vehicles in San Juan, PR are:
What zip code has the Highest Percentage of Households With Two or more Vehicles in San Juan, PR?
00926 has the Highest Percentage of Households With Two or more Vehicles in San Juan, PR with 48.8%.
What is the Percentage of Households With Two or more Vehicles in San Juan, PR?
Percentage of Households With Two or more Vehicles in San Juan is 33.0%.
What is the Percentage of Households With Two or more Vehicles in Puerto Rico?
Percentage of Households With Two or more Vehicles in Puerto Rico is 44.9%.
What is the Percentage of Households With Two or more Vehicles in the United States?
Percentage of Households With Two or more Vehicles in the United States is 59.1%.