Zip Codes with the Highest Percentage of Households With One or more Vehicles in San Juan, PR
RELATED REPORTS & OPTIONS
Households with 1 or more Cars
San Juan
Compare Zip Codes
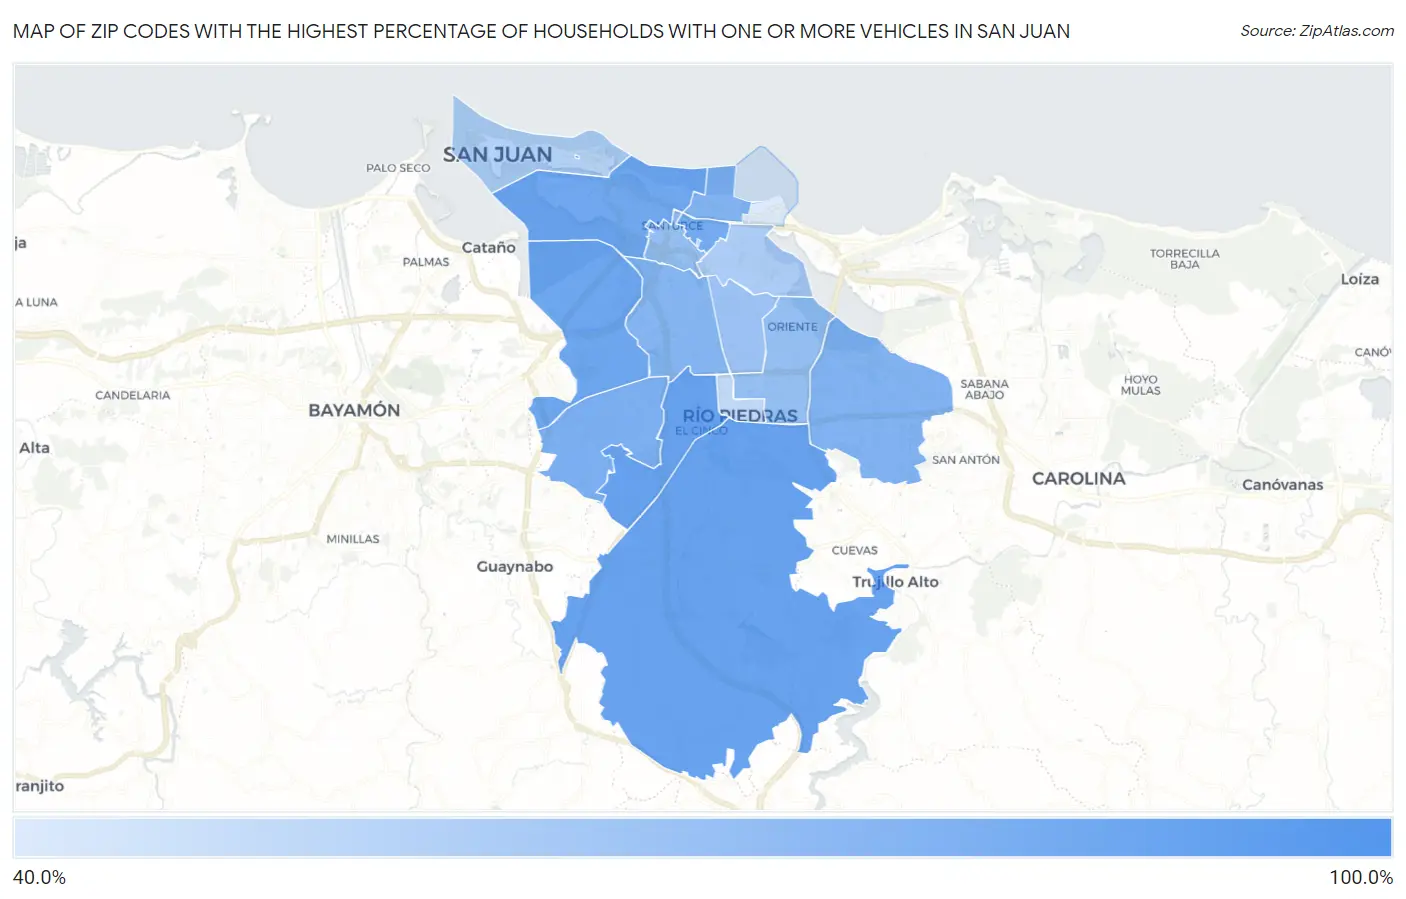
Map of Zip Codes with the Highest Percentage of Households With One or more Vehicles in San Juan
47.0%
100.0%
Zip Codes with the Highest Percentage of Households With One or more Vehicles in San Juan, PR
| Zip Code | Housholds With 1+ Cars | vs State | vs National | |
| 1. | 00906 | 100.0% | 86.0%(+14.0)#2 | 91.7%(+8.30)#3,378 |
| 2. | 00927 | 87.5% | 86.0%(+1.50)#53 | 91.7%(-4.20)#29,479 |
| 3. | 00926 | 87.1% | 86.0%(+1.10)#64 | 91.7%(-4.60)#29,654 |
| 4. | 00920 | 84.1% | 86.0%(-1.90)#94 | 91.7%(-7.60)#30,631 |
| 5. | 00907 | 83.4% | 86.0%(-2.60)#98 | 91.7%(-8.30)#30,773 |
| 6. | 00912 | 82.0% | 86.0%(-4.00)#103 | 91.7%(-9.70)#31,036 |
| 7. | 00921 | 79.0% | 86.0%(-7.00)#111 | 91.7%(-12.7)#31,420 |
| 8. | 00924 | 77.8% | 86.0%(-8.20)#113 | 91.7%(-13.9)#31,528 |
| 9. | 00911 | 77.5% | 86.0%(-8.50)#115 | 91.7%(-14.2)#31,561 |
| 10. | 00918 | 76.2% | 86.0%(-9.80)#117 | 91.7%(-15.5)#31,660 |
| 11. | 00923 | 70.2% | 86.0%(-15.8)#123 | 91.7%(-21.5)#32,006 |
| 12. | 00909 | 70.2% | 86.0%(-15.8)#124 | 91.7%(-21.5)#32,008 |
| 13. | 00917 | 67.5% | 86.0%(-18.5)#125 | 91.7%(-24.2)#32,109 |
| 14. | 00915 | 62.5% | 86.0%(-23.5)#126 | 91.7%(-29.2)#32,238 |
| 15. | 00901 | 60.3% | 86.0%(-25.7)#127 | 91.7%(-31.4)#32,300 |
| 16. | 00925 | 55.6% | 86.0%(-30.4)#128 | 91.7%(-36.1)#32,404 |
| 17. | 00913 | 47.0% | 86.0%(-39.0)#129 | 91.7%(-44.7)#32,499 |
1
Common Questions
What are the Top 10 Zip Codes with the Highest Percentage of Households With One or more Vehicles in San Juan, PR?
Top 10 Zip Codes with the Highest Percentage of Households With One or more Vehicles in San Juan, PR are:
What zip code has the Highest Percentage of Households With One or more Vehicles in San Juan, PR?
00906 has the Highest Percentage of Households With One or more Vehicles in San Juan, PR with 100.0%.
What is the Percentage of Households With One or more Vehicles in San Juan, PR?
Percentage of Households With One or more Vehicles in San Juan is 77.7%.
What is the Percentage of Households With One or more Vehicles in Puerto Rico?
Percentage of Households With One or more Vehicles in Puerto Rico is 86.0%.
What is the Percentage of Households With One or more Vehicles in the United States?
Percentage of Households With One or more Vehicles in the United States is 91.7%.