Zip Codes with the Highest Percentage of Population with a Degree in Liberal Arts and History in San Juan, PR
RELATED REPORTS & OPTIONS
Liberal Arts and History
San Juan
Compare Zip Codes
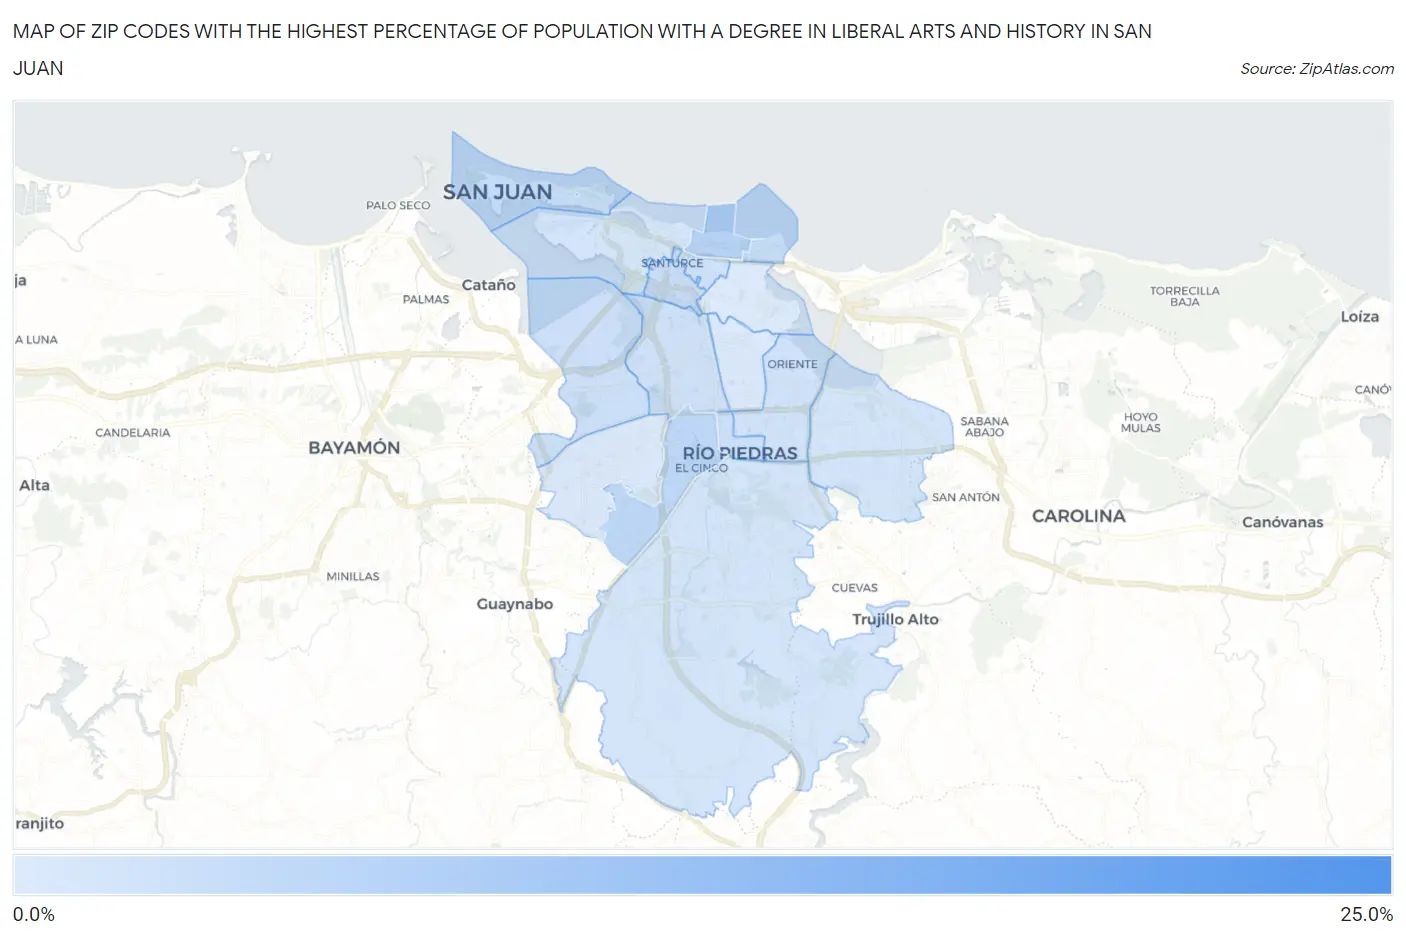
Map of Zip Codes with the Highest Percentage of Population with a Degree in Liberal Arts and History in San Juan
2.2%
22.2%
Zip Codes with the Highest Percentage of Population with a Degree in Liberal Arts and History in San Juan, PR
| Zip Code | % Graduates | vs State | vs National | |
| 1. | 00906 | 22.2% | 2.3%(+19.9)#1 | 4.9%(+17.4)#726 |
| 2. | 00911 | 7.0% | 2.3%(+4.64)#4 | 4.9%(+2.09)#6,451 |
| 3. | 00927 | 6.0% | 2.3%(+3.67)#7 | 4.9%(+1.12)#8,536 |
| 4. | 00901 | 5.1% | 2.3%(+2.80)#8 | 4.9%(+0.254)#10,953 |
| 5. | 00913 | 5.1% | 2.3%(+2.74)#9 | 4.9%(+0.189)#11,163 |
| 6. | 00909 | 4.7% | 2.3%(+2.40)#13 | 4.9%(-0.151)#12,255 |
| 7. | 00925 | 4.3% | 2.3%(+1.93)#16 | 4.9%(-0.614)#13,783 |
| 8. | 00920 | 4.1% | 2.3%(+1.77)#17 | 4.9%(-0.776)#14,423 |
| 9. | 00918 | 4.0% | 2.3%(+1.69)#18 | 4.9%(-0.856)#14,716 |
| 10. | 00912 | 3.9% | 2.3%(+1.59)#19 | 4.9%(-0.953)#15,110 |
| 11. | 00923 | 3.5% | 2.3%(+1.20)#21 | 4.9%(-1.35)#16,504 |
| 12. | 00907 | 3.4% | 2.3%(+1.11)#24 | 4.9%(-1.44)#16,861 |
| 13. | 00924 | 3.3% | 2.3%(+1.01)#27 | 4.9%(-1.54)#17,212 |
| 14. | 00926 | 3.3% | 2.3%(+1.00)#28 | 4.9%(-1.54)#17,215 |
| 15. | 00921 | 2.6% | 2.3%(+0.283)#40 | 4.9%(-2.26)#19,630 |
| 16. | 00917 | 2.4% | 2.3%(+0.102)#45 | 4.9%(-2.45)#20,200 |
| 17. | 00915 | 2.2% | 2.3%(-0.126)#53 | 4.9%(-2.67)#20,838 |
1
Common Questions
What are the Top 10 Zip Codes with the Highest Percentage of Population with a Degree in Liberal Arts and History in San Juan, PR?
Top 10 Zip Codes with the Highest Percentage of Population with a Degree in Liberal Arts and History in San Juan, PR are:
What zip code has the Highest Percentage of Population with a Degree in Liberal Arts and History in San Juan, PR?
00906 has the Highest Percentage of Population with a Degree in Liberal Arts and History in San Juan, PR with 22.2%.
What is the Percentage of Population with a Degree in Liberal Arts and History in San Juan, PR?
Percentage of Population with a Degree in Liberal Arts and History in San Juan is 3.8%.
What is the Percentage of Population with a Degree in Liberal Arts and History in Puerto Rico?
Percentage of Population with a Degree in Liberal Arts and History in Puerto Rico is 2.3%.
What is the Percentage of Population with a Degree in Liberal Arts and History in the United States?
Percentage of Population with a Degree in Liberal Arts and History in the United States is 4.9%.