Cree vs Chickasaw Female Poverty
COMPARE
Cree
Chickasaw
Female Poverty
Female Poverty Comparison
Cree
Chickasaw
15.1%
FEMALE POVERTY
0.7/ 100
METRIC RATING
236th/ 347
METRIC RANK
15.9%
FEMALE POVERTY
0.1/ 100
METRIC RATING
270th/ 347
METRIC RANK
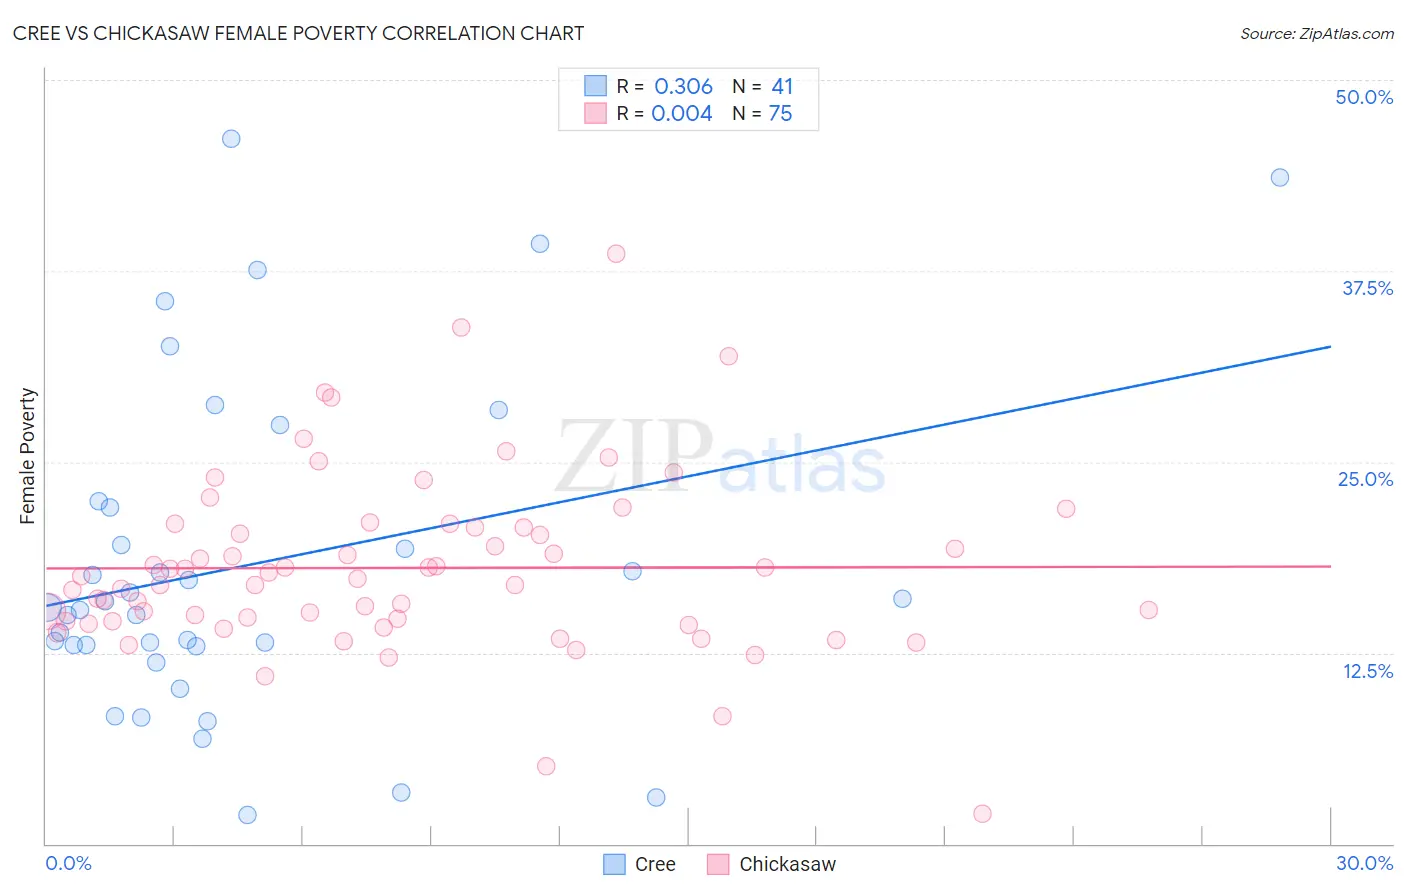
Cree vs Chickasaw Female Poverty Correlation Chart
The statistical analysis conducted on geographies consisting of 76,205,859 people shows a mild positive correlation between the proportion of Cree and poverty level among females in the United States with a correlation coefficient (R) of 0.306 and weighted average of 15.1%. Similarly, the statistical analysis conducted on geographies consisting of 147,658,289 people shows no correlation between the proportion of Chickasaw and poverty level among females in the United States with a correlation coefficient (R) of 0.004 and weighted average of 15.9%, a difference of 5.4%.
Female Poverty Correlation Summary
| Measurement | Cree | Chickasaw |
| Minimum | 1.9% | 1.9% |
| Maximum | 46.1% | 38.6% |
| Range | 44.3% | 36.7% |
| Mean | 18.3% | 18.1% |
| Median | 15.5% | 17.3% |
| Interquartile 25% (IQ1) | 13.0% | 14.6% |
| Interquartile 75% (IQ3) | 22.2% | 20.7% |
| Interquartile Range (IQR) | 9.2% | 6.1% |
| Standard Deviation (Sample) | 10.7% | 5.9% |
| Standard Deviation (Population) | 10.6% | 5.9% |
Similar Demographics by Female Poverty
Demographics Similar to Cree by Female Poverty
In terms of female poverty, the demographic groups most similar to Cree are French American Indian (15.1%, a difference of 0.19%), Immigrants from Armenia (15.1%, a difference of 0.26%), Immigrants from Laos (15.0%, a difference of 0.63%), Immigrants from Middle Africa (15.2%, a difference of 0.78%), and Sudanese (15.2%, a difference of 0.84%).
| Demographics | Rating | Rank | Female Poverty |
| Ghanaians | 1.9 /100 | #229 | Tragic 14.7% |
| Alaska Natives | 1.8 /100 | #230 | Tragic 14.7% |
| Nigerians | 1.7 /100 | #231 | Tragic 14.8% |
| Osage | 1.5 /100 | #232 | Tragic 14.8% |
| Immigrants | Saudi Arabia | 1.4 /100 | #233 | Tragic 14.8% |
| Fijians | 1.1 /100 | #234 | Tragic 14.9% |
| Immigrants | Laos | 0.9 /100 | #235 | Tragic 15.0% |
| Cree | 0.7 /100 | #236 | Tragic 15.1% |
| French American Indians | 0.6 /100 | #237 | Tragic 15.1% |
| Immigrants | Armenia | 0.6 /100 | #238 | Tragic 15.1% |
| Immigrants | Middle Africa | 0.5 /100 | #239 | Tragic 15.2% |
| Sudanese | 0.5 /100 | #240 | Tragic 15.2% |
| Immigrants | Sudan | 0.4 /100 | #241 | Tragic 15.2% |
| Nepalese | 0.4 /100 | #242 | Tragic 15.2% |
| Nicaraguans | 0.3 /100 | #243 | Tragic 15.3% |
Demographics Similar to Chickasaw by Female Poverty
In terms of female poverty, the demographic groups most similar to Chickasaw are Iroquois (15.8%, a difference of 0.26%), Immigrants from St. Vincent and the Grenadines (15.9%, a difference of 0.28%), Belizean (15.9%, a difference of 0.50%), Haitian (15.9%, a difference of 0.51%), and Barbadian (15.9%, a difference of 0.51%).
| Demographics | Rating | Rank | Female Poverty |
| Cherokee | 0.1 /100 | #263 | Tragic 15.6% |
| Immigrants | Ecuador | 0.1 /100 | #264 | Tragic 15.6% |
| Immigrants | Liberia | 0.1 /100 | #265 | Tragic 15.7% |
| Immigrants | El Salvador | 0.1 /100 | #266 | Tragic 15.7% |
| Sub-Saharan Africans | 0.1 /100 | #267 | Tragic 15.8% |
| Immigrants | Nicaragua | 0.1 /100 | #268 | Tragic 15.8% |
| Iroquois | 0.1 /100 | #269 | Tragic 15.8% |
| Chickasaw | 0.1 /100 | #270 | Tragic 15.9% |
| Immigrants | St. Vincent and the Grenadines | 0.0 /100 | #271 | Tragic 15.9% |
| Belizeans | 0.0 /100 | #272 | Tragic 15.9% |
| Haitians | 0.0 /100 | #273 | Tragic 15.9% |
| Barbadians | 0.0 /100 | #274 | Tragic 15.9% |
| Immigrants | Barbados | 0.0 /100 | #275 | Tragic 16.0% |
| Central Americans | 0.0 /100 | #276 | Tragic 16.0% |
| Bangladeshis | 0.0 /100 | #277 | Tragic 16.0% |