Cree vs Hispanic or Latino Female Poverty
COMPARE
Cree
Hispanic or Latino
Female Poverty
Female Poverty Comparison
Cree
Hispanics or Latinos
15.1%
FEMALE POVERTY
0.7/ 100
METRIC RATING
236th/ 347
METRIC RANK
16.6%
FEMALE POVERTY
0.0/ 100
METRIC RATING
299th/ 347
METRIC RANK
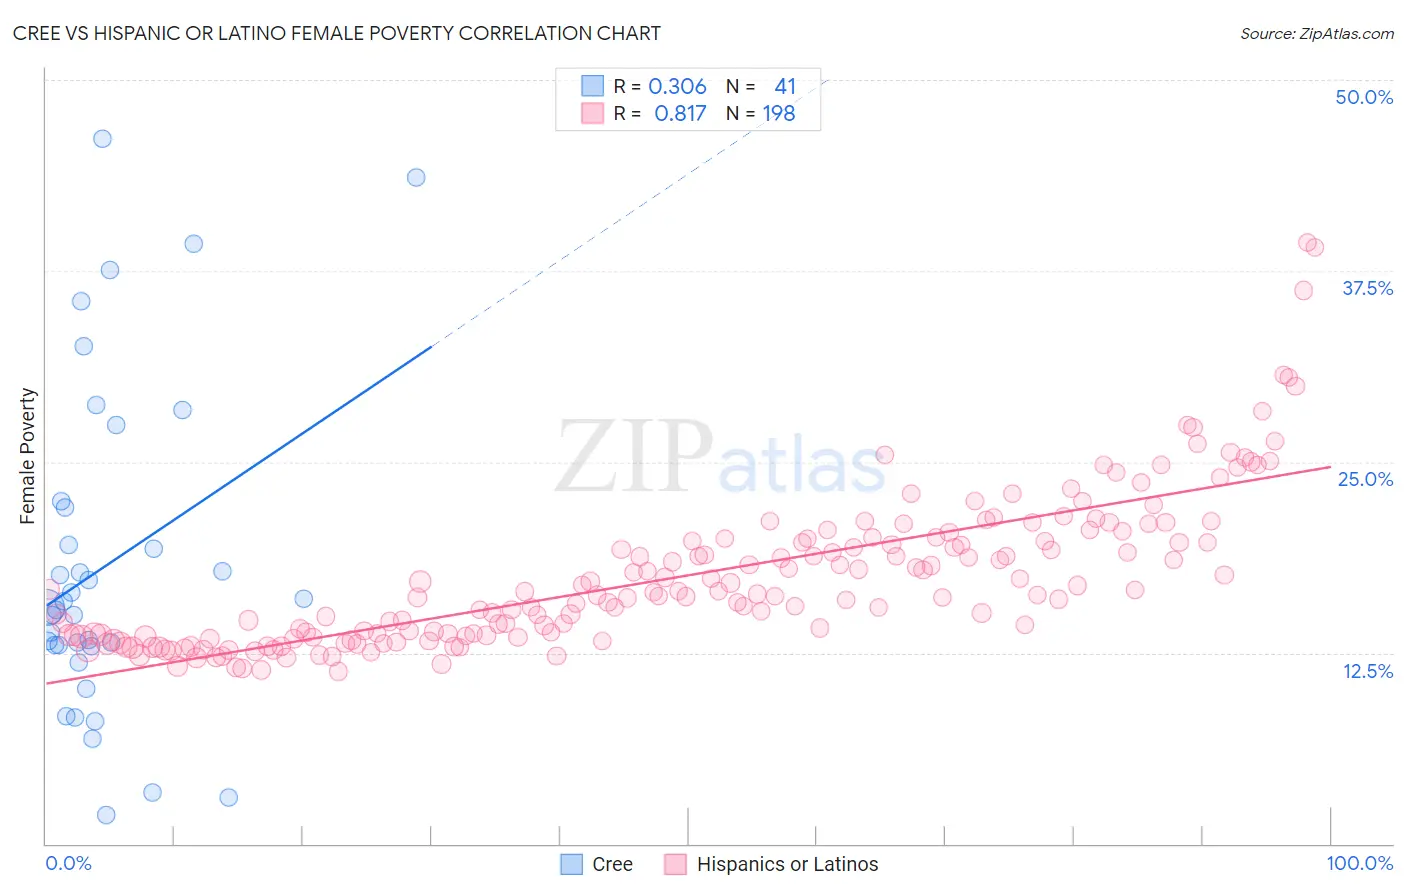
Cree vs Hispanic or Latino Female Poverty Correlation Chart
The statistical analysis conducted on geographies consisting of 76,205,859 people shows a mild positive correlation between the proportion of Cree and poverty level among females in the United States with a correlation coefficient (R) of 0.306 and weighted average of 15.1%. Similarly, the statistical analysis conducted on geographies consisting of 574,030,648 people shows a very strong positive correlation between the proportion of Hispanics or Latinos and poverty level among females in the United States with a correlation coefficient (R) of 0.817 and weighted average of 16.6%, a difference of 10.5%.
Female Poverty Correlation Summary
| Measurement | Cree | Hispanic or Latino |
| Minimum | 1.9% | 11.3% |
| Maximum | 46.1% | 39.4% |
| Range | 44.3% | 28.1% |
| Mean | 18.3% | 17.5% |
| Median | 15.5% | 16.3% |
| Interquartile 25% (IQ1) | 13.0% | 13.6% |
| Interquartile 75% (IQ3) | 22.2% | 19.8% |
| Interquartile Range (IQR) | 9.2% | 6.2% |
| Standard Deviation (Sample) | 10.7% | 5.0% |
| Standard Deviation (Population) | 10.6% | 5.0% |
Similar Demographics by Female Poverty
Demographics Similar to Cree by Female Poverty
In terms of female poverty, the demographic groups most similar to Cree are French American Indian (15.1%, a difference of 0.19%), Immigrants from Armenia (15.1%, a difference of 0.26%), Immigrants from Laos (15.0%, a difference of 0.63%), Immigrants from Middle Africa (15.2%, a difference of 0.78%), and Sudanese (15.2%, a difference of 0.84%).
| Demographics | Rating | Rank | Female Poverty |
| Ghanaians | 1.9 /100 | #229 | Tragic 14.7% |
| Alaska Natives | 1.8 /100 | #230 | Tragic 14.7% |
| Nigerians | 1.7 /100 | #231 | Tragic 14.8% |
| Osage | 1.5 /100 | #232 | Tragic 14.8% |
| Immigrants | Saudi Arabia | 1.4 /100 | #233 | Tragic 14.8% |
| Fijians | 1.1 /100 | #234 | Tragic 14.9% |
| Immigrants | Laos | 0.9 /100 | #235 | Tragic 15.0% |
| Cree | 0.7 /100 | #236 | Tragic 15.1% |
| French American Indians | 0.6 /100 | #237 | Tragic 15.1% |
| Immigrants | Armenia | 0.6 /100 | #238 | Tragic 15.1% |
| Immigrants | Middle Africa | 0.5 /100 | #239 | Tragic 15.2% |
| Sudanese | 0.5 /100 | #240 | Tragic 15.2% |
| Immigrants | Sudan | 0.4 /100 | #241 | Tragic 15.2% |
| Nepalese | 0.4 /100 | #242 | Tragic 15.2% |
| Nicaraguans | 0.3 /100 | #243 | Tragic 15.3% |
Demographics Similar to Hispanics or Latinos by Female Poverty
In terms of female poverty, the demographic groups most similar to Hispanics or Latinos are Bahamian (16.6%, a difference of 0.040%), Guatemalan (16.7%, a difference of 0.38%), Chippewa (16.7%, a difference of 0.40%), Somali (16.6%, a difference of 0.52%), and Mexican (16.5%, a difference of 0.73%).
| Demographics | Rating | Rank | Female Poverty |
| Immigrants | Zaire | 0.0 /100 | #292 | Tragic 16.4% |
| Immigrants | Latin America | 0.0 /100 | #293 | Tragic 16.4% |
| Immigrants | Cabo Verde | 0.0 /100 | #294 | Tragic 16.4% |
| Senegalese | 0.0 /100 | #295 | Tragic 16.5% |
| Immigrants | Senegal | 0.0 /100 | #296 | Tragic 16.5% |
| Mexicans | 0.0 /100 | #297 | Tragic 16.5% |
| Somalis | 0.0 /100 | #298 | Tragic 16.6% |
| Hispanics or Latinos | 0.0 /100 | #299 | Tragic 16.6% |
| Bahamians | 0.0 /100 | #300 | Tragic 16.6% |
| Guatemalans | 0.0 /100 | #301 | Tragic 16.7% |
| Chippewa | 0.0 /100 | #302 | Tragic 16.7% |
| Choctaw | 0.0 /100 | #303 | Tragic 16.8% |
| Immigrants | Central America | 0.0 /100 | #304 | Tragic 16.8% |
| Immigrants | Grenada | 0.0 /100 | #305 | Tragic 16.8% |
| Immigrants | Caribbean | 0.0 /100 | #306 | Tragic 16.9% |