Zip Codes with the Highest Percentage of Population with a Degree in Science and Engineering in Ohio
RELATED REPORTS & OPTIONS
Science and Engineering
Ohio
Compare Zip Codes
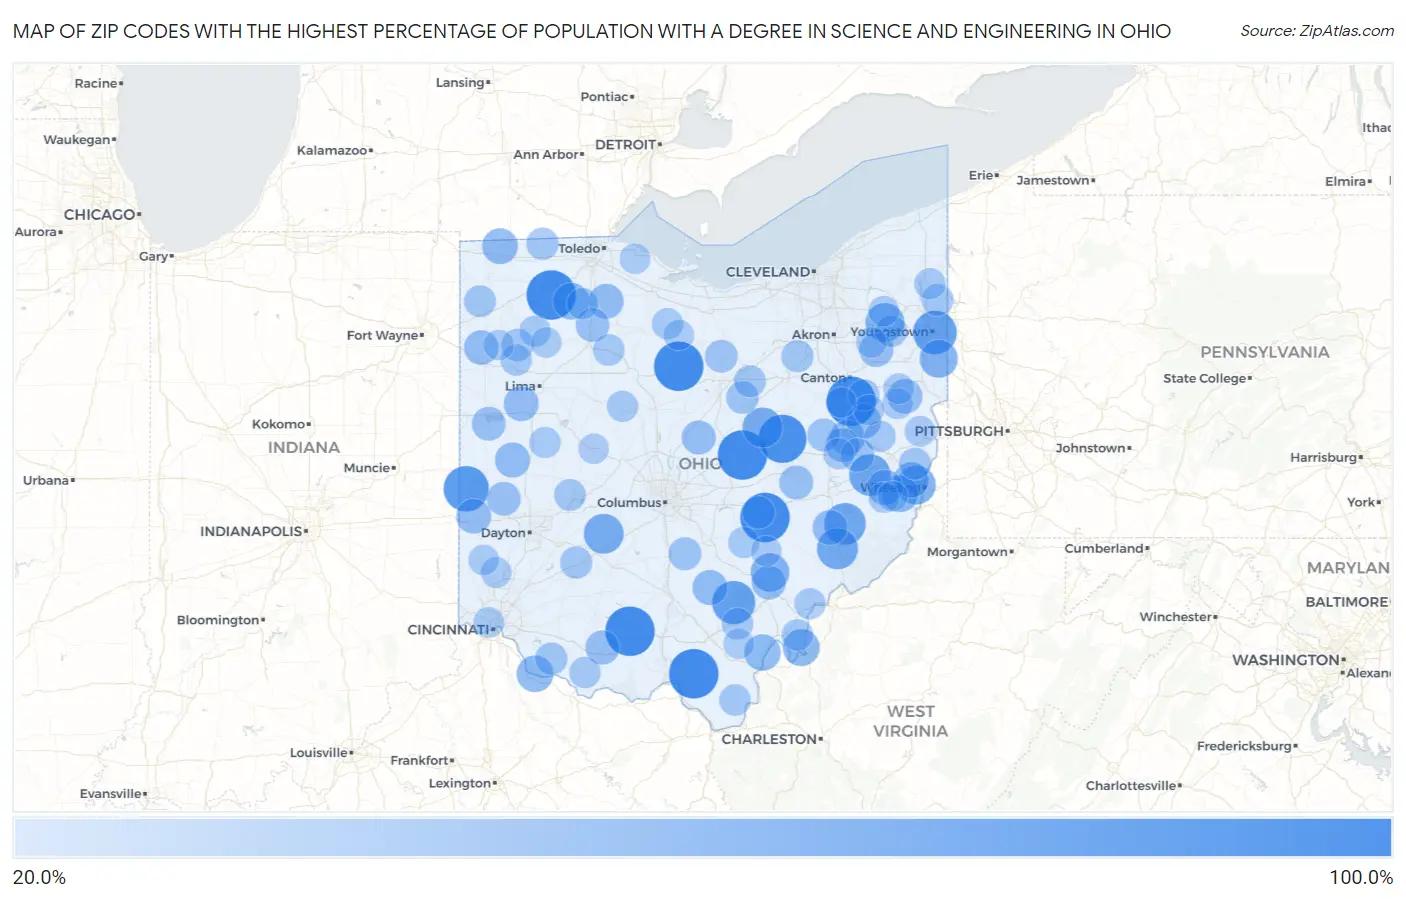
Map of Zip Codes with the Highest Percentage of Population with a Degree in Science and Engineering in Ohio
20.0%
100.0%
Zip Codes with the Highest Percentage of Population with a Degree in Science and Engineering in Ohio
| Zip Code | % Graduates | vs State | vs National | |
| 1. | 45646 | 100.0% | 11.8%(+88.2)#1 | 9.8%(+90.2)#6 |
| 2. | 43735 | 100.0% | 11.8%(+88.2)#2 | 9.8%(+90.2)#25 |
| 3. | 44881 | 100.0% | 11.8%(+88.2)#3 | 9.8%(+90.2)#56 |
| 4. | 43037 | 100.0% | 11.8%(+88.2)#4 | 9.8%(+90.2)#67 |
| 5. | 43523 | 100.0% | 11.8%(+88.2)#5 | 9.8%(+90.2)#91 |
| 6. | 45677 | 100.0% | 11.8%(+88.2)#6 | 9.8%(+90.2)#96 |
| 7. | 44671 | 100.0% | 11.8%(+88.2)#7 | 9.8%(+90.2)#103 |
| 8. | 43805 | 94.0% | 11.8%(+82.2)#8 | 9.8%(+84.2)#109 |
| 9. | 45352 | 83.3% | 11.8%(+71.5)#9 | 9.8%(+73.6)#123 |
| 10. | 44506 | 76.9% | 11.8%(+65.1)#10 | 9.8%(+67.1)#145 |
| 11. | 45698 | 75.0% | 11.8%(+63.2)#11 | 9.8%(+65.2)#152 |
| 12. | 43779 | 69.0% | 11.8%(+57.2)#12 | 9.8%(+59.3)#184 |
| 13. | 43983 | 68.3% | 11.8%(+56.5)#13 | 9.8%(+58.6)#193 |
| 14. | 45727 | 66.7% | 11.8%(+54.9)#14 | 9.8%(+56.9)#200 |
| 15. | 43006 | 62.7% | 11.8%(+50.9)#15 | 9.8%(+53.0)#233 |
| 16. | 43153 | 62.4% | 11.8%(+50.5)#16 | 9.8%(+52.6)#238 |
| 17. | 44285 | 58.8% | 11.8%(+47.0)#17 | 9.8%(+49.0)#273 |
| 18. | 43934 | 58.8% | 11.8%(+47.0)#18 | 9.8%(+49.0)#274 |
| 19. | 45782 | 57.1% | 11.8%(+45.3)#19 | 9.8%(+47.4)#291 |
| 20. | 44443 | 54.8% | 11.8%(+43.0)#20 | 9.8%(+45.1)#326 |
| 21. | 45770 | 50.7% | 11.8%(+38.9)#21 | 9.8%(+40.9)#371 |
| 22. | 43967 | 50.0% | 11.8%(+38.2)#22 | 9.8%(+40.2)#398 |
| 23. | 43541 | 50.0% | 11.8%(+38.2)#23 | 9.8%(+40.2)#403 |
| 24. | 45112 | 50.0% | 11.8%(+38.2)#24 | 9.8%(+40.2)#426 |
| 25. | 45620 | 48.7% | 11.8%(+36.9)#25 | 9.8%(+38.9)#440 |
| 26. | 43501 | 46.2% | 11.8%(+34.3)#26 | 9.8%(+36.4)#488 |
| 27. | 43905 | 45.2% | 11.8%(+33.4)#27 | 9.8%(+35.4)#516 |
| 28. | 43759 | 45.2% | 11.8%(+33.3)#28 | 9.8%(+35.4)#520 |
| 29. | 43152 | 43.7% | 11.8%(+31.9)#29 | 9.8%(+33.9)#553 |
| 30. | 45333 | 43.6% | 11.8%(+31.8)#30 | 9.8%(+33.8)#554 |
| 31. | 44682 | 43.5% | 11.8%(+31.7)#31 | 9.8%(+33.7)#558 |
| 32. | 43466 | 43.1% | 11.8%(+31.3)#32 | 9.8%(+33.3)#567 |
| 33. | 45819 | 42.9% | 11.8%(+31.0)#33 | 9.8%(+33.1)#574 |
| 34. | 43717 | 42.9% | 11.8%(+31.0)#34 | 9.8%(+33.1)#578 |
| 35. | 43962 | 42.9% | 11.8%(+31.0)#35 | 9.8%(+33.1)#582 |
| 36. | 45321 | 42.8% | 11.8%(+30.9)#36 | 9.8%(+33.0)#584 |
| 37. | 44675 | 42.0% | 11.8%(+30.2)#37 | 9.8%(+32.2)#605 |
| 38. | 45886 | 41.7% | 11.8%(+29.9)#38 | 9.8%(+31.9)#613 |
| 39. | 45761 | 40.3% | 11.8%(+28.5)#39 | 9.8%(+30.5)#663 |
| 40. | 45679 | 40.1% | 11.8%(+28.2)#40 | 9.8%(+30.3)#668 |
| 41. | 43350 | 40.0% | 11.8%(+28.2)#41 | 9.8%(+30.2)#681 |
| 42. | 44640 | 40.0% | 11.8%(+28.2)#42 | 9.8%(+30.2)#682 |
| 43. | 43802 | 39.7% | 11.8%(+27.9)#43 | 9.8%(+29.9)#691 |
| 44. | 45337 | 39.1% | 11.8%(+27.3)#44 | 9.8%(+29.3)#713 |
| 45. | 45866 | 38.9% | 11.8%(+27.1)#45 | 9.8%(+29.1)#718 |
| 46. | 44629 | 38.7% | 11.8%(+26.8)#46 | 9.8%(+28.9)#726 |
| 47. | 45889 | 38.5% | 11.8%(+26.6)#47 | 9.8%(+28.7)#732 |
| 48. | 44699 | 38.2% | 11.8%(+26.3)#48 | 9.8%(+28.4)#743 |
| 49. | 43840 | 35.7% | 11.8%(+23.9)#49 | 9.8%(+25.9)#886 |
| 50. | 43154 | 35.6% | 11.8%(+23.8)#50 | 9.8%(+25.8)#903 |
| 51. | 44878 | 34.7% | 11.8%(+22.9)#51 | 9.8%(+24.9)#952 |
| 52. | 44864 | 34.3% | 11.8%(+22.5)#52 | 9.8%(+24.5)#976 |
| 53. | 45827 | 33.7% | 11.8%(+21.9)#53 | 9.8%(+23.9)#1,014 |
| 54. | 43760 | 33.7% | 11.8%(+21.9)#54 | 9.8%(+23.9)#1,016 |
| 55. | 45130 | 33.6% | 11.8%(+21.8)#55 | 9.8%(+23.8)#1,020 |
| 56. | 45164 | 33.3% | 11.8%(+21.5)#56 | 9.8%(+23.6)#1,044 |
| 57. | 43533 | 33.1% | 11.8%(+21.3)#57 | 9.8%(+23.3)#1,075 |
| 58. | 44276 | 32.6% | 11.8%(+20.8)#58 | 9.8%(+22.9)#1,095 |
| 59. | 43917 | 32.1% | 11.8%(+20.3)#59 | 9.8%(+22.3)#1,130 |
| 60. | 44418 | 32.1% | 11.8%(+20.3)#60 | 9.8%(+22.3)#1,131 |
| 61. | 44838 | 31.8% | 11.8%(+20.0)#61 | 9.8%(+22.0)#1,152 |
| 62. | 43536 | 31.6% | 11.8%(+19.8)#62 | 9.8%(+21.8)#1,167 |
| 63. | 44412 | 31.3% | 11.8%(+19.5)#63 | 9.8%(+21.5)#1,193 |
| 64. | 45372 | 31.2% | 11.8%(+19.4)#64 | 9.8%(+21.5)#1,206 |
| 65. | 45890 | 30.8% | 11.8%(+19.0)#65 | 9.8%(+21.1)#1,235 |
| 66. | 45695 | 30.5% | 11.8%(+18.7)#66 | 9.8%(+20.7)#1,266 |
| 67. | 45678 | 30.5% | 11.8%(+18.7)#67 | 9.8%(+20.7)#1,268 |
| 68. | 44688 | 30.2% | 11.8%(+18.4)#68 | 9.8%(+20.4)#1,296 |
| 69. | 45743 | 30.1% | 11.8%(+18.3)#69 | 9.8%(+20.3)#1,299 |
| 70. | 45844 | 30.0% | 11.8%(+18.2)#70 | 9.8%(+20.2)#1,309 |
| 71. | 43988 | 29.9% | 11.8%(+18.1)#71 | 9.8%(+20.1)#1,330 |
| 72. | 45115 | 29.9% | 11.8%(+18.1)#72 | 9.8%(+20.1)#1,331 |
| 73. | 43462 | 29.9% | 11.8%(+18.0)#73 | 9.8%(+20.1)#1,333 |
| 74. | 45864 | 29.6% | 11.8%(+17.8)#74 | 9.8%(+19.8)#1,351 |
| 75. | 44867 | 29.4% | 11.8%(+17.6)#75 | 9.8%(+19.6)#1,371 |
| 76. | 43332 | 29.3% | 11.8%(+17.5)#76 | 9.8%(+19.5)#1,379 |
| 77. | 44417 | 29.2% | 11.8%(+17.4)#77 | 9.8%(+19.4)#1,392 |
| 78. | 45340 | 29.2% | 11.8%(+17.4)#78 | 9.8%(+19.4)#1,396 |
| 79. | 45742 | 29.0% | 11.8%(+17.1)#79 | 9.8%(+19.2)#1,415 |
| 80. | 43837 | 28.8% | 11.8%(+17.0)#80 | 9.8%(+19.0)#1,433 |
| 81. | 43748 | 28.6% | 11.8%(+16.8)#81 | 9.8%(+18.9)#1,448 |
| 82. | 44651 | 27.8% | 11.8%(+16.0)#82 | 9.8%(+18.0)#1,549 |
| 83. | 43730 | 27.5% | 11.8%(+15.7)#83 | 9.8%(+17.7)#1,597 |
| 84. | 44427 | 27.5% | 11.8%(+15.7)#84 | 9.8%(+17.7)#1,598 |
| 85. | 45225 | 27.5% | 11.8%(+15.6)#85 | 9.8%(+17.7)#1,599 |
| 86. | 43944 | 27.4% | 11.8%(+15.6)#86 | 9.8%(+17.6)#1,608 |
| 87. | 45067 | 27.3% | 11.8%(+15.5)#87 | 9.8%(+17.6)#1,618 |
| 88. | 44288 | 27.2% | 11.8%(+15.3)#88 | 9.8%(+17.4)#1,646 |
| 89. | 44620 | 27.1% | 11.8%(+15.3)#89 | 9.8%(+17.3)#1,650 |
| 90. | 45064 | 27.1% | 11.8%(+15.3)#90 | 9.8%(+17.3)#1,656 |
| 91. | 44201 | 27.0% | 11.8%(+15.2)#91 | 9.8%(+17.2)#1,666 |
| 92. | 44612 | 26.8% | 11.8%(+15.0)#92 | 9.8%(+17.1)#1,676 |
| 93. | 43719 | 26.8% | 11.8%(+15.0)#93 | 9.8%(+17.0)#1,678 |
| 94. | 43445 | 26.7% | 11.8%(+14.9)#94 | 9.8%(+16.9)#1,693 |
| 95. | 45875 | 26.6% | 11.8%(+14.8)#95 | 9.8%(+16.8)#1,703 |
| 96. | 45686 | 26.6% | 11.8%(+14.8)#96 | 9.8%(+16.8)#1,709 |
| 97. | 45849 | 26.2% | 11.8%(+14.4)#97 | 9.8%(+16.4)#1,758 |
| 98. | 43718 | 26.2% | 11.8%(+14.4)#98 | 9.8%(+16.4)#1,762 |
| 99. | 44807 | 26.2% | 11.8%(+14.4)#99 | 9.8%(+16.4)#1,767 |
| 100. | 43360 | 25.9% | 11.8%(+14.1)#100 | 9.8%(+16.1)#1,798 |
Common Questions
What are the Top 10 Zip Codes with the Highest Percentage of Population with a Degree in Science and Engineering in Ohio?
Top 10 Zip Codes with the Highest Percentage of Population with a Degree in Science and Engineering in Ohio are:
What zip code has the Highest Percentage of Population with a Degree in Science and Engineering in Ohio?
45646 has the Highest Percentage of Population with a Degree in Science and Engineering in Ohio with 100.0%.
What is the Percentage of Population with a Degree in Science and Engineering in the State of Ohio?
Percentage of Population with a Degree in Science and Engineering in Ohio is 11.8%.
What is the Percentage of Population with a Degree in Science and Engineering in the United States?
Percentage of Population with a Degree in Science and Engineering in the United States is 9.8%.