Zip Codes with the Highest Percentage of Population with a Degree in Science and Engineering in Indiana
RELATED REPORTS & OPTIONS
Science and Engineering
Indiana
Compare Zip Codes
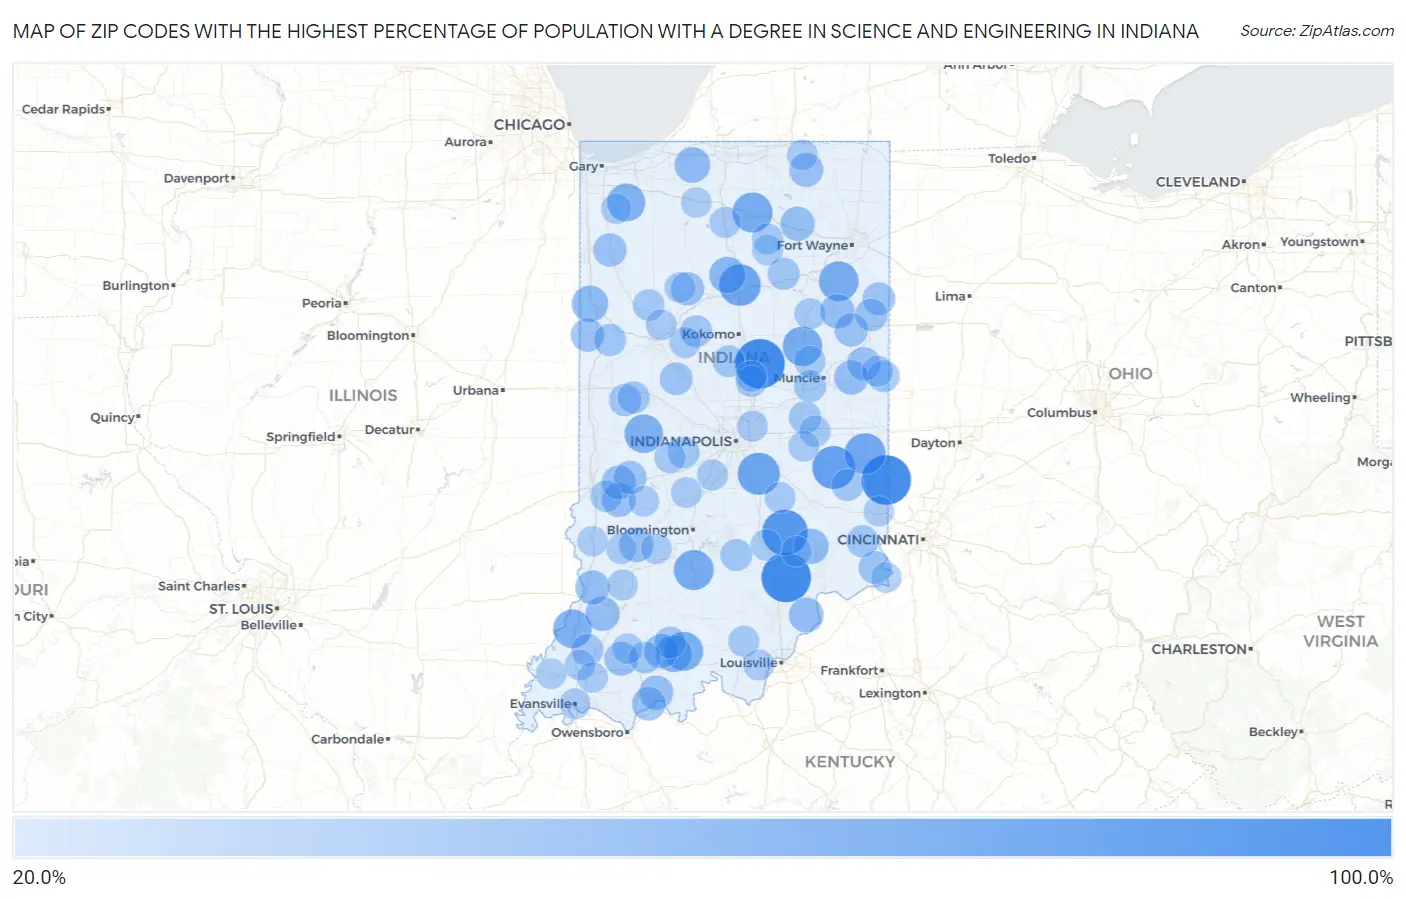
Map of Zip Codes with the Highest Percentage of Population with a Degree in Science and Engineering in Indiana
20.0%
100.0%
Zip Codes with the Highest Percentage of Population with a Degree in Science and Engineering in Indiana
| Zip Code | % Graduates | vs State | vs National | |
| 1. | 47270 | 100.0% | 12.7%(+87.3)#1 | 9.8%(+90.2)#22 |
| 2. | 47010 | 100.0% | 12.7%(+87.3)#2 | 9.8%(+90.2)#37 |
| 3. | 46047 | 100.0% | 12.7%(+87.3)#3 | 9.8%(+90.2)#100 |
| 4. | 47236 | 83.9% | 12.7%(+71.3)#4 | 9.8%(+74.1)#121 |
| 5. | 46133 | 72.9% | 12.7%(+60.2)#5 | 9.8%(+63.1)#161 |
| 6. | 46162 | 69.4% | 12.7%(+56.7)#6 | 9.8%(+59.6)#183 |
| 7. | 46958 | 67.7% | 12.7%(+55.0)#7 | 9.8%(+57.9)#198 |
| 8. | 47325 | 65.0% | 12.7%(+52.3)#8 | 9.8%(+55.2)#222 |
| 9. | 46524 | 60.5% | 12.7%(+47.9)#9 | 9.8%(+50.7)#250 |
| 10. | 47451 | 60.3% | 12.7%(+47.6)#10 | 9.8%(+50.5)#252 |
| 11. | 46791 | 59.5% | 12.7%(+46.9)#11 | 9.8%(+49.8)#265 |
| 12. | 46930 | 58.8% | 12.7%(+46.2)#12 | 9.8%(+49.0)#272 |
| 13. | 47116 | 56.2% | 12.7%(+43.6)#13 | 9.8%(+46.5)#304 |
| 14. | 46175 | 55.0% | 12.7%(+42.3)#14 | 9.8%(+45.2)#322 |
| 15. | 47524 | 55.0% | 12.7%(+42.3)#15 | 9.8%(+45.2)#324 |
| 16. | 46302 | 52.6% | 12.7%(+40.0)#16 | 9.8%(+42.9)#354 |
| 17. | 47513 | 46.9% | 12.7%(+34.3)#17 | 9.8%(+37.2)#467 |
| 18. | 46988 | 46.4% | 12.7%(+33.7)#18 | 9.8%(+36.6)#483 |
| 19. | 47942 | 46.2% | 12.7%(+33.5)#19 | 9.8%(+36.4)#489 |
| 20. | 46365 | 43.0% | 12.7%(+30.4)#20 | 9.8%(+33.3)#568 |
| 21. | 47223 | 40.7% | 12.7%(+28.0)#21 | 9.8%(+30.9)#642 |
| 22. | 47147 | 39.7% | 12.7%(+27.0)#22 | 9.8%(+29.9)#693 |
| 23. | 47557 | 38.2% | 12.7%(+25.5)#23 | 9.8%(+28.4)#741 |
| 24. | 46781 | 38.2% | 12.7%(+25.5)#24 | 9.8%(+28.4)#742 |
| 25. | 46764 | 37.9% | 12.7%(+25.3)#25 | 9.8%(+28.1)#755 |
| 26. | 47340 | 37.8% | 12.7%(+25.2)#26 | 9.8%(+28.0)#763 |
| 27. | 47465 | 37.8% | 12.7%(+25.1)#27 | 9.8%(+28.0)#764 |
| 28. | 47575 | 37.7% | 12.7%(+25.0)#28 | 9.8%(+27.9)#767 |
| 29. | 47516 | 37.1% | 12.7%(+24.5)#29 | 9.8%(+27.3)#806 |
| 30. | 47531 | 36.8% | 12.7%(+24.2)#30 | 9.8%(+27.1)#818 |
| 31. | 47846 | 36.4% | 12.7%(+23.7)#31 | 9.8%(+26.6)#846 |
| 32. | 47881 | 36.4% | 12.7%(+23.7)#32 | 9.8%(+26.6)#851 |
| 33. | 46571 | 36.3% | 12.7%(+23.6)#33 | 9.8%(+26.5)#858 |
| 34. | 47585 | 35.7% | 12.7%(+23.0)#34 | 9.8%(+25.9)#889 |
| 35. | 47380 | 34.9% | 12.7%(+22.2)#35 | 9.8%(+25.1)#939 |
| 36. | 47615 | 34.9% | 12.7%(+22.2)#36 | 9.8%(+25.1)#942 |
| 37. | 47369 | 34.7% | 12.7%(+22.0)#37 | 9.8%(+24.9)#954 |
| 38. | 47926 | 34.4% | 12.7%(+21.7)#38 | 9.8%(+24.6)#972 |
| 39. | 47943 | 34.0% | 12.7%(+21.3)#39 | 9.8%(+24.2)#1,003 |
| 40. | 47917 | 33.8% | 12.7%(+21.2)#40 | 9.8%(+24.1)#1,005 |
| 41. | 47857 | 33.3% | 12.7%(+20.7)#41 | 9.8%(+23.6)#1,037 |
| 42. | 46035 | 32.0% | 12.7%(+19.3)#42 | 9.8%(+22.2)#1,140 |
| 43. | 47040 | 31.0% | 12.7%(+18.3)#43 | 9.8%(+21.2)#1,226 |
| 44. | 46772 | 31.0% | 12.7%(+18.3)#44 | 9.8%(+21.2)#1,228 |
| 45. | 46740 | 30.9% | 12.7%(+18.2)#45 | 9.8%(+21.1)#1,233 |
| 46. | 47384 | 30.3% | 12.7%(+17.6)#46 | 9.8%(+20.5)#1,291 |
| 47. | 47975 | 29.5% | 12.7%(+16.9)#47 | 9.8%(+19.7)#1,355 |
| 48. | 47949 | 29.4% | 12.7%(+16.7)#48 | 9.8%(+19.6)#1,372 |
| 49. | 47990 | 29.2% | 12.7%(+16.6)#49 | 9.8%(+19.4)#1,386 |
| 50. | 47024 | 28.8% | 12.7%(+16.2)#50 | 9.8%(+19.1)#1,431 |
| 51. | 46913 | 28.6% | 12.7%(+15.9)#51 | 9.8%(+18.8)#1,455 |
| 52. | 47235 | 28.5% | 12.7%(+15.8)#52 | 9.8%(+18.7)#1,480 |
| 53. | 46990 | 28.4% | 12.7%(+15.7)#53 | 9.8%(+18.6)#1,491 |
| 54. | 47032 | 28.3% | 12.7%(+15.7)#54 | 9.8%(+18.6)#1,493 |
| 55. | 46049 | 28.3% | 12.7%(+15.6)#55 | 9.8%(+18.5)#1,498 |
| 56. | 47521 | 28.1% | 12.7%(+15.4)#56 | 9.8%(+18.3)#1,521 |
| 57. | 47542 | 28.0% | 12.7%(+15.4)#57 | 9.8%(+18.2)#1,526 |
| 58. | 47334 | 28.0% | 12.7%(+15.4)#58 | 9.8%(+18.2)#1,527 |
| 59. | 47649 | 28.0% | 12.7%(+15.3)#59 | 9.8%(+18.2)#1,536 |
| 60. | 47390 | 27.9% | 12.7%(+15.2)#60 | 9.8%(+18.1)#1,542 |
| 61. | 46103 | 27.5% | 12.7%(+14.8)#61 | 9.8%(+17.7)#1,594 |
| 62. | 47871 | 27.3% | 12.7%(+14.6)#62 | 9.8%(+17.5)#1,626 |
| 63. | 47929 | 27.0% | 12.7%(+14.3)#63 | 9.8%(+17.2)#1,662 |
| 64. | 46128 | 25.5% | 12.7%(+12.8)#64 | 9.8%(+15.7)#1,859 |
| 65. | 46030 | 25.4% | 12.7%(+12.8)#65 | 9.8%(+15.7)#1,872 |
| 66. | 47385 | 25.4% | 12.7%(+12.7)#66 | 9.8%(+15.6)#1,880 |
| 67. | 46031 | 25.2% | 12.7%(+12.5)#67 | 9.8%(+15.4)#1,919 |
| 68. | 47342 | 25.0% | 12.7%(+12.3)#68 | 9.8%(+15.2)#1,933 |
| 69. | 47247 | 25.0% | 12.7%(+12.3)#69 | 9.8%(+15.2)#1,987 |
| 70. | 47382 | 25.0% | 12.7%(+12.3)#70 | 9.8%(+15.2)#1,991 |
| 71. | 47164 | 24.9% | 12.7%(+12.3)#71 | 9.8%(+15.2)#2,000 |
| 72. | 46065 | 24.9% | 12.7%(+12.3)#72 | 9.8%(+15.1)#2,001 |
| 73. | 46510 | 24.9% | 12.7%(+12.2)#73 | 9.8%(+15.1)#2,010 |
| 74. | 46991 | 24.6% | 12.7%(+11.9)#74 | 9.8%(+14.8)#2,048 |
| 75. | 46501 | 24.6% | 12.7%(+11.9)#75 | 9.8%(+14.8)#2,050 |
| 76. | 47234 | 24.6% | 12.7%(+11.9)#76 | 9.8%(+14.8)#2,051 |
| 77. | 46111 | 24.6% | 12.7%(+11.9)#77 | 9.8%(+14.8)#2,054 |
| 78. | 47568 | 24.1% | 12.7%(+11.4)#78 | 9.8%(+14.3)#2,137 |
| 79. | 47136 | 24.0% | 12.7%(+11.3)#79 | 9.8%(+14.2)#2,161 |
| 80. | 46982 | 23.9% | 12.7%(+11.2)#80 | 9.8%(+14.1)#2,171 |
| 81. | 47920 | 23.9% | 12.7%(+11.2)#81 | 9.8%(+14.1)#2,183 |
| 82. | 46565 | 23.7% | 12.7%(+11.0)#82 | 9.8%(+13.9)#2,221 |
| 83. | 47833 | 23.6% | 12.7%(+11.0)#83 | 9.8%(+13.9)#2,232 |
| 84. | 46216 | 23.5% | 12.7%(+10.9)#84 | 9.8%(+13.8)#2,249 |
| 85. | 47708 | 23.4% | 12.7%(+10.8)#85 | 9.8%(+13.6)#2,281 |
| 86. | 47265 | 23.4% | 12.7%(+10.7)#86 | 9.8%(+13.6)#2,294 |
| 87. | 46115 | 23.3% | 12.7%(+10.6)#87 | 9.8%(+13.5)#2,318 |
| 88. | 47648 | 23.2% | 12.7%(+10.5)#88 | 9.8%(+13.4)#2,342 |
| 89. | 47424 | 23.1% | 12.7%(+10.5)#89 | 9.8%(+13.3)#2,354 |
| 90. | 47950 | 23.1% | 12.7%(+10.4)#90 | 9.8%(+13.3)#2,365 |
| 91. | 46166 | 22.9% | 12.7%(+10.2)#91 | 9.8%(+13.1)#2,407 |
| 92. | 47590 | 22.9% | 12.7%(+10.2)#92 | 9.8%(+13.1)#2,416 |
| 93. | 47441 | 22.8% | 12.7%(+10.1)#93 | 9.8%(+13.0)#2,429 |
| 94. | 47613 | 22.8% | 12.7%(+10.1)#94 | 9.8%(+13.0)#2,439 |
| 95. | 47633 | 22.5% | 12.7%(+9.85)#95 | 9.8%(+12.7)#2,503 |
| 96. | 46531 | 22.4% | 12.7%(+9.76)#96 | 9.8%(+12.6)#2,524 |
| 97. | 47038 | 22.2% | 12.7%(+9.55)#97 | 9.8%(+12.4)#2,579 |
| 98. | 46341 | 22.1% | 12.7%(+9.40)#98 | 9.8%(+12.3)#2,627 |
| 99. | 47882 | 22.1% | 12.7%(+9.40)#99 | 9.8%(+12.3)#2,628 |
| 100. | 47060 | 22.0% | 12.7%(+9.35)#100 | 9.8%(+12.2)#2,643 |
Common Questions
What are the Top 10 Zip Codes with the Highest Percentage of Population with a Degree in Science and Engineering in Indiana?
Top 10 Zip Codes with the Highest Percentage of Population with a Degree in Science and Engineering in Indiana are:
What zip code has the Highest Percentage of Population with a Degree in Science and Engineering in Indiana?
47270 has the Highest Percentage of Population with a Degree in Science and Engineering in Indiana with 100.0%.
What is the Percentage of Population with a Degree in Science and Engineering in the State of Indiana?
Percentage of Population with a Degree in Science and Engineering in Indiana is 12.7%.
What is the Percentage of Population with a Degree in Science and Engineering in the United States?
Percentage of Population with a Degree in Science and Engineering in the United States is 9.8%.