Zip Codes with the Highest Percentage of Population with a Degree in Science and Engineering in Bethlehem, PA
RELATED REPORTS & OPTIONS
Science and Engineering
Bethlehem
Compare Zip Codes
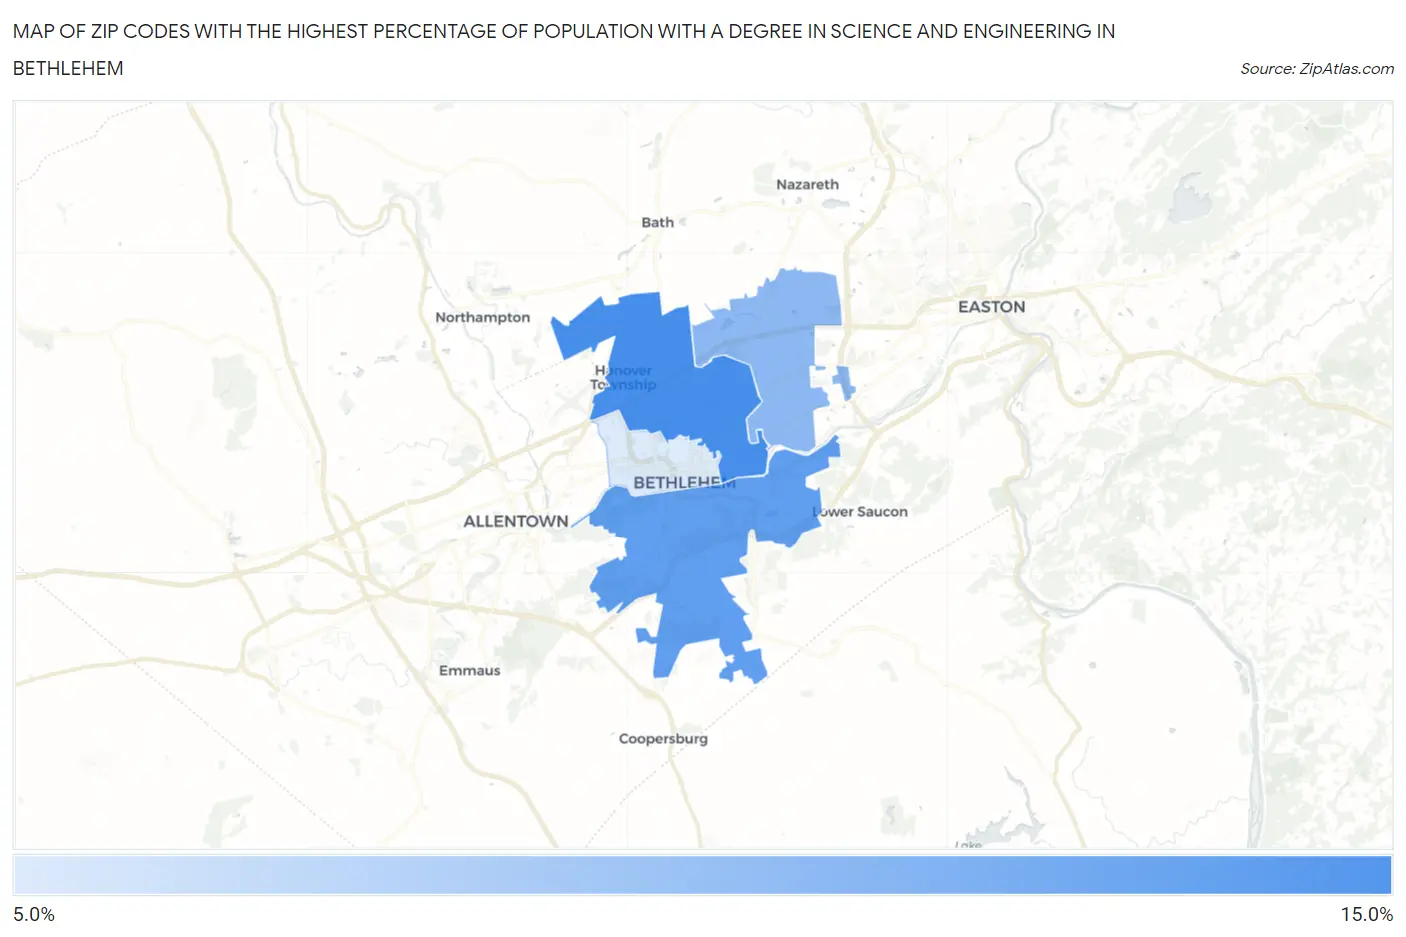
Map of Zip Codes with the Highest Percentage of Population with a Degree in Science and Engineering in Bethlehem
8.2%
10.5%
Zip Codes with the Highest Percentage of Population with a Degree in Science and Engineering in Bethlehem, PA
| Zip Code | % Graduates | vs State | vs National | |
| 1. | 18017 | 10.5% | 10.9%(-0.315)#903 | 9.8%(+0.765)#13,843 |
| 2. | 18015 | 10.2% | 10.9%(-0.693)#951 | 9.8%(+0.387)#14,673 |
| 3. | 18020 | 9.5% | 10.9%(-1.38)#1,040 | 9.8%(-0.296)#16,205 |
| 4. | 18018 | 8.2% | 10.9%(-2.62)#1,171 | 9.8%(-1.54)#19,097 |
1
Common Questions
What are the Top 3 Zip Codes with the Highest Percentage of Population with a Degree in Science and Engineering in Bethlehem, PA?
Top 3 Zip Codes with the Highest Percentage of Population with a Degree in Science and Engineering in Bethlehem, PA are:
What zip code has the Highest Percentage of Population with a Degree in Science and Engineering in Bethlehem, PA?
18017 has the Highest Percentage of Population with a Degree in Science and Engineering in Bethlehem, PA with 10.5%.
What is the Percentage of Population with a Degree in Science and Engineering in Bethlehem, PA?
Percentage of Population with a Degree in Science and Engineering in Bethlehem is 9.3%.
What is the Percentage of Population with a Degree in Science and Engineering in Pennsylvania?
Percentage of Population with a Degree in Science and Engineering in Pennsylvania is 10.9%.
What is the Percentage of Population with a Degree in Science and Engineering in the United States?
Percentage of Population with a Degree in Science and Engineering in the United States is 9.8%.