Zip Codes with the Highest Percentage of Population Employed in Agriculture, Fishing & Hunting in Scranton, PA
RELATED REPORTS & OPTIONS
Agriculture, Fishing & Hunting
Scranton
Compare Zip Codes
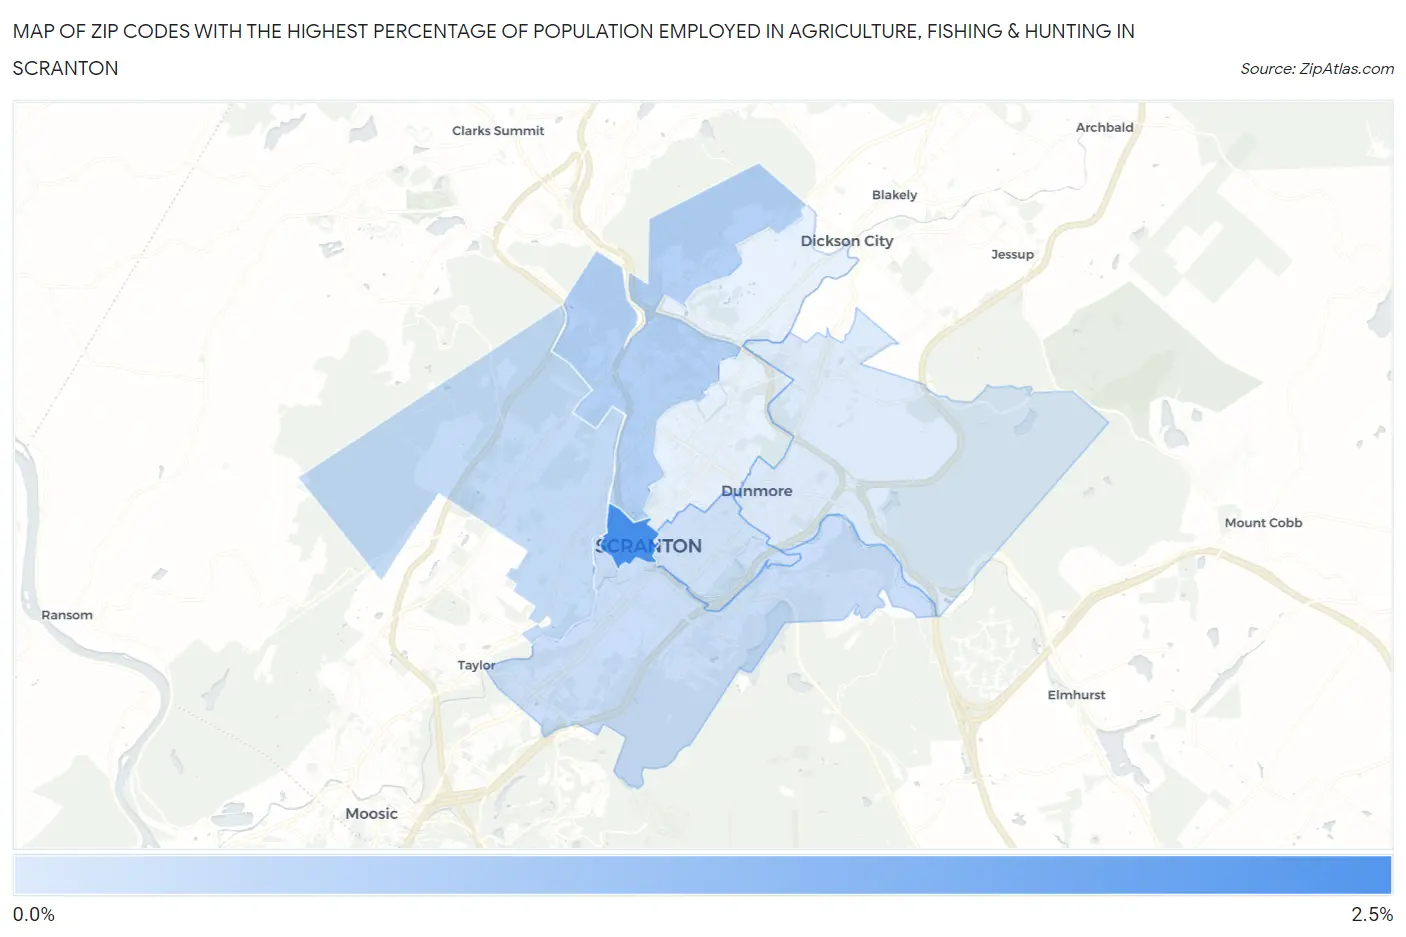
Map of Zip Codes with the Highest Percentage of Population Employed in Agriculture, Fishing & Hunting in Scranton
0.0%
2.5%
Zip Codes with the Highest Percentage of Population Employed in Agriculture, Fishing & Hunting in Scranton, PA
| Zip Code | % Employed | vs State | vs National | |
| 1. | 18503 | 2.4% | 0.87%(+1.56)#353 | 1.2%(+1.23)#11,731 |
| 2. | 18508 | 0.75% | 0.87%(-0.120)#696 | 1.2%(-0.452)#17,553 |
| 3. | 18504 | 0.50% | 0.87%(-0.368)#798 | 1.2%(-0.700)#19,293 |
| 4. | 18505 | 0.41% | 0.87%(-0.454)#843 | 1.2%(-0.787)#20,036 |
| 5. | 18510 | 0.34% | 0.87%(-0.528)#883 | 1.2%(-0.860)#20,761 |
| 6. | 18512 | 0.11% | 0.87%(-0.754)#1,027 | 1.2%(-1.09)#23,498 |
1
Common Questions
What are the Top 5 Zip Codes with the Highest Percentage of Population Employed in Agriculture, Fishing & Hunting in Scranton, PA?
Top 5 Zip Codes with the Highest Percentage of Population Employed in Agriculture, Fishing & Hunting in Scranton, PA are:
What zip code has the Highest Percentage of Population Employed in Agriculture, Fishing & Hunting in Scranton, PA?
18503 has the Highest Percentage of Population Employed in Agriculture, Fishing & Hunting in Scranton, PA with 2.4%.
What is the Percentage of Population Employed in Agriculture, Fishing & Hunting in Scranton, PA?
Percentage of Population Employed in Agriculture, Fishing & Hunting in Scranton is 0.46%.
What is the Percentage of Population Employed in Agriculture, Fishing & Hunting in Pennsylvania?
Percentage of Population Employed in Agriculture, Fishing & Hunting in Pennsylvania is 0.87%.
What is the Percentage of Population Employed in Agriculture, Fishing & Hunting in the United States?
Percentage of Population Employed in Agriculture, Fishing & Hunting in the United States is 1.2%.