Zip Codes with the Highest Percentage of Population Employed in Community & Social Service in Lebanon, PA
RELATED REPORTS & OPTIONS
Community & Social Service
Lebanon
Compare Zip Codes
Map of Zip Codes with the Highest Percentage of Population Employed in Community & Social Service in Lebanon
6.6%
10.5%
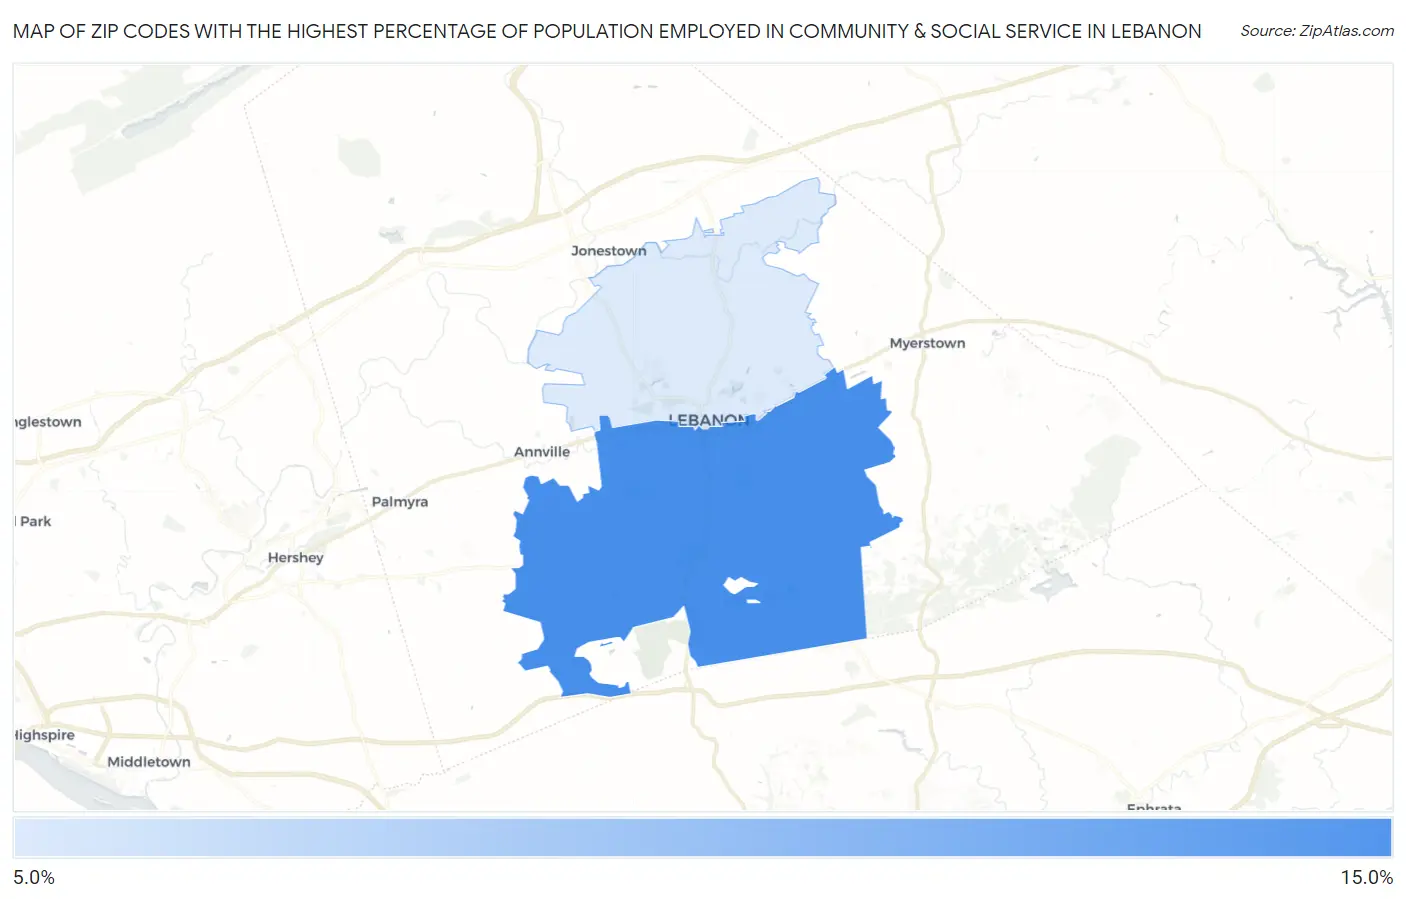
Zip Codes with the Highest Percentage of Population Employed in Community & Social Service in Lebanon, PA
| Zip Code | % Employed | vs State | vs National | |
| 1. | 17042 | 10.5% | 11.2%(-0.651)#588 | 11.2%(-0.689)#12,811 |
| 2. | 17046 | 6.6% | 11.2%(-4.59)#1,154 | 11.2%(-4.63)#23,054 |
1
Common Questions
What are the Top Zip Codes with the Highest Percentage of Population Employed in Community & Social Service in Lebanon, PA?
Top Zip Codes with the Highest Percentage of Population Employed in Community & Social Service in Lebanon, PA are:
What zip code has the Highest Percentage of Population Employed in Community & Social Service in Lebanon, PA?
17042 has the Highest Percentage of Population Employed in Community & Social Service in Lebanon, PA with 10.5%.
What is the Percentage of Population Employed in Community & Social Service in Lebanon, PA?
Percentage of Population Employed in Community & Social Service in Lebanon is 6.8%.
What is the Percentage of Population Employed in Community & Social Service in Pennsylvania?
Percentage of Population Employed in Community & Social Service in Pennsylvania is 11.2%.
What is the Percentage of Population Employed in Community & Social Service in the United States?
Percentage of Population Employed in Community & Social Service in the United States is 11.2%.