Zip Codes with the Highest Percentage of Population with a Degree in Literature and Languages in Erie, PA

RELATED REPORTS & OPTIONS

Literature and Languages
Population
Families and Households
Female Fertility
Female Fertility (Unmarried)
Race (Community Size)
Race (Percentage)
Ancestry (Community Size)
AfricanAlbanianAmericanArabArmenianAustralianAustrianBasqueBelgianBhutaneseBlackfeetBrazilianBritishBurmeseCambodianCanadianCelticCentral AmericanCentral American IndianCherokeeChickasawChoctawColombianCosta RicanCroatianCubanCzechCzechoslovakianDanishDominicanDutchEastern EuropeanEcuadorianEgyptianEnglishEthiopianEuropeanFilipinoFinnishFrenchFrench CanadianGermanGreekGuatemalanGuyaneseHaitianHonduranHungarianIcelanderIndian (Asian)IranianIraqiIrishIroquoisItalianJamaicanKenyanKoreanLebaneseLithuanianMacedonianMexicanMongolianMoroccanNavajoNigerianNorthern EuropeanNorwegianPakistaniPalestinianPennsylvania GermanPeruvianPolishPortuguesePuerto RicanRomanianRussianSamoanScandinavianScotch-IrishScottishSenegaleseSerbianSiouxSlavicSlovakSloveneSomaliSouth AfricanSouth AmericanSouth American IndianSpaniardSpanishSri LankanSubsaharan AfricanSudaneseSwedishSwissSyrianThaiTlingit-HaidaTurkishUgandanUkrainianVenezuelanVietnameseWelshWest IndianYugoslavian
Ancestry (Percentage)
AfricanAlbanianAmericanArabArmenianAustralianAustrianBasqueBelgianBhutaneseBlackfeetBrazilianBritishBurmeseCambodianCanadianCelticCentral AmericanCentral American IndianCherokeeChickasawChoctawColombianCosta RicanCroatianCubanCzechCzechoslovakianDanishDominicanDutchEastern EuropeanEcuadorianEgyptianEnglishEthiopianEuropeanFilipinoFinnishFrenchFrench CanadianGermanGreekGuatemalanGuyaneseHaitianHonduranHungarianIcelanderIndian (Asian)IranianIraqiIrishIroquoisItalianJamaicanKenyanKoreanLebaneseLithuanianMacedonianMexicanMongolianMoroccanNavajoNigerianNorthern EuropeanNorwegianPakistaniPalestinianPennsylvania GermanPeruvianPolishPortuguesePuerto RicanRomanianRussianSamoanScandinavianScotch-IrishScottishSenegaleseSerbianSiouxSlavicSlovakSloveneSomaliSouth AfricanSouth AmericanSouth American IndianSpaniardSpanishSri LankanSubsaharan AfricanSudaneseSwedishSwissSyrianThaiTlingit-HaidaTurkishUgandanUkrainianVenezuelanVietnameseWelshWest IndianYugoslavian
Immigrant Origin (Total)
Immigrant Origin (Percentage)
Income
Income (Families)
Income (Households)
Poverty
Poverty (Families)
Unemployment
Employment Occupations
Employment Industries
Employer Class
Commute Time
Commute Means
School Enrollment
Education by Degree Field
Occupancy
Finances
Physical Characteristics
Erie
Compare Zip Codes
Comparison Subject

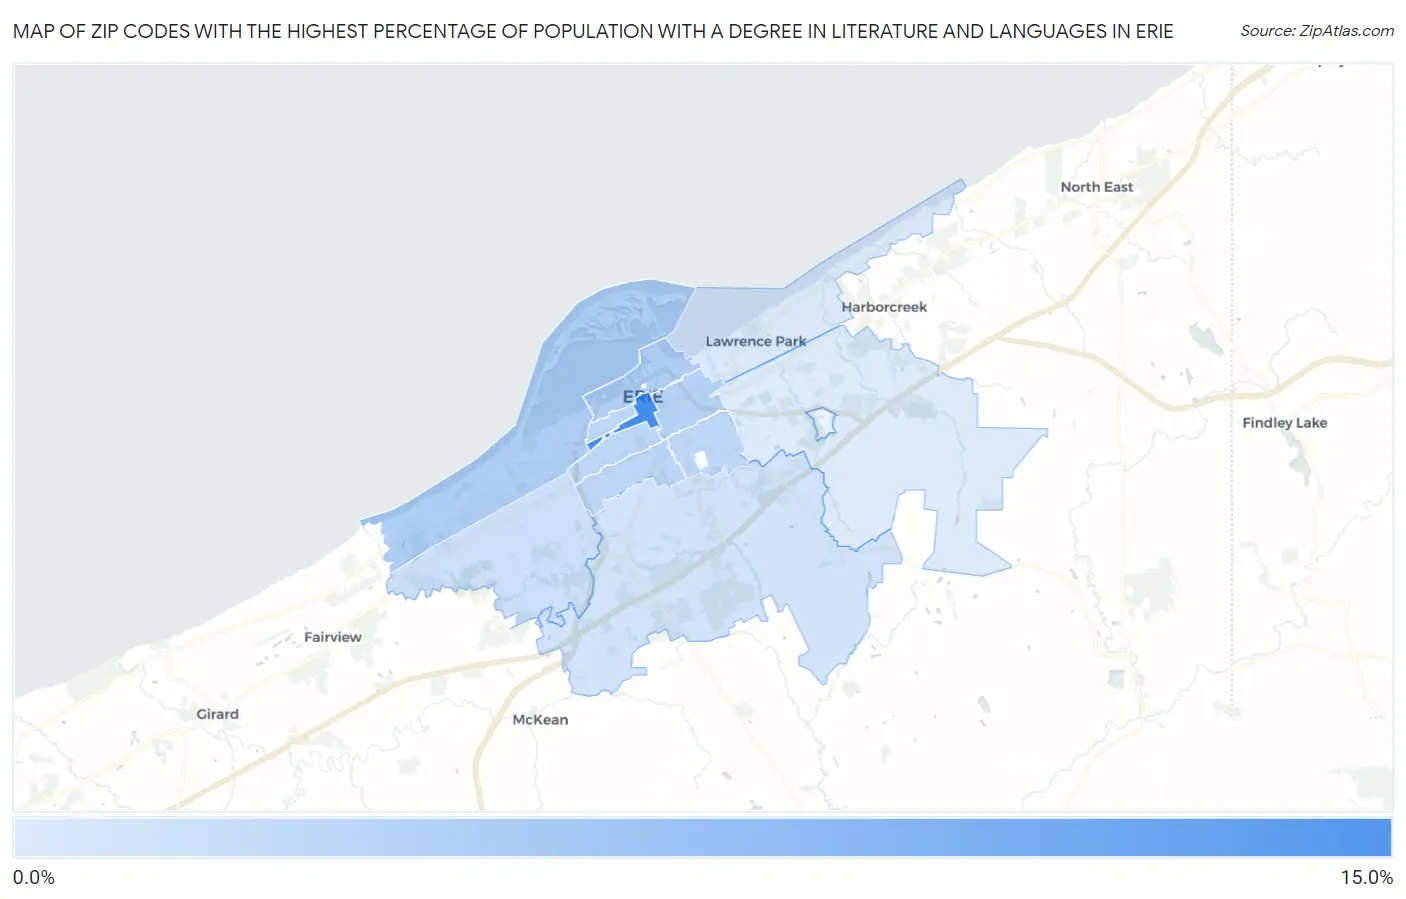
Map of Zip Codes with the Highest Percentage of Population with a Degree in Literature and Languages in Erie

0.0%
15.0%
Zip Codes with the Highest Percentage of Population with a Degree in Literature and Languages in Erie Map

Zip Codes with the Highest Percentage of Population with a Degree in Literature and Languages in Erie, PA

Zip Code % Graduates vs State vs National
1.1650114.1%4.3%(+9.80)#504.4%(+9.68)#918
2.165055.3%4.3%(+0.971)#3234.4%(+0.851)#6,824
3.165075.2%4.3%(+0.930)#3264.4%(+0.810)#6,907
4.165034.6%4.3%(+0.292)#4144.4%(+0.172)#8,485
5.165024.2%4.3%(-0.125)#4824.4%(-0.245)#9,728
6.165084.1%4.3%(-0.227)#5044.4%(-0.348)#10,017
7.165043.9%4.3%(-0.396)#5374.4%(-0.516)#10,517
8.165062.7%4.3%(-1.58)#7624.4%(-1.71)#14,592
9.165092.4%4.3%(-1.90)#8284.4%(-2.02)#15,701
10.165111.8%4.3%(-2.52)#9714.4%(-2.64)#17,808
11.165101.5%4.3%(-2.78)#1,0294.4%(-2.90)#18,643

Common Questions

What are the Top 10 Zip Codes with the Highest Percentage of Population with a Degree in Literature and Languages in Erie, PA?
Top 10 Zip Codes with the Highest Percentage of Population with a Degree in Literature and Languages in Erie, PA are:
#1
14.1%
#2
5.3%
#3
5.2%
#4
4.6%
#5
4.2%
#6
4.1%
#7
3.9%
#8
2.7%
#9
2.4%
#10
1.8%
What zip code has the Highest Percentage of Population with a Degree in Literature and Languages in Erie, PA?
16501 has the Highest Percentage of Population with a Degree in Literature and Languages in Erie, PA with 14.1%.
What is the Percentage of Population with a Degree in Literature and Languages in Erie, PA?
Percentage of Population with a Degree in Literature and Languages in Erie is 4.2%.
What is the Percentage of Population with a Degree in Literature and Languages in Pennsylvania?
Percentage of Population with a Degree in Literature and Languages in Pennsylvania is 4.3%.
What is the Percentage of Population with a Degree in Literature and Languages in the United States?
Percentage of Population with a Degree in Literature and Languages in the United States is 4.4%.