Zip Codes with the Highest Percentage of Population Employed in Accommodation & Food Services in Bethlehem, PA
RELATED REPORTS & OPTIONS
Accommodation & Food Services
Bethlehem
Compare Zip Codes
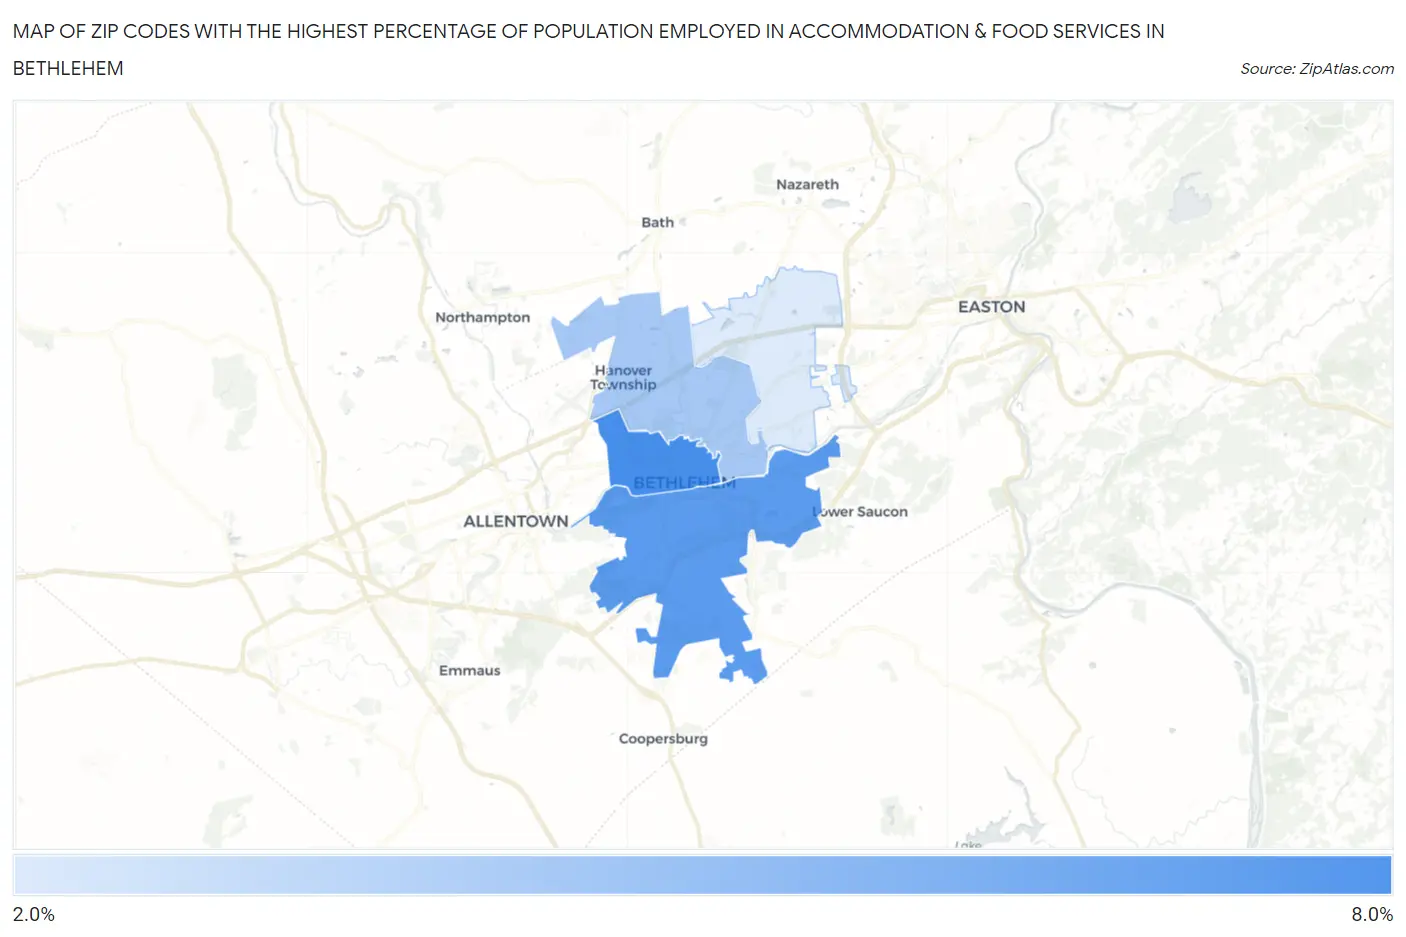
Map of Zip Codes with the Highest Percentage of Population Employed in Accommodation & Food Services in Bethlehem
2.1%
7.4%
Zip Codes with the Highest Percentage of Population Employed in Accommodation & Food Services in Bethlehem, PA
| Zip Code | % Employed | vs State | vs National | |
| 1. | 18018 | 7.4% | 5.9%(+1.54)#412 | 6.9%(+0.551)#9,163 |
| 2. | 18015 | 6.7% | 5.9%(+0.804)#517 | 6.9%(-0.188)#11,218 |
| 3. | 18017 | 4.1% | 5.9%(-1.84)#1,076 | 6.9%(-2.83)#19,971 |
| 4. | 18020 | 2.1% | 5.9%(-3.77)#1,424 | 6.9%(-4.76)#25,307 |
1
Common Questions
What are the Top 3 Zip Codes with the Highest Percentage of Population Employed in Accommodation & Food Services in Bethlehem, PA?
Top 3 Zip Codes with the Highest Percentage of Population Employed in Accommodation & Food Services in Bethlehem, PA are:
What zip code has the Highest Percentage of Population Employed in Accommodation & Food Services in Bethlehem, PA?
18018 has the Highest Percentage of Population Employed in Accommodation & Food Services in Bethlehem, PA with 7.4%.
What is the Percentage of Population Employed in Accommodation & Food Services in Bethlehem, PA?
Percentage of Population Employed in Accommodation & Food Services in Bethlehem is 6.8%.
What is the Percentage of Population Employed in Accommodation & Food Services in Pennsylvania?
Percentage of Population Employed in Accommodation & Food Services in Pennsylvania is 5.9%.
What is the Percentage of Population Employed in Accommodation & Food Services in the United States?
Percentage of Population Employed in Accommodation & Food Services in the United States is 6.9%.