Zip Codes with the Highest Percentage of Population with a Degree in Social Sciences in Bethlehem, PA
RELATED REPORTS & OPTIONS
Social Sciences
Bethlehem
Compare Zip Codes
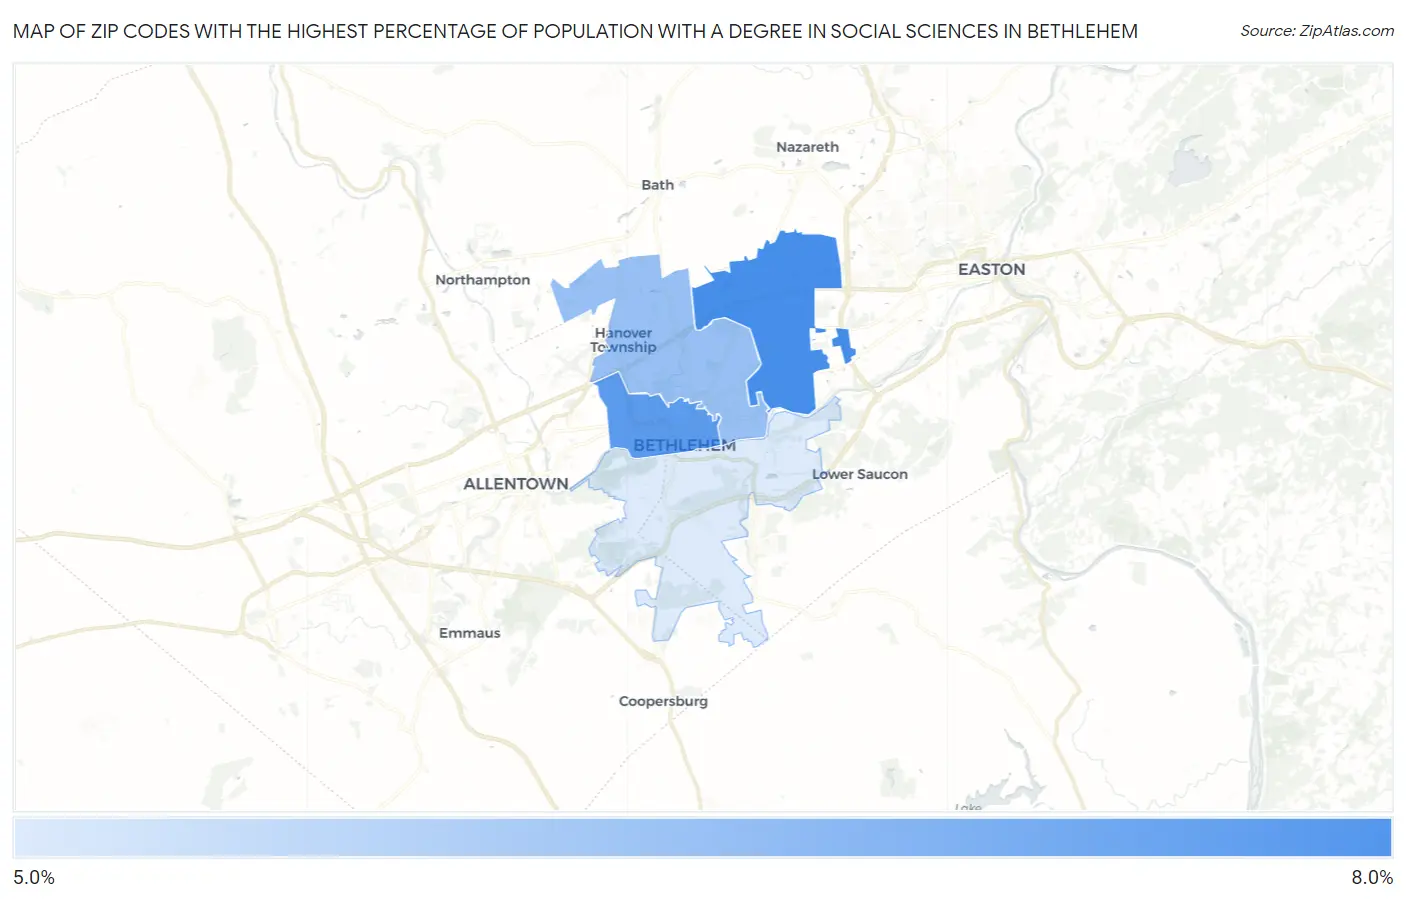
Map of Zip Codes with the Highest Percentage of Population with a Degree in Social Sciences in Bethlehem
5.0%
7.8%
Zip Codes with the Highest Percentage of Population with a Degree in Social Sciences in Bethlehem, PA
| Zip Code | % Graduates | vs State | vs National | |
| 1. | 18020 | 7.8% | 7.2%(+0.666)#427 | 8.1%(-0.239)#9,109 |
| 2. | 18018 | 7.4% | 7.2%(+0.279)#463 | 8.1%(-0.627)#9,901 |
| 3. | 18017 | 6.3% | 7.2%(-0.844)#612 | 8.1%(-1.75)#12,576 |
| 4. | 18015 | 5.0% | 7.2%(-2.12)#833 | 8.1%(-3.03)#15,718 |
1
Common Questions
What are the Top 3 Zip Codes with the Highest Percentage of Population with a Degree in Social Sciences in Bethlehem, PA?
Top 3 Zip Codes with the Highest Percentage of Population with a Degree in Social Sciences in Bethlehem, PA are:
What zip code has the Highest Percentage of Population with a Degree in Social Sciences in Bethlehem, PA?
18020 has the Highest Percentage of Population with a Degree in Social Sciences in Bethlehem, PA with 7.8%.
What is the Percentage of Population with a Degree in Social Sciences in Bethlehem, PA?
Percentage of Population with a Degree in Social Sciences in Bethlehem is 7.1%.
What is the Percentage of Population with a Degree in Social Sciences in Pennsylvania?
Percentage of Population with a Degree in Social Sciences in Pennsylvania is 7.2%.
What is the Percentage of Population with a Degree in Social Sciences in the United States?
Percentage of Population with a Degree in Social Sciences in the United States is 8.1%.