Zip Codes with the Highest Percentage of Population Employed in Security & Protection in Bethlehem, PA
RELATED REPORTS & OPTIONS
Security & Protection
Bethlehem
Compare Zip Codes
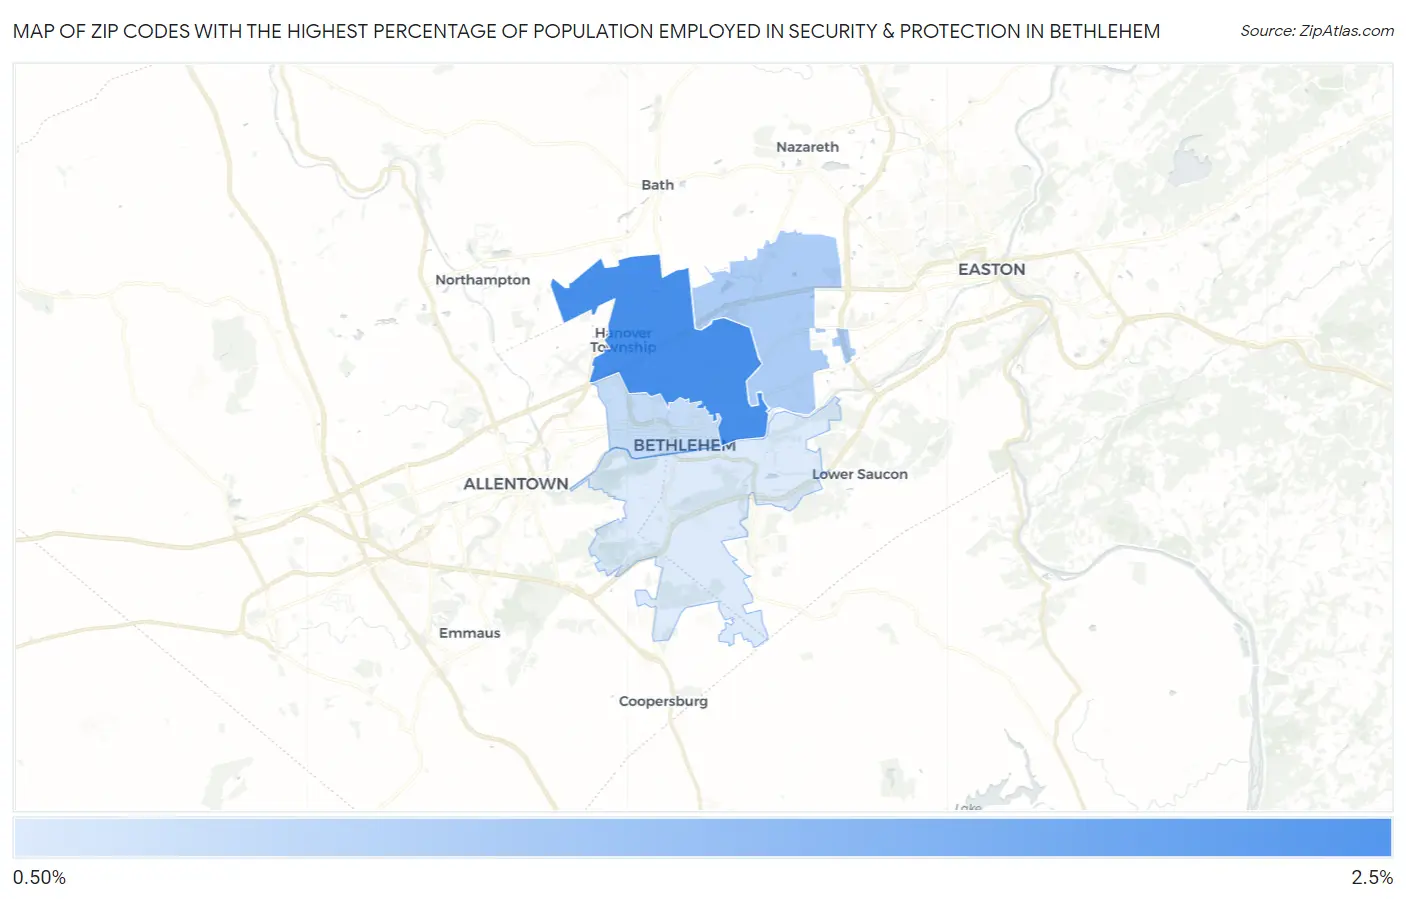
Map of Zip Codes with the Highest Percentage of Population Employed in Security & Protection in Bethlehem
1.2%
2.1%
Zip Codes with the Highest Percentage of Population Employed in Security & Protection in Bethlehem, PA
| Zip Code | % Employed | vs State | vs National | |
| 1. | 18017 | 2.1% | 2.0%(+0.057)#596 | 2.1%(-0.072)#12,074 |
| 2. | 18020 | 1.5% | 2.0%(-0.548)#852 | 2.1%(-0.677)#16,405 |
| 3. | 18018 | 1.3% | 2.0%(-0.697)#902 | 2.1%(-0.825)#17,554 |
| 4. | 18015 | 1.2% | 2.0%(-0.835)#964 | 2.1%(-0.964)#18,626 |
1
Common Questions
What are the Top 3 Zip Codes with the Highest Percentage of Population Employed in Security & Protection in Bethlehem, PA?
Top 3 Zip Codes with the Highest Percentage of Population Employed in Security & Protection in Bethlehem, PA are:
What zip code has the Highest Percentage of Population Employed in Security & Protection in Bethlehem, PA?
18017 has the Highest Percentage of Population Employed in Security & Protection in Bethlehem, PA with 2.1%.
What is the Percentage of Population Employed in Security & Protection in Bethlehem, PA?
Percentage of Population Employed in Security & Protection in Bethlehem is 1.2%.
What is the Percentage of Population Employed in Security & Protection in Pennsylvania?
Percentage of Population Employed in Security & Protection in Pennsylvania is 2.0%.
What is the Percentage of Population Employed in Security & Protection in the United States?
Percentage of Population Employed in Security & Protection in the United States is 2.1%.