Eagle Point, OR Map & Demographics
Eagle Point Map
Eagle Point Overview
$31,783
PER CAPITA INCOME
$70,332
AVG FAMILY INCOME
$83,625
AVG HOUSEHOLD INCOME
18.9%
WAGE / INCOME GAP [ % ]
81.1¢/ $1
WAGE / INCOME GAP [ $ ]
0.31
INEQUALITY / GINI INDEX
9,735
TOTAL POPULATION
4,752
MALE POPULATION
4,983
FEMALE POPULATION
95.36
MALES / 100 FEMALES
104.86
FEMALES / 100 MALES
36.7
MEDIAN AGE
2.9
AVG FAMILY SIZE
2.8
AVG HOUSEHOLD SIZE
4,706
LABOR FORCE [ PEOPLE ]
67.1%
PERCENT IN LABOR FORCE
12.9%
UNEMPLOYMENT RATE
Eagle Point Zip Codes
Eagle Point Area Codes
Income in Eagle Point
Income Overview in Eagle Point
Per Capita Income in Eagle Point is $31,783, while median incomes of families and households are $70,332 and $83,625 respectively.
| Characteristic | Number | Measure |
| Per Capita Income | 9,735 | $31,783 |
| Median Family Income | 2,577 | $70,332 |
| Mean Family Income | 2,577 | $85,671 |
| Median Household Income | 3,535 | $83,625 |
| Mean Household Income | 3,535 | $88,707 |
| Income Deficit | 2,577 | $0 |
| Wage / Income Gap (%) | 9,735 | 18.86% |
| Wage / Income Gap ($) | 9,735 | 81.14¢ per $1 |
| Gini / Inequality Index | 9,735 | 0.31 |
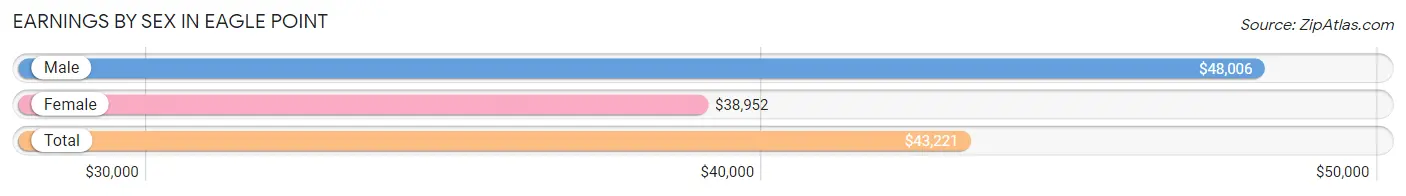
Earnings by Sex in Eagle Point
Average Earnings in Eagle Point are $43,221, $48,006 for men and $38,952 for women, a difference of 18.9%.
| Sex | Number | Average Earnings |
| Male | 2,482 (51.8%) | $48,006 |
| Female | 2,310 (48.2%) | $38,952 |
| Total | 4,792 (100.0%) | $43,221 |
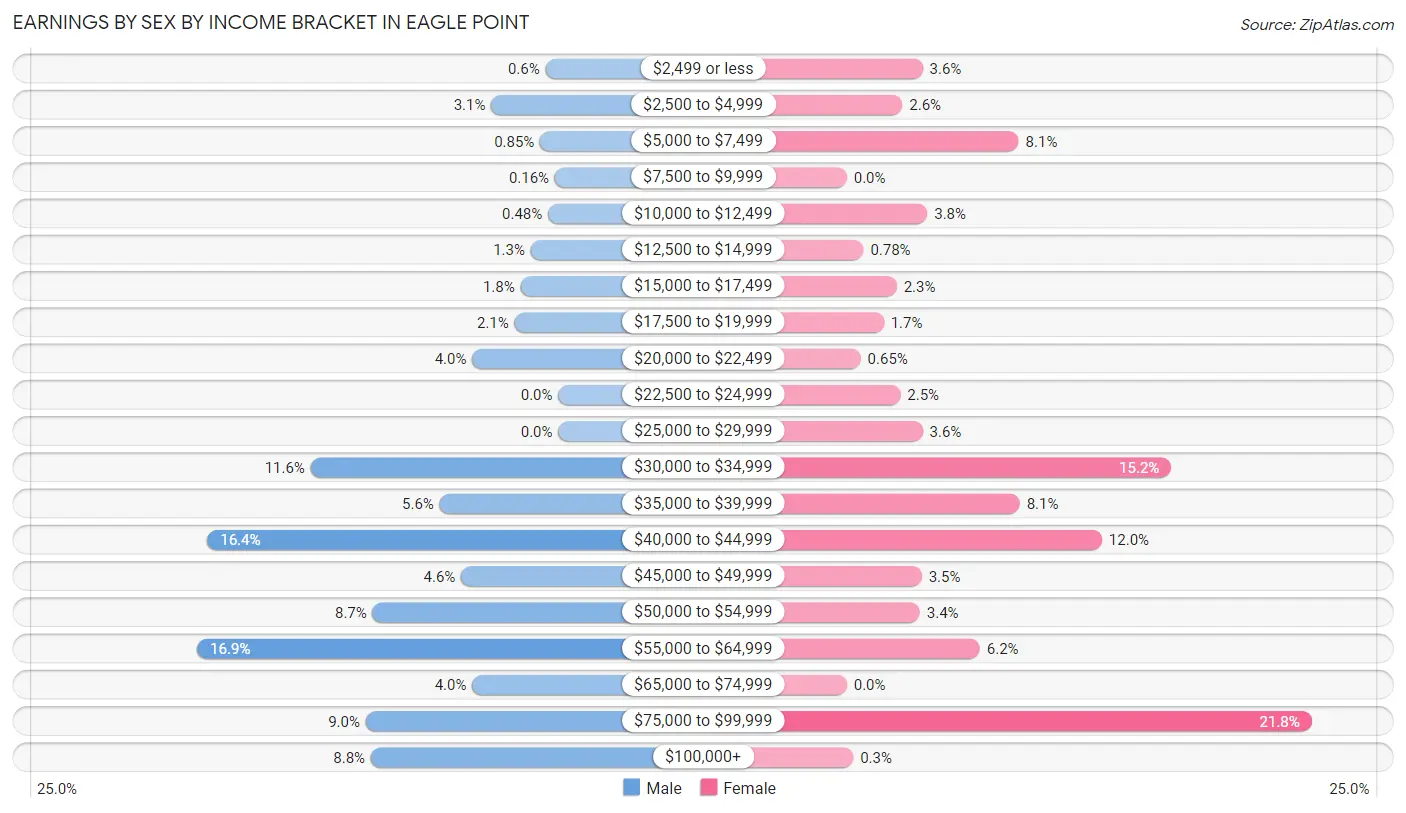
Earnings by Sex by Income Bracket in Eagle Point
The most common earnings brackets in Eagle Point are $55,000 to $64,999 for men (420 | 16.9%) and $75,000 to $99,999 for women (503 | 21.8%).
| Income | Male | Female |
| $2,499 or less | 15 (0.6%) | 82 (3.5%) |
| $2,500 to $4,999 | 78 (3.1%) | 60 (2.6%) |
| $5,000 to $7,499 | 21 (0.9%) | 186 (8.1%) |
| $7,500 to $9,999 | 4 (0.2%) | 0 (0.0%) |
| $10,000 to $12,499 | 12 (0.5%) | 87 (3.8%) |
| $12,500 to $14,999 | 32 (1.3%) | 18 (0.8%) |
| $15,000 to $17,499 | 44 (1.8%) | 54 (2.3%) |
| $17,500 to $19,999 | 51 (2.1%) | 40 (1.7%) |
| $20,000 to $22,499 | 100 (4.0%) | 15 (0.6%) |
| $22,500 to $24,999 | 0 (0.0%) | 58 (2.5%) |
| $25,000 to $29,999 | 0 (0.0%) | 82 (3.5%) |
| $30,000 to $34,999 | 288 (11.6%) | 351 (15.2%) |
| $35,000 to $39,999 | 138 (5.6%) | 187 (8.1%) |
| $40,000 to $44,999 | 408 (16.4%) | 276 (11.9%) |
| $45,000 to $49,999 | 113 (4.5%) | 81 (3.5%) |
| $50,000 to $54,999 | 216 (8.7%) | 79 (3.4%) |
| $55,000 to $64,999 | 420 (16.9%) | 144 (6.2%) |
| $65,000 to $74,999 | 100 (4.0%) | 0 (0.0%) |
| $75,000 to $99,999 | 224 (9.0%) | 503 (21.8%) |
| $100,000+ | 218 (8.8%) | 7 (0.3%) |
| Total | 2,482 (100.0%) | 2,310 (100.0%) |
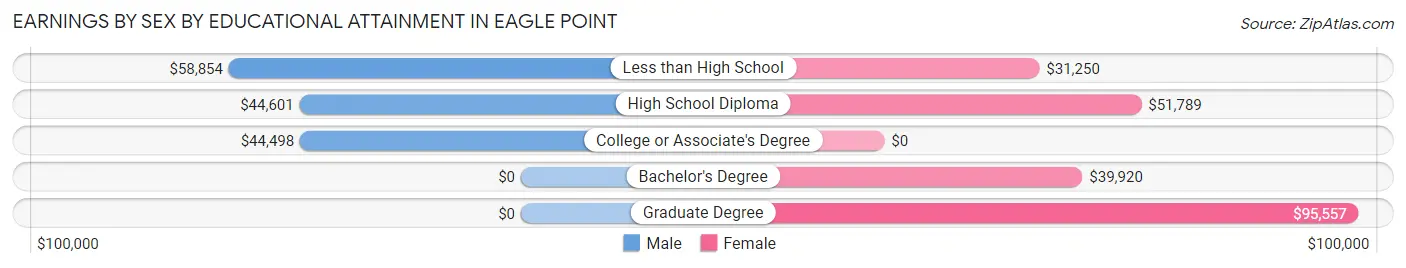
Earnings by Sex by Educational Attainment in Eagle Point
Average earnings in Eagle Point are $48,940 for men and $41,121 for women, a difference of 16.0%. Men with an educational attainment of less than high school enjoy the highest average annual earnings of $58,854, while those with college or associate's degree education earn the least with $44,498. Women with an educational attainment of graduate degree earn the most with the average annual earnings of $95,557, while those with less than high school education have the smallest earnings of $31,250.
| Educational Attainment | Male Income | Female Income |
| Less than High School | $58,854 | $31,250 |
| High School Diploma | $44,601 | $51,789 |
| College or Associate's Degree | $44,498 | $0 |
| Bachelor's Degree | - | - |
| Graduate Degree | - | - |
| Total | $48,940 | $41,121 |
Family Income in Eagle Point
Family Income Brackets in Eagle Point
According to the Eagle Point family income data, there are 691 families falling into the $50,000 to $74,999 income range, which is the most common income bracket and makes up 26.8% of all families.
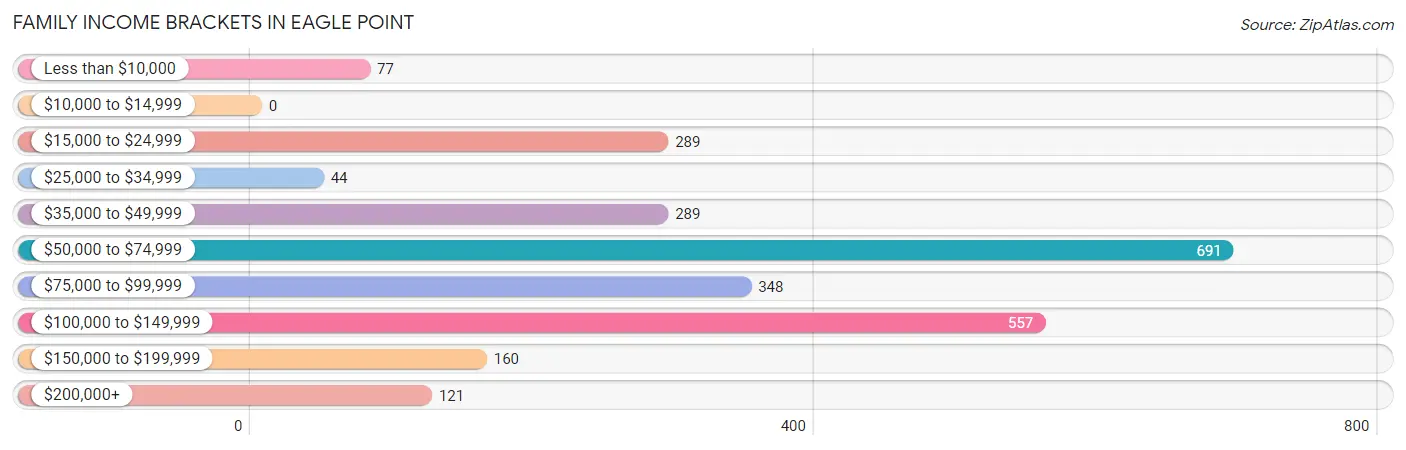
| Income Bracket | # Families | % Families |
| Less than $10,000 | 77 | 3.0% |
| $10,000 to $14,999 | 0 | 0.0% |
| $15,000 to $24,999 | 289 | 11.2% |
| $25,000 to $34,999 | 44 | 1.7% |
| $35,000 to $49,999 | 289 | 11.2% |
| $50,000 to $74,999 | 691 | 26.8% |
| $75,000 to $99,999 | 348 | 13.5% |
| $100,000 to $149,999 | 557 | 21.6% |
| $150,000 to $199,999 | 160 | 6.2% |
| $200,000+ | 121 | 4.7% |
Family Income by Famaliy Size in Eagle Point
4-person families (197 | 7.6%) account for the highest median family income in Eagle Point with $107,153 per family, while 2-person families (1,461 | 56.7%) have the highest median income of $35,949 per family member.
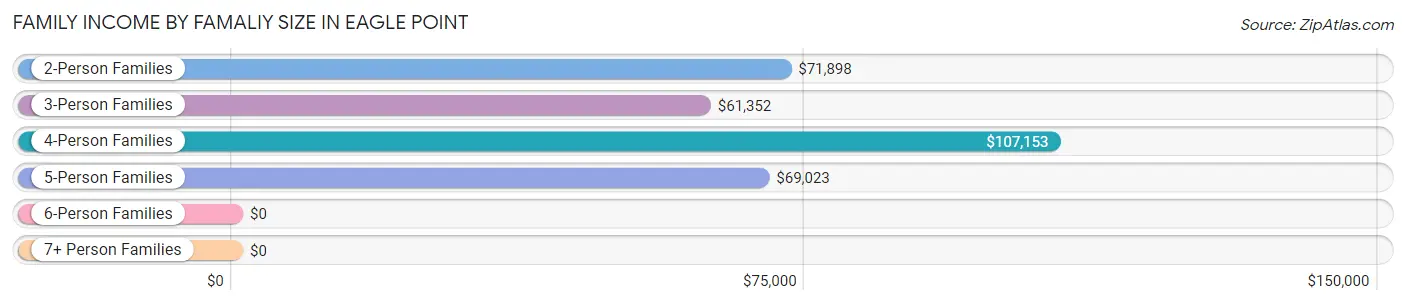
| Income Bracket | # Families | Median Income |
| 2-Person Families | 1,461 (56.7%) | $71,898 |
| 3-Person Families | 432 (16.8%) | $61,352 |
| 4-Person Families | 197 (7.6%) | $107,153 |
| 5-Person Families | 206 (8.0%) | $69,023 |
| 6-Person Families | 202 (7.8%) | $0 |
| 7+ Person Families | 79 (3.1%) | $0 |
| Total | 2,577 (100.0%) | $70,332 |
Family Income by Number of Earners in Eagle Point
The median family income in Eagle Point is $70,332, with families comprising 3+ earners (314) having the highest median family income of $129,123, while families with 1 earner (1,011) have the lowest median family income of $51,837, accounting for 12.2% and 39.2% of families, respectively.
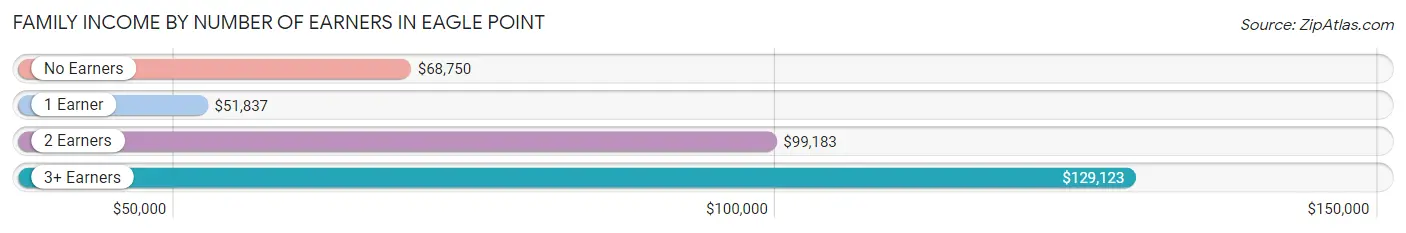
| Number of Earners | # Families | Median Income |
| No Earners | 532 (20.6%) | $68,750 |
| 1 Earner | 1,011 (39.2%) | $51,837 |
| 2 Earners | 720 (27.9%) | $99,183 |
| 3+ Earners | 314 (12.2%) | $129,123 |
| Total | 2,577 (100.0%) | $70,332 |
Household Income in Eagle Point
Household Income Brackets in Eagle Point
With 1,099 households falling in the category, the $100,000 to $149,999 income range is the most frequent in Eagle Point, accounting for 31.1% of all households. In contrast, only 53 households (1.5%) fall into the $10,000 to $14,999 income bracket, making it the least populous group.
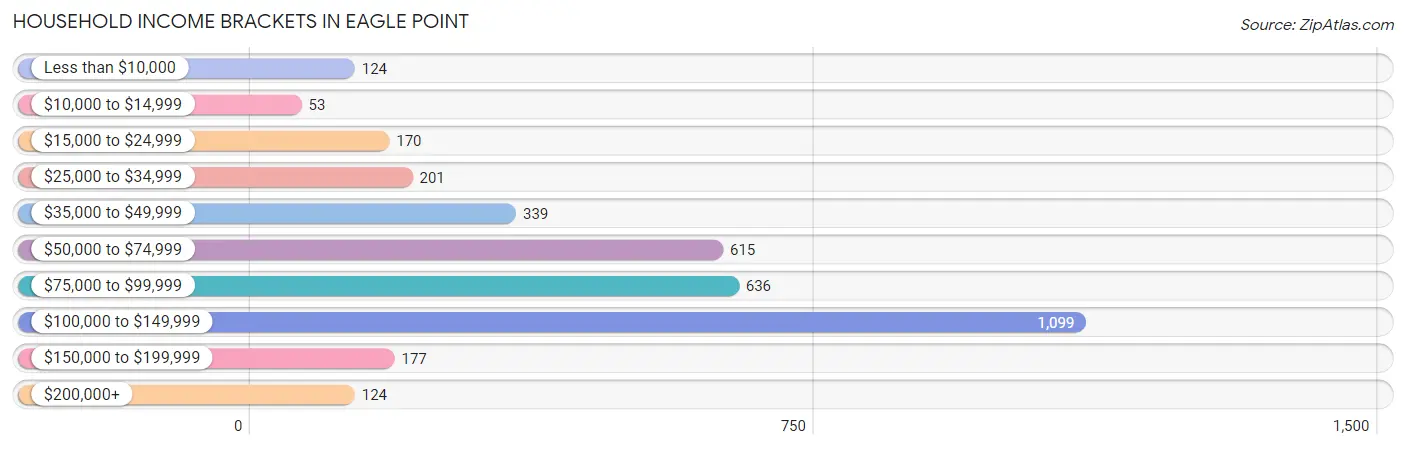
| Income Bracket | # Households | % Households |
| Less than $10,000 | 124 | 3.5% |
| $10,000 to $14,999 | 53 | 1.5% |
| $15,000 to $24,999 | 170 | 4.8% |
| $25,000 to $34,999 | 201 | 5.7% |
| $35,000 to $49,999 | 339 | 9.6% |
| $50,000 to $74,999 | 615 | 17.4% |
| $75,000 to $99,999 | 636 | 18.0% |
| $100,000 to $149,999 | 1,099 | 31.1% |
| $150,000 to $199,999 | 177 | 5.0% |
| $200,000+ | 124 | 3.5% |
Household Income by Householder Age in Eagle Point
The median household income in Eagle Point is $83,625, with the highest median household income of $98,725 found in the 45 to 64 years age bracket for the primary householder. A total of 1,137 households (32.2%) fall into this category.
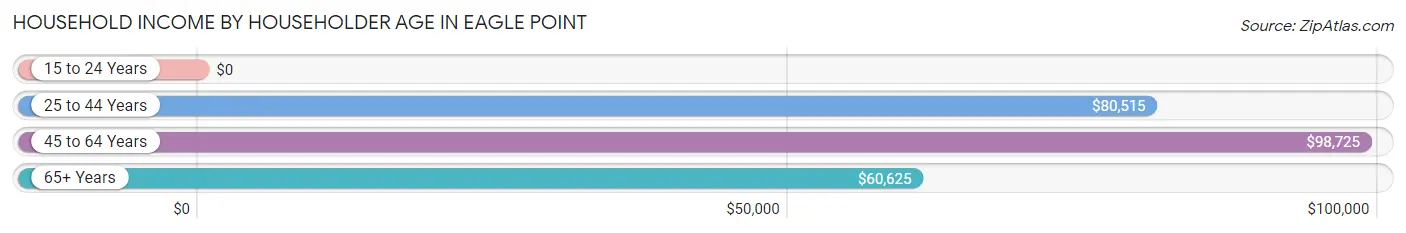
| Income Bracket | # Households | Median Income |
| 15 to 24 Years | 0 (0.0%) | $0 |
| 25 to 44 Years | 1,321 (37.4%) | $80,515 |
| 45 to 64 Years | 1,137 (32.2%) | $98,725 |
| 65+ Years | 1,077 (30.5%) | $60,625 |
| Total | 3,535 (100.0%) | $83,625 |
Poverty in Eagle Point
Income Below Poverty by Sex and Age in Eagle Point
With 5.4% poverty level for males and 13.6% for females among the residents of Eagle Point, 18 to 24 year old males and 35 to 44 year old females are the most vulnerable to poverty, with 47 males (67.1%) and 222 females (48.7%) in their respective age groups living below the poverty level.
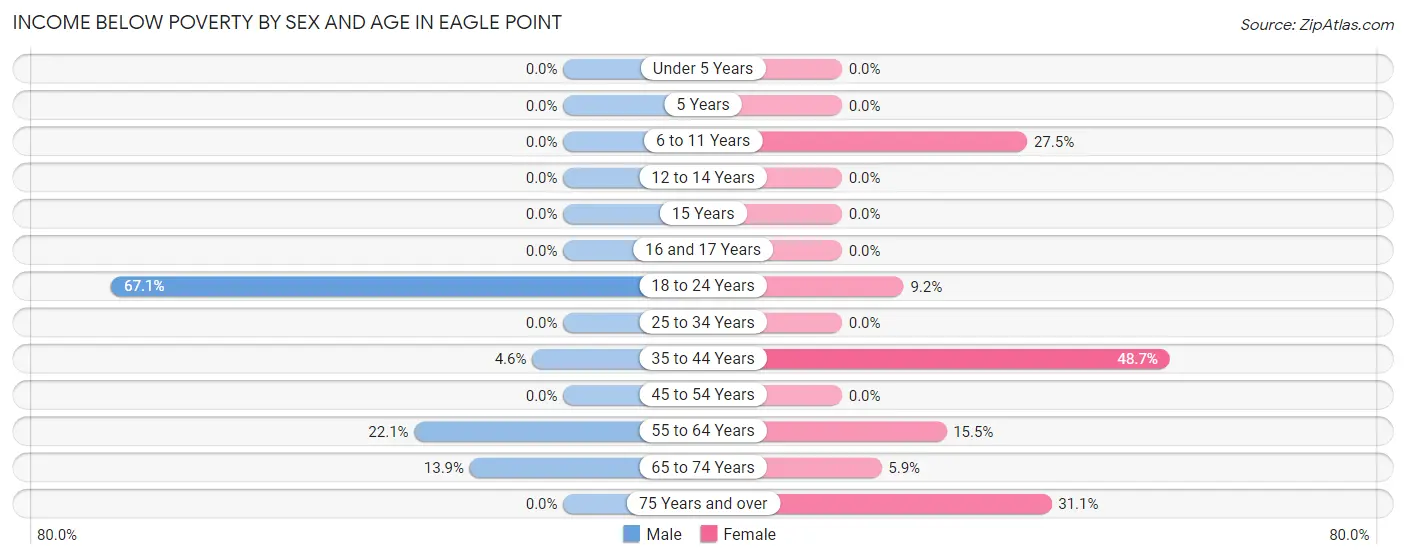
| Age Bracket | Male | Female |
| Under 5 Years | 0 (0.0%) | 0 (0.0%) |
| 5 Years | 0 (0.0%) | 0 (0.0%) |
| 6 to 11 Years | 0 (0.0%) | 184 (27.5%) |
| 12 to 14 Years | 0 (0.0%) | 0 (0.0%) |
| 15 Years | 0 (0.0%) | 0 (0.0%) |
| 16 and 17 Years | 0 (0.0%) | 0 (0.0%) |
| 18 to 24 Years | 47 (67.1%) | 25 (9.2%) |
| 25 to 34 Years | 0 (0.0%) | 0 (0.0%) |
| 35 to 44 Years | 31 (4.6%) | 222 (48.7%) |
| 45 to 54 Years | 0 (0.0%) | 0 (0.0%) |
| 55 to 64 Years | 94 (22.1%) | 73 (15.5%) |
| 65 to 74 Years | 84 (13.9%) | 30 (5.9%) |
| 75 Years and over | 0 (0.0%) | 98 (31.1%) |
| Total | 256 (5.4%) | 632 (13.6%) |
Income Above Poverty by Sex and Age in Eagle Point
According to the poverty statistics in Eagle Point, males aged under 5 years and females aged under 5 years are the age groups that are most secure financially, with 100.0% of males and 100.0% of females in these age groups living above the poverty line.
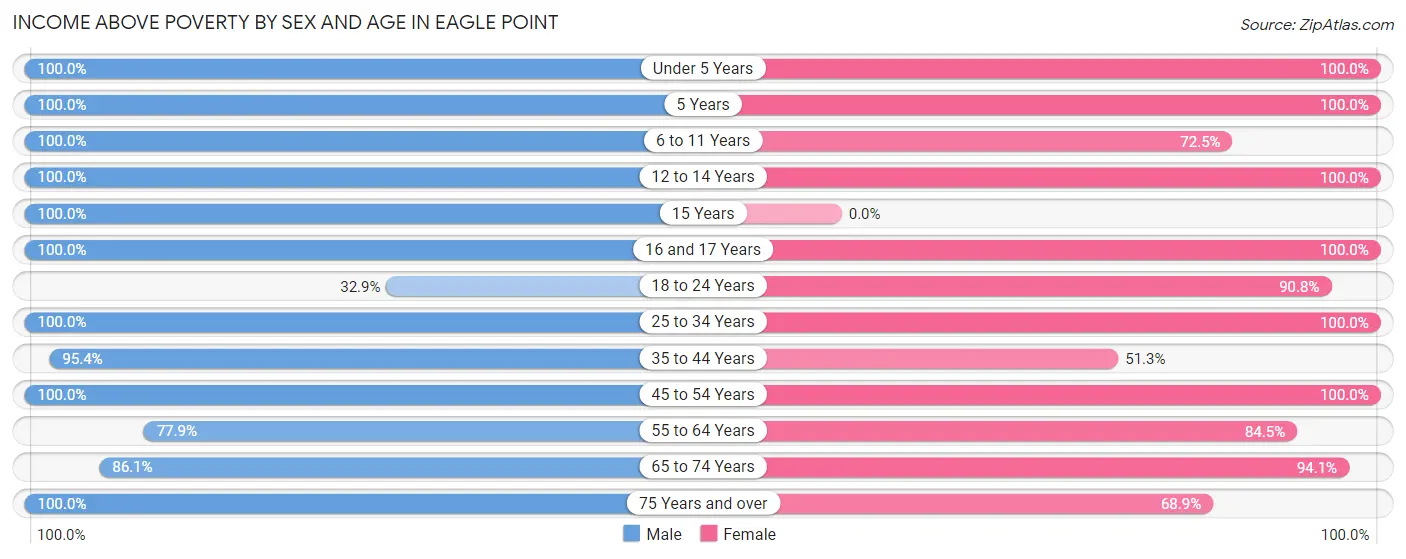
| Age Bracket | Male | Female |
| Under 5 Years | 308 (100.0%) | 304 (100.0%) |
| 5 Years | 163 (100.0%) | 68 (100.0%) |
| 6 to 11 Years | 758 (100.0%) | 485 (72.5%) |
| 12 to 14 Years | 32 (100.0%) | 73 (100.0%) |
| 15 Years | 21 (100.0%) | 0 (0.0%) |
| 16 and 17 Years | 31 (100.0%) | 93 (100.0%) |
| 18 to 24 Years | 23 (32.9%) | 248 (90.8%) |
| 25 to 34 Years | 777 (100.0%) | 743 (100.0%) |
| 35 to 44 Years | 641 (95.4%) | 234 (51.3%) |
| 45 to 54 Years | 603 (100.0%) | 682 (100.0%) |
| 55 to 64 Years | 331 (77.9%) | 398 (84.5%) |
| 65 to 74 Years | 521 (86.1%) | 481 (94.1%) |
| 75 Years and over | 287 (100.0%) | 217 (68.9%) |
| Total | 4,496 (94.6%) | 4,026 (86.4%) |
Income Below Poverty Among Married-Couple Families in Eagle Point
The poverty statistics for married-couple families in Eagle Point show that 7.0% or 129 of the total 1,837 families live below the poverty line. Families with no children have the highest poverty rate of 11.4%, comprising of 129 families. On the other hand, families with 1 or 2 children have the lowest poverty rate of 0.0%, which includes 0 families.
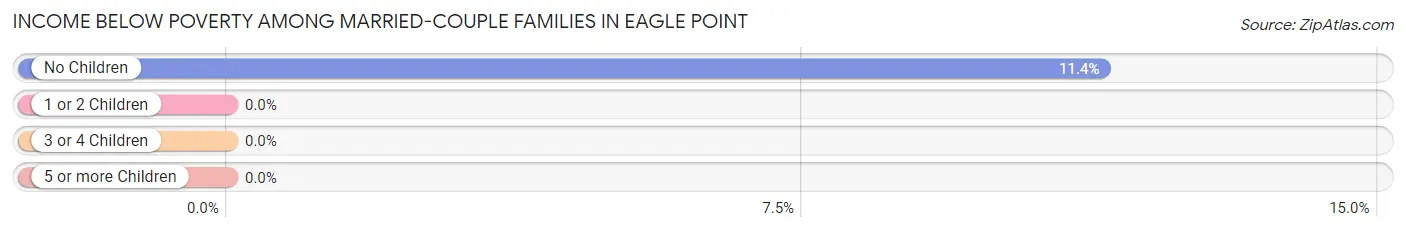
| Children | Above Poverty | Below Poverty |
| No Children | 1,003 (88.6%) | 129 (11.4%) |
| 1 or 2 Children | 270 (100.0%) | 0 (0.0%) |
| 3 or 4 Children | 356 (100.0%) | 0 (0.0%) |
| 5 or more Children | 79 (100.0%) | 0 (0.0%) |
| Total | 1,708 (93.0%) | 129 (7.0%) |
Income Below Poverty Among Single-Parent Households in Eagle Point
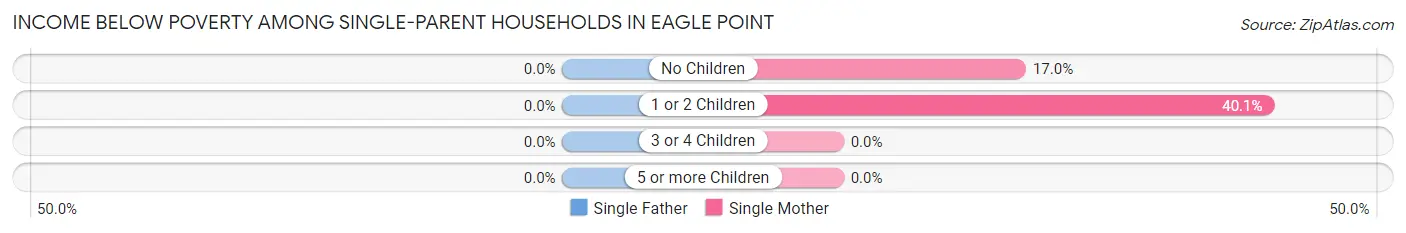
| Children | Single Father | Single Mother |
| No Children | 0 (0.0%) | 18 (17.0%) |
| 1 or 2 Children | 0 (0.0%) | 156 (40.1%) |
| 3 or 4 Children | 0 (0.0%) | 0 (0.0%) |
| 5 or more Children | 0 (0.0%) | 0 (0.0%) |
| Total | 0 (0.0%) | 174 (35.1%) |
Income Below Poverty Among Married-Couple vs Single-Parent Households in Eagle Point
The poverty data for Eagle Point shows that 129 of the married-couple family households (7.0%) and 174 of the single-parent households (23.5%) are living below the poverty level. Within the married-couple family households, those with no children have the highest poverty rate, with 129 households (11.4%) falling below the poverty line. Among the single-parent households, those with 1 or 2 children have the highest poverty rate, with 156 household (25.6%) living below poverty.
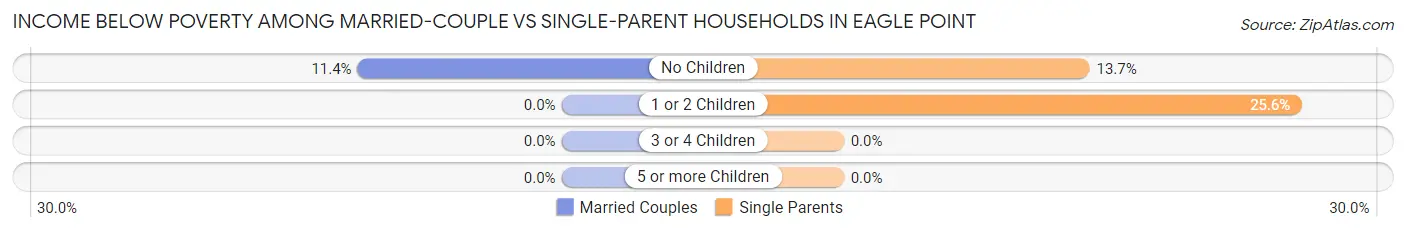
| Children | Married-Couple Families | Single-Parent Households |
| No Children | 129 (11.4%) | 18 (13.7%) |
| 1 or 2 Children | 0 (0.0%) | 156 (25.6%) |
| 3 or 4 Children | 0 (0.0%) | 0 (0.0%) |
| 5 or more Children | 0 (0.0%) | 0 (0.0%) |
| Total | 129 (7.0%) | 174 (23.5%) |
Race in Eagle Point
The most populous races in Eagle Point are White / Caucasian (8,550 | 87.8%), Hispanic or Latino (979 | 10.1%), and Some other Race (756 | 7.8%).
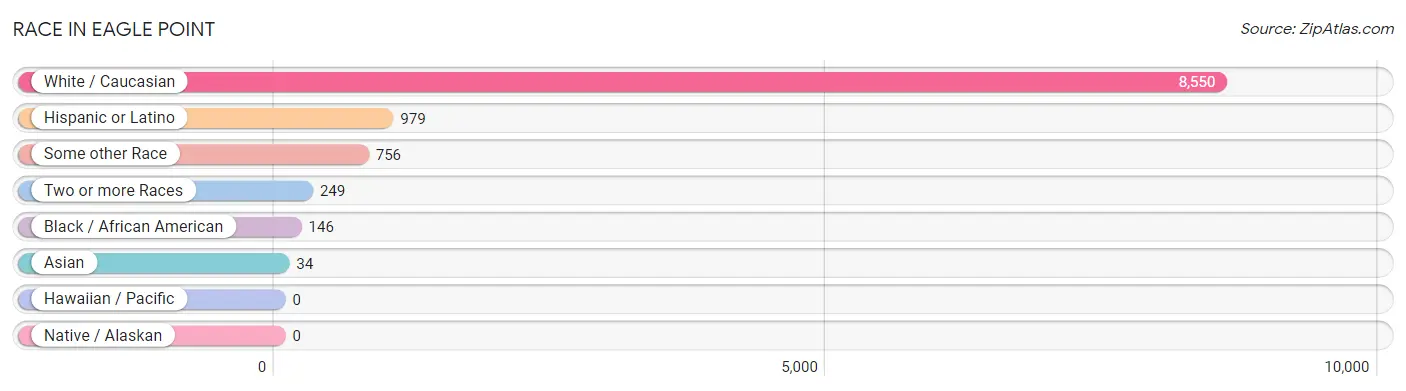
| Race | # Population | % Population |
| Asian | 34 | 0.4% |
| Black / African American | 146 | 1.5% |
| Hawaiian / Pacific | 0 | 0.0% |
| Hispanic or Latino | 979 | 10.1% |
| Native / Alaskan | 0 | 0.0% |
| White / Caucasian | 8,550 | 87.8% |
| Two or more Races | 249 | 2.6% |
| Some other Race | 756 | 7.8% |
| Total | 9,735 | 100.0% |
Ancestry in Eagle Point
The most populous ancestries reported in Eagle Point are English (2,042 | 21.0%), Irish (1,111 | 11.4%), Mexican (971 | 10.0%), German (554 | 5.7%), and Italian (356 | 3.7%), together accounting for 51.7% of all Eagle Point residents.
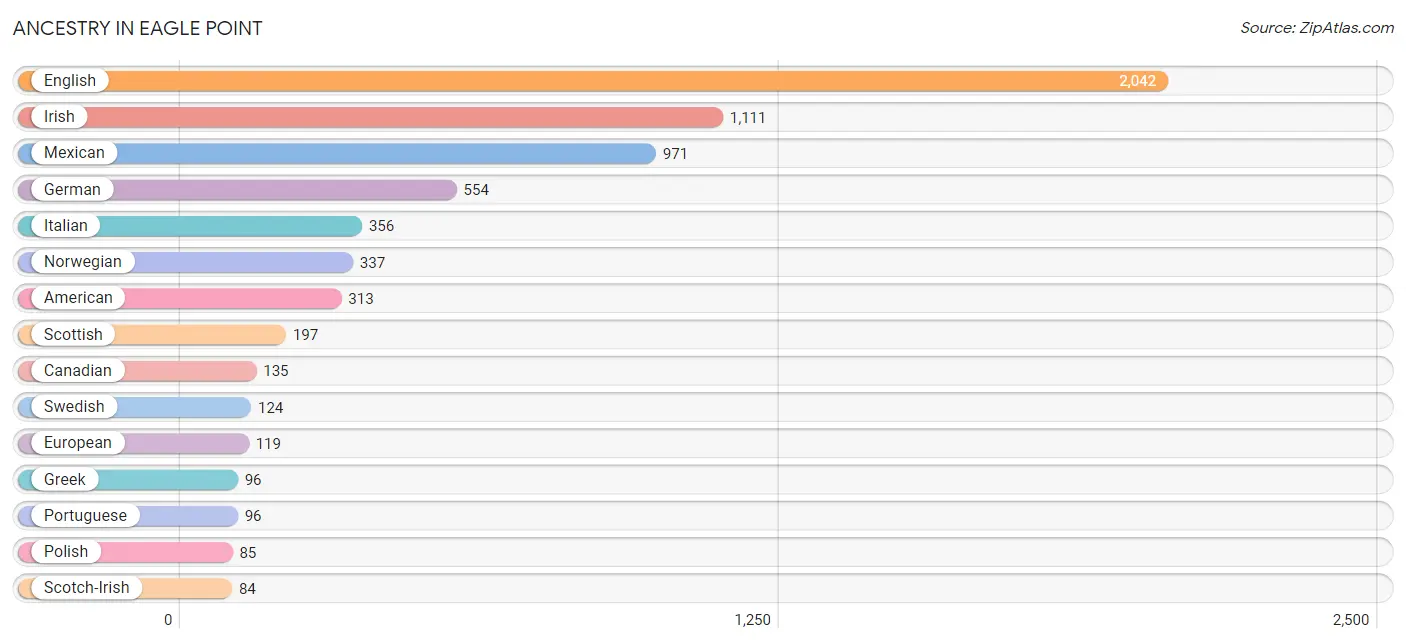
| Ancestry | # Population | % Population |
| American | 313 | 3.2% |
| Bhutanese | 15 | 0.2% |
| Brazilian | 67 | 0.7% |
| British | 9 | 0.1% |
| Canadian | 135 | 1.4% |
| Cherokee | 46 | 0.5% |
| Czech | 19 | 0.2% |
| Dutch | 46 | 0.5% |
| Eastern European | 15 | 0.2% |
| English | 2,042 | 21.0% |
| European | 119 | 1.2% |
| French | 10 | 0.1% |
| French American Indian | 28 | 0.3% |
| French Canadian | 51 | 0.5% |
| German | 554 | 5.7% |
| Greek | 96 | 1.0% |
| Irish | 1,111 | 11.4% |
| Italian | 356 | 3.7% |
| Korean | 19 | 0.2% |
| Mexican | 971 | 10.0% |
| Mexican American Indian | 39 | 0.4% |
| Norwegian | 337 | 3.5% |
| Polish | 85 | 0.9% |
| Portuguese | 96 | 1.0% |
| Scandinavian | 14 | 0.1% |
| Scotch-Irish | 84 | 0.9% |
| Scottish | 197 | 2.0% |
| Spaniard | 8 | 0.1% |
| Swedish | 124 | 1.3% |
| Swiss | 26 | 0.3% |
| Welsh | 32 | 0.3% |
| Yugoslavian | 11 | 0.1% | View All 32 Rows |
Immigrants in Eagle Point
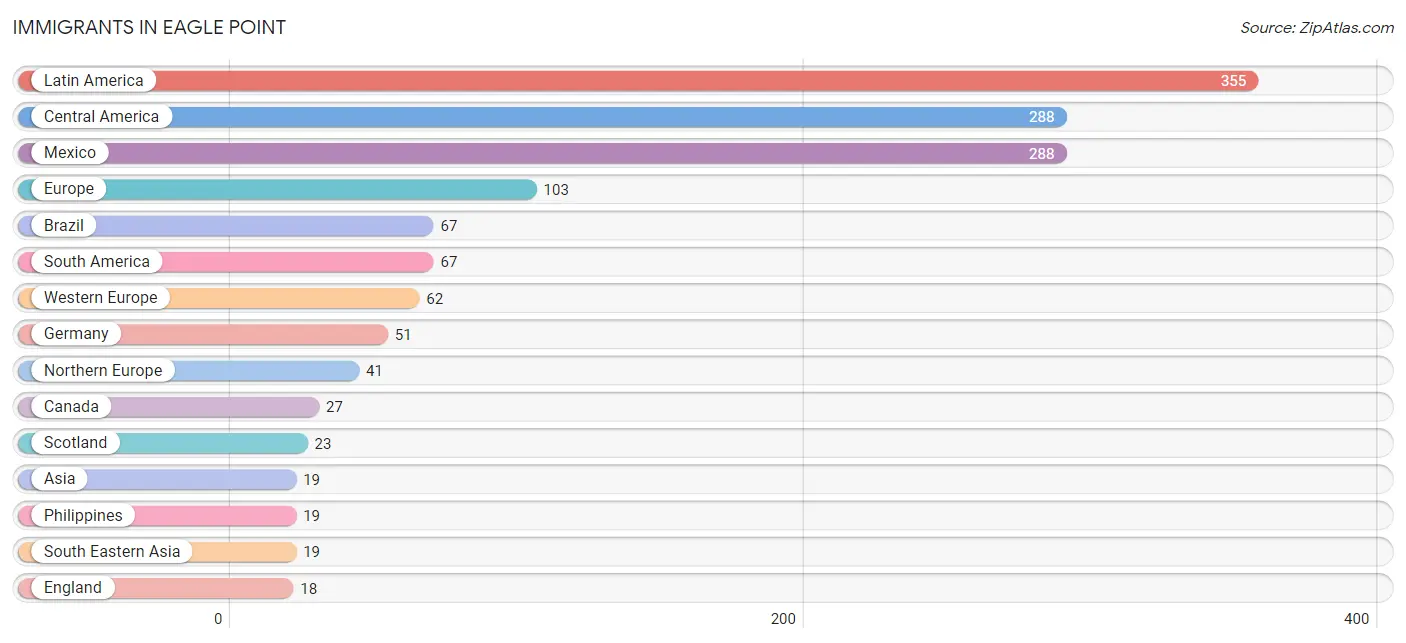
The most numerous immigrant groups reported in Eagle Point came from Latin America (355 | 3.6%), Central America (288 | 3.0%), Mexico (288 | 3.0%), Europe (103 | 1.1%), and Brazil (67 | 0.7%), together accounting for 11.3% of all Eagle Point residents.
| Immigration Origin | # Population | % Population |
| Asia | 19 | 0.2% |
| Brazil | 67 | 0.7% |
| Canada | 27 | 0.3% |
| Central America | 288 | 3.0% |
| England | 18 | 0.2% |
| Europe | 103 | 1.1% |
| Germany | 51 | 0.5% |
| Latin America | 355 | 3.6% |
| Mexico | 288 | 3.0% |
| Netherlands | 11 | 0.1% |
| Northern Europe | 41 | 0.4% |
| Philippines | 19 | 0.2% |
| Scotland | 23 | 0.2% |
| South America | 67 | 0.7% |
| South Eastern Asia | 19 | 0.2% |
| Western Europe | 62 | 0.6% | View All 16 Rows |
Sex and Age in Eagle Point
Sex and Age in Eagle Point
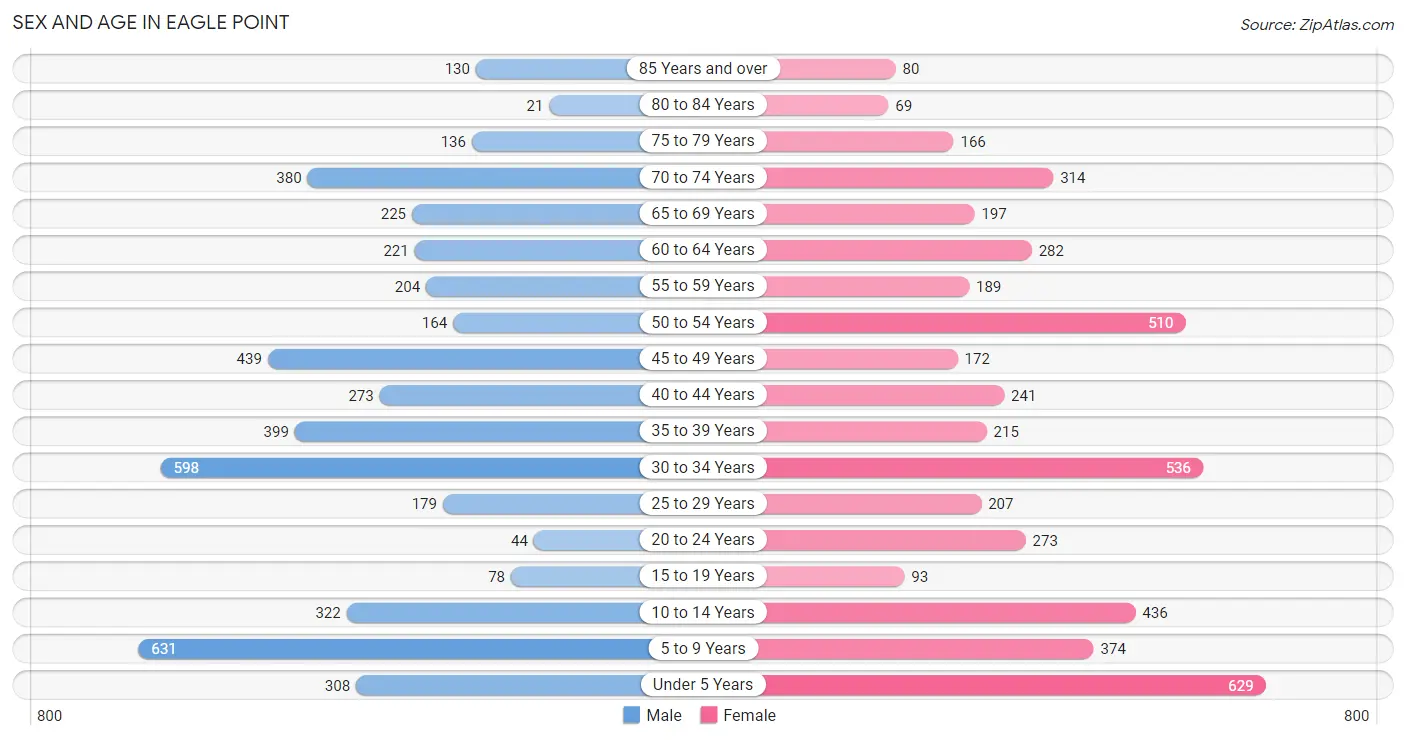
The most populous age groups in Eagle Point are 5 to 9 Years (631 | 13.3%) for men and Under 5 Years (629 | 12.6%) for women.
| Age Bracket | Male | Female |
| Under 5 Years | 308 (6.5%) | 629 (12.6%) |
| 5 to 9 Years | 631 (13.3%) | 374 (7.5%) |
| 10 to 14 Years | 322 (6.8%) | 436 (8.7%) |
| 15 to 19 Years | 78 (1.6%) | 93 (1.9%) |
| 20 to 24 Years | 44 (0.9%) | 273 (5.5%) |
| 25 to 29 Years | 179 (3.8%) | 207 (4.2%) |
| 30 to 34 Years | 598 (12.6%) | 536 (10.8%) |
| 35 to 39 Years | 399 (8.4%) | 215 (4.3%) |
| 40 to 44 Years | 273 (5.7%) | 241 (4.8%) |
| 45 to 49 Years | 439 (9.2%) | 172 (3.5%) |
| 50 to 54 Years | 164 (3.5%) | 510 (10.2%) |
| 55 to 59 Years | 204 (4.3%) | 189 (3.8%) |
| 60 to 64 Years | 221 (4.6%) | 282 (5.7%) |
| 65 to 69 Years | 225 (4.7%) | 197 (4.0%) |
| 70 to 74 Years | 380 (8.0%) | 314 (6.3%) |
| 75 to 79 Years | 136 (2.9%) | 166 (3.3%) |
| 80 to 84 Years | 21 (0.4%) | 69 (1.4%) |
| 85 Years and over | 130 (2.7%) | 80 (1.6%) |
| Total | 4,752 (100.0%) | 4,983 (100.0%) |
Families and Households in Eagle Point
Median Family Size in Eagle Point
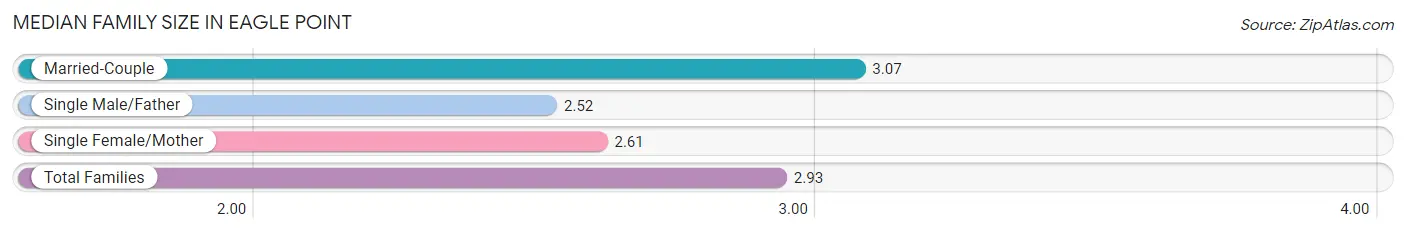
The median family size in Eagle Point is 2.93 persons per family, with married-couple families (1,837 | 71.3%) accounting for the largest median family size of 3.07 persons per family. On the other hand, single male/father families (245 | 9.5%) represent the smallest median family size with 2.52 persons per family.
| Family Type | # Families | Family Size |
| Married-Couple | 1,837 (71.3%) | 3.07 |
| Single Male/Father | 245 (9.5%) | 2.52 |
| Single Female/Mother | 495 (19.2%) | 2.61 |
| Total Families | 2,577 (100.0%) | 2.93 |
Median Household Size in Eagle Point
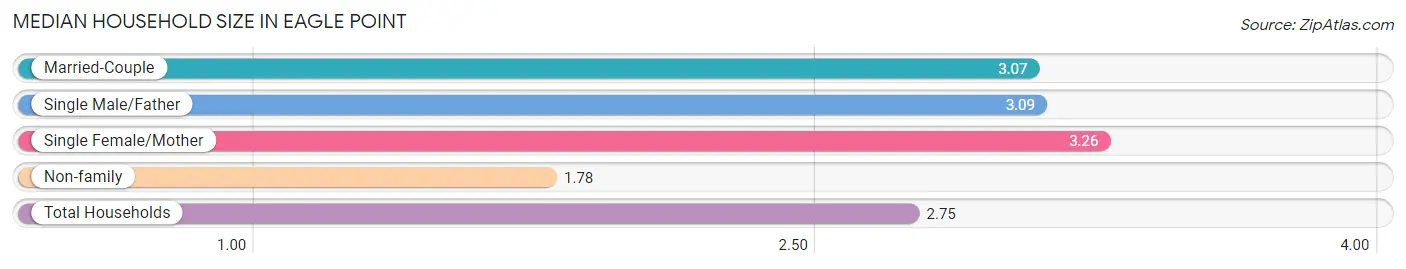
The median household size in Eagle Point is 2.75 persons per household, with single female/mother households (495 | 14.0%) accounting for the largest median household size of 3.26 persons per household. non-family households (958 | 27.1%) represent the smallest median household size with 1.78 persons per household.
| Household Type | # Households | Household Size |
| Married-Couple | 1,837 (52.0%) | 3.07 |
| Single Male/Father | 245 (6.9%) | 3.09 |
| Single Female/Mother | 495 (14.0%) | 3.26 |
| Non-family | 958 (27.1%) | 1.78 |
| Total Households | 3,535 (100.0%) | 2.75 |
Household Size by Marriage Status in Eagle Point
Out of a total of 3,535 households in Eagle Point, 2,577 (72.9%) are family households, while 958 (27.1%) are nonfamily households. The most numerous type of family households are 2-person households, comprising 1,271, and the most common type of nonfamily households are 1-person households, comprising 504.
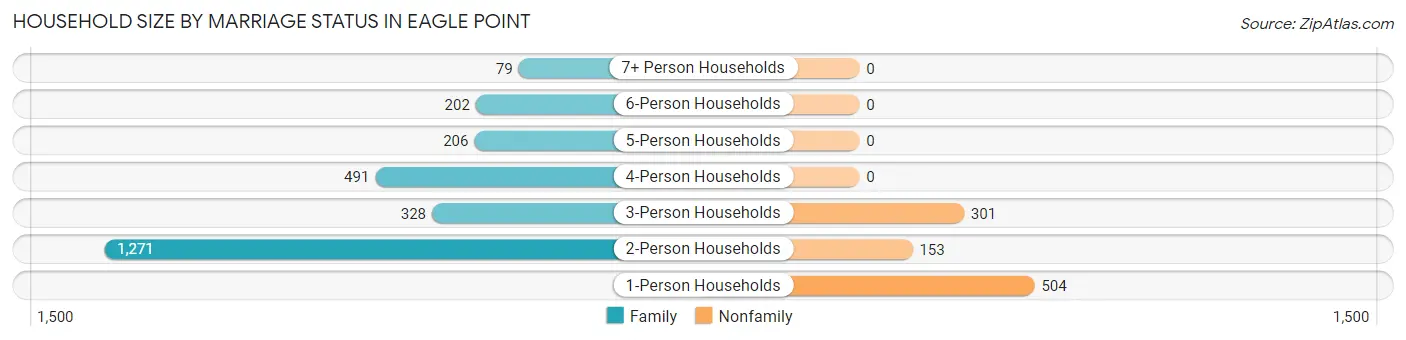
| Household Size | Family Households | Nonfamily Households |
| 1-Person Households | - | 504 (14.3%) |
| 2-Person Households | 1,271 (35.9%) | 153 (4.3%) |
| 3-Person Households | 328 (9.3%) | 301 (8.5%) |
| 4-Person Households | 491 (13.9%) | 0 (0.0%) |
| 5-Person Households | 206 (5.8%) | 0 (0.0%) |
| 6-Person Households | 202 (5.7%) | 0 (0.0%) |
| 7+ Person Households | 79 (2.2%) | 0 (0.0%) |
| Total | 2,577 (72.9%) | 958 (27.1%) |
Female Fertility in Eagle Point
Fertility by Age in Eagle Point
Average fertility rate in Eagle Point is 36.0 births per 1,000 women. Women in the age bracket of 20 to 34 years have the highest fertility rate with 61.0 births per 1,000 women. Women in the age bracket of 20 to 34 years acount for 100.0% of all women with births.
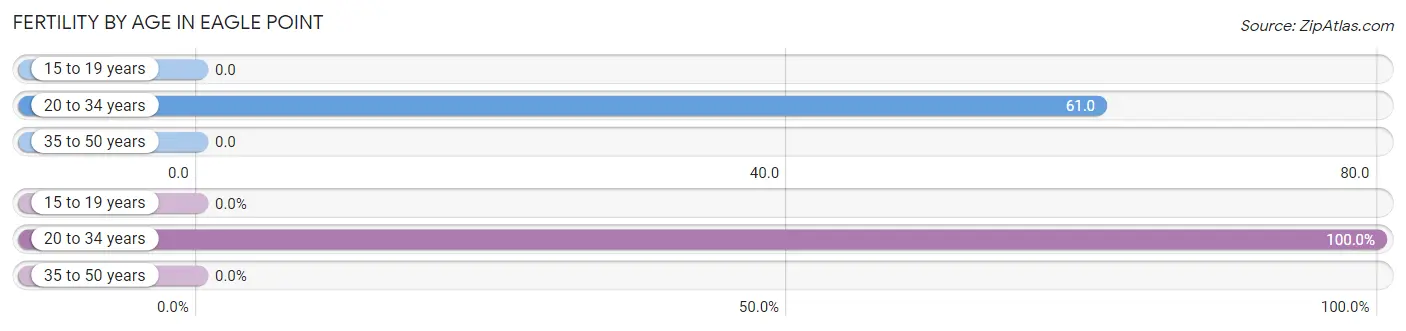
| Age Bracket | Women with Births | Births / 1,000 Women |
| 15 to 19 years | 0 (0.0%) | 0.0 |
| 20 to 34 years | 62 (100.0%) | 61.0 |
| 35 to 50 years | 0 (0.0%) | 0.0 |
| Total | 62 (100.0%) | 36.0 |
Fertility by Age by Marriage Status in Eagle Point
72.6% of women with births (62) in Eagle Point are married. The highest percentage of unmarried women with births falls into 20 to 34 years age bracket with 27.4% of them unmarried at the time of birth, while the lowest percentage of unmarried women with births belong to 20 to 34 years age bracket with 27.4% of them unmarried.
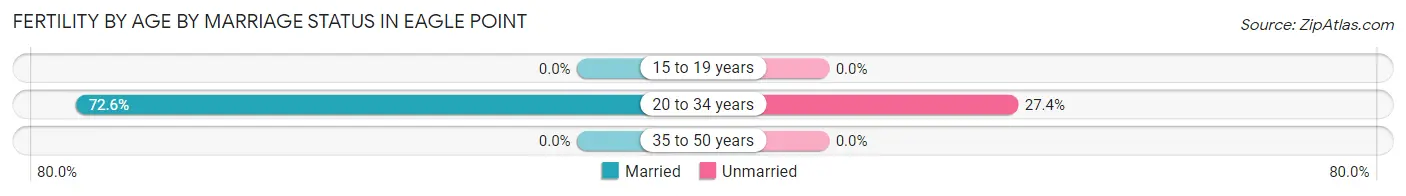
| Age Bracket | Married | Unmarried |
| 15 to 19 years | 0 (0.0%) | 0 (0.0%) |
| 20 to 34 years | 45 (72.6%) | 17 (27.4%) |
| 35 to 50 years | 0 (0.0%) | 0 (0.0%) |
| Total | 45 (72.6%) | 17 (27.4%) |
Fertility by Education in Eagle Point
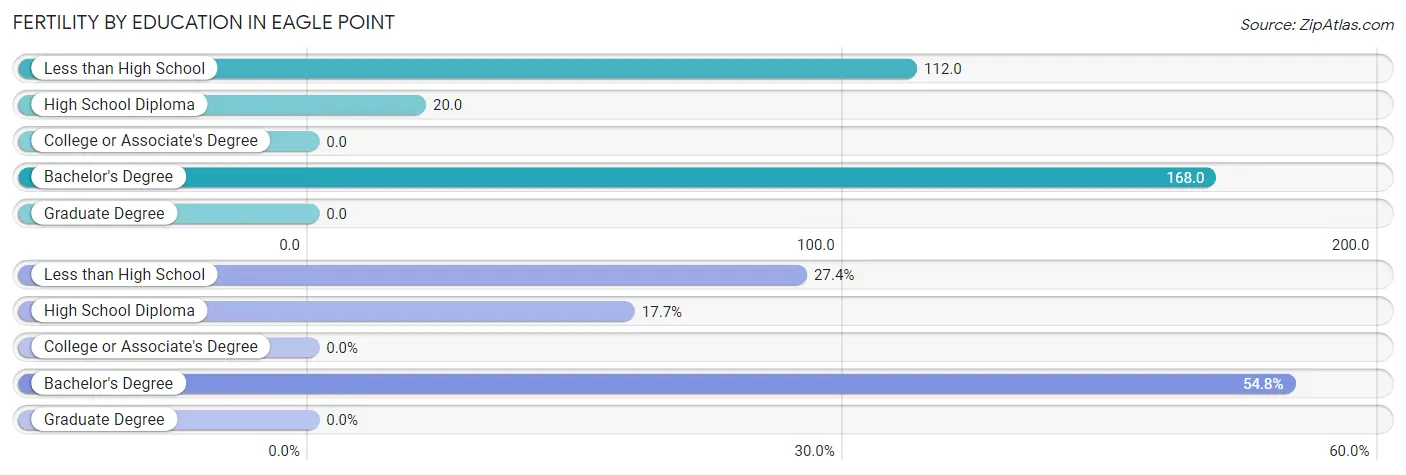
| Educational Attainment | Women with Births | Births / 1,000 Women |
| Less than High School | 17 (27.4%) | 112.0 |
| High School Diploma | 11 (17.7%) | 20.0 |
| College or Associate's Degree | 0 (0.0%) | 0.0 |
| Bachelor's Degree | 34 (54.8%) | 168.0 |
| Graduate Degree | 0 (0.0%) | 0.0 |
| Total | 62 (100.0%) | 36.0 |
Fertility by Education by Marriage Status in Eagle Point
27.4% of women with births in Eagle Point are unmarried. Women with the educational attainment of high school diploma are most likely to be married with 100.0% of them married at childbirth, while women with the educational attainment of less than high school are least likely to be married with 100.0% of them unmarried at childbirth.
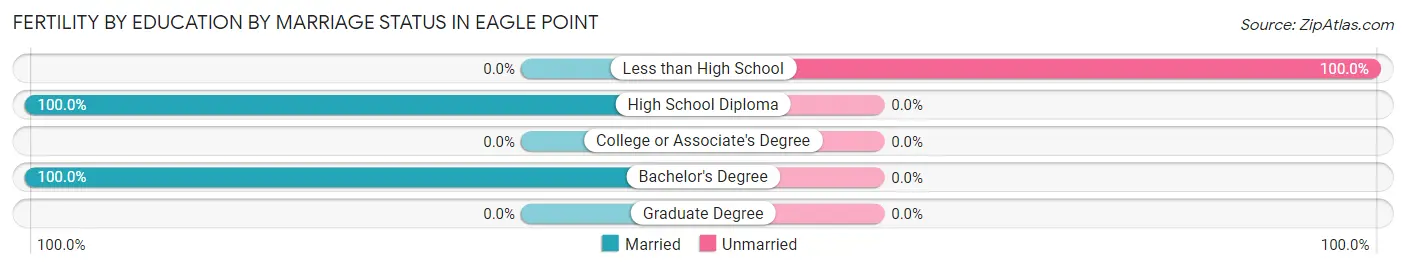
| Educational Attainment | Married | Unmarried |
| Less than High School | 0 (0.0%) | 17 (100.0%) |
| High School Diploma | 11 (100.0%) | 0 (0.0%) |
| College or Associate's Degree | 0 (0.0%) | 0 (0.0%) |
| Bachelor's Degree | 34 (100.0%) | 0 (0.0%) |
| Graduate Degree | 0 (0.0%) | 0 (0.0%) |
| Total | 45 (72.6%) | 17 (27.4%) |
Employment Characteristics in Eagle Point
Employment by Class of Employer in Eagle Point
Among the 3,913 employed individuals in Eagle Point, private company employees (3,039 | 77.7%), not-for-profit organizations (368 | 9.4%), and self-employed (not incorporated) (221 | 5.7%) make up the most common classes of employment.

| Employer Class | # Employees | % Employees |
| Private Company Employees | 3,039 | 77.7% |
| Self-Employed (Incorporated) | 0 | 0.0% |
| Self-Employed (Not Incorporated) | 221 | 5.7% |
| Not-for-profit Organizations | 368 | 9.4% |
| Local Government Employees | 128 | 3.3% |
| State Government Employees | 56 | 1.4% |
| Federal Government Employees | 101 | 2.6% |
| Unpaid Family Workers | 0 | 0.0% |
| Total | 3,913 | 100.0% |
Employment Status by Age in Eagle Point
According to the labor force statistics for Eagle Point, out of the total population over 16 years of age (7,014), 67.1% or 4,706 individuals are in the labor force, with 12.9% or 607 of them unemployed. The age group with the highest labor force participation rate is 20 to 24 years, with 100.0% or 317 individuals in the labor force. Within the labor force, the 60 to 64 years age range has the highest percentage of unemployed individuals, with 36.6% or 78 of them being unemployed.
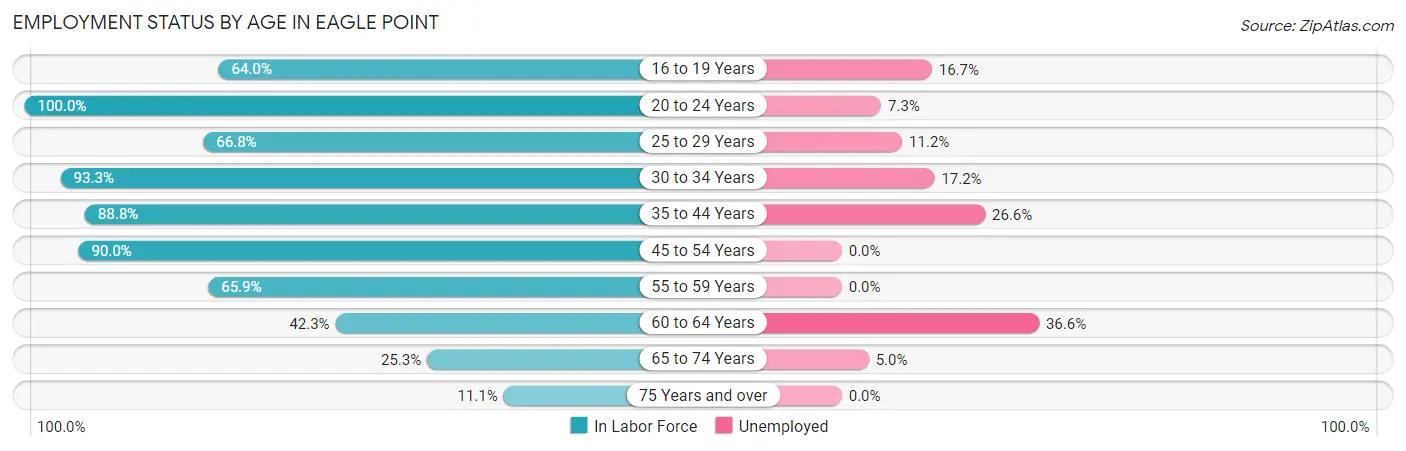
| Age Bracket | In Labor Force | Unemployed |
| 16 to 19 Years | 96 (64.0%) | 16 (16.7%) |
| 20 to 24 Years | 317 (100.0%) | 23 (7.3%) |
| 25 to 29 Years | 258 (66.8%) | 29 (11.2%) |
| 30 to 34 Years | 1,058 (93.3%) | 182 (17.2%) |
| 35 to 44 Years | 1,002 (88.8%) | 267 (26.6%) |
| 45 to 54 Years | 1,156 (90.0%) | 0 (0.0%) |
| 55 to 59 Years | 259 (65.9%) | 0 (0.0%) |
| 60 to 64 Years | 213 (42.3%) | 78 (36.6%) |
| 65 to 74 Years | 282 (25.3%) | 14 (5.0%) |
| 75 Years and over | 67 (11.1%) | 0 (0.0%) |
| Total | 4,706 (67.1%) | 607 (12.9%) |
Employment Status by Educational Attainment in Eagle Point
According to labor force statistics for Eagle Point, 81.7% of individuals (3,945) out of the total population between 25 and 64 years of age (4,829) are in the labor force, with 14.1% or 556 of them being unemployed. The group with the highest labor force participation rate are those with the educational attainment of high school diploma, with 88.7% or 1,479 individuals in the labor force. Within the labor force, individuals with college / associate degree education have the highest percentage of unemployment, with 27.8% or 459 of them being unemployed.
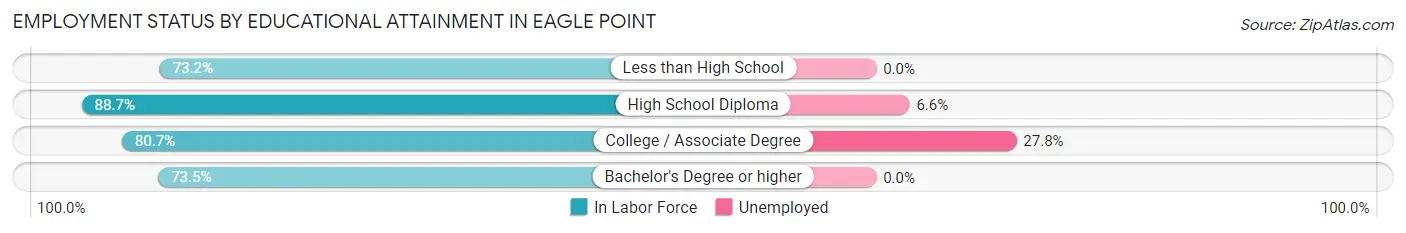
| Educational Attainment | In Labor Force | Unemployed |
| Less than High School | 376 (73.2%) | 0 (0.0%) |
| High School Diploma | 1,479 (88.7%) | 110 (6.6%) |
| College / Associate Degree | 1,650 (80.7%) | 568 (27.8%) |
| Bachelor's Degree or higher | 444 (73.5%) | 0 (0.0%) |
| Total | 3,945 (81.7%) | 681 (14.1%) |
Employment Occupations by Sex in Eagle Point
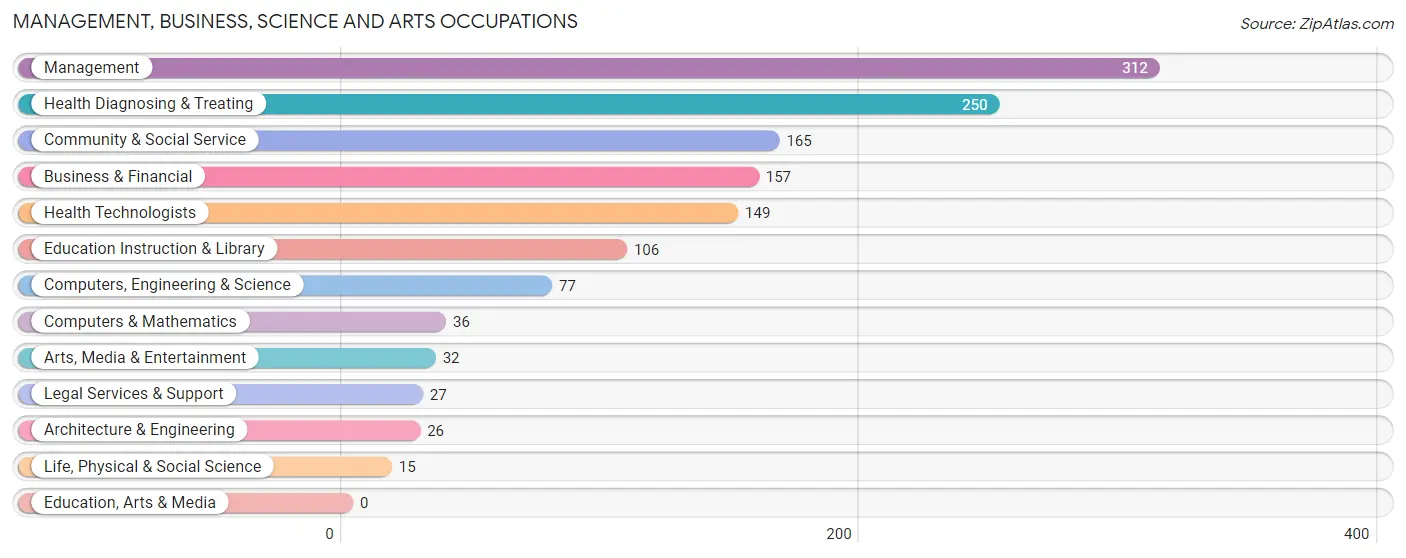
Management, Business, Science and Arts Occupations
The most common Management, Business, Science and Arts occupations in Eagle Point are Management (312 | 7.6%), Health Diagnosing & Treating (250 | 6.1%), Community & Social Service (165 | 4.0%), Business & Financial (157 | 3.8%), and Health Technologists (149 | 3.6%).
Management, Business, Science and Arts Occupations by Sex
Within the Management, Business, Science and Arts occupations in Eagle Point, the most male-oriented occupations are Computers, Engineering & Science (100.0%), Computers & Mathematics (100.0%), and Architecture & Engineering (100.0%), while the most female-oriented occupations are Health Diagnosing & Treating (100.0%), Health Technologists (100.0%), and Education Instruction & Library (75.5%).
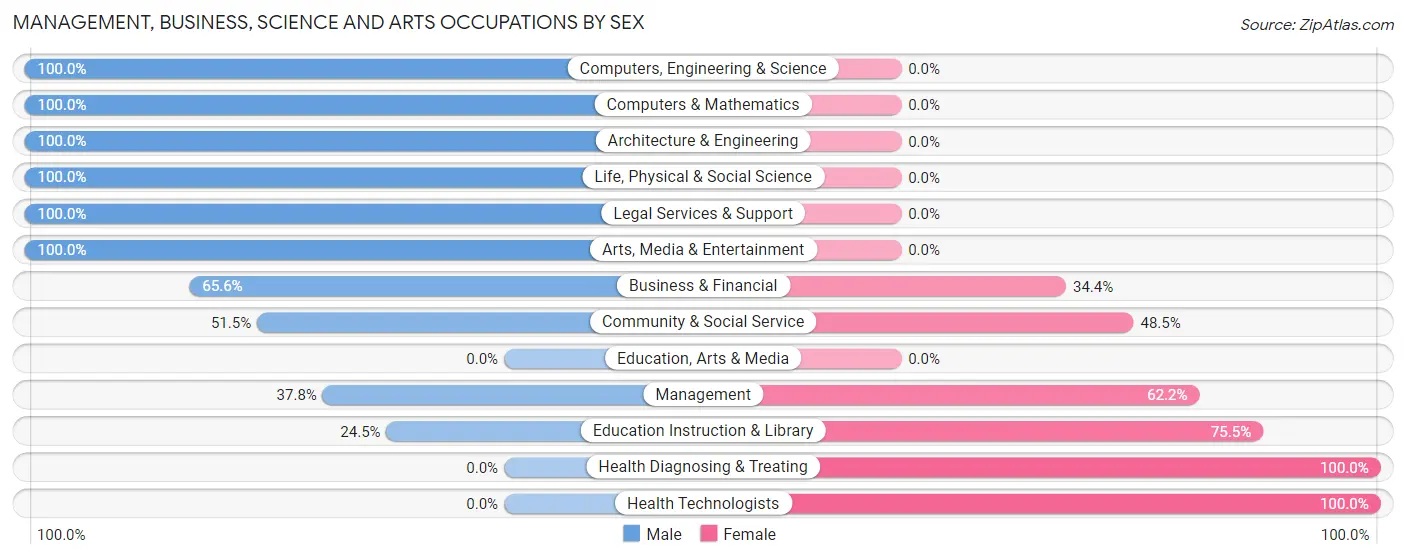
| Occupation | Male | Female |
| Management | 118 (37.8%) | 194 (62.2%) |
| Business & Financial | 103 (65.6%) | 54 (34.4%) |
| Computers, Engineering & Science | 77 (100.0%) | 0 (0.0%) |
| Computers & Mathematics | 36 (100.0%) | 0 (0.0%) |
| Architecture & Engineering | 26 (100.0%) | 0 (0.0%) |
| Life, Physical & Social Science | 15 (100.0%) | 0 (0.0%) |
| Community & Social Service | 85 (51.5%) | 80 (48.5%) |
| Education, Arts & Media | 0 (0.0%) | 0 (0.0%) |
| Legal Services & Support | 27 (100.0%) | 0 (0.0%) |
| Education Instruction & Library | 26 (24.5%) | 80 (75.5%) |
| Arts, Media & Entertainment | 32 (100.0%) | 0 (0.0%) |
| Health Diagnosing & Treating | 0 (0.0%) | 250 (100.0%) |
| Health Technologists | 0 (0.0%) | 149 (100.0%) |
| Total (Category) | 383 (39.9%) | 578 (60.2%) |
| Total (Overall) | 1,913 (46.7%) | 2,187 (53.3%) |
Services Occupations
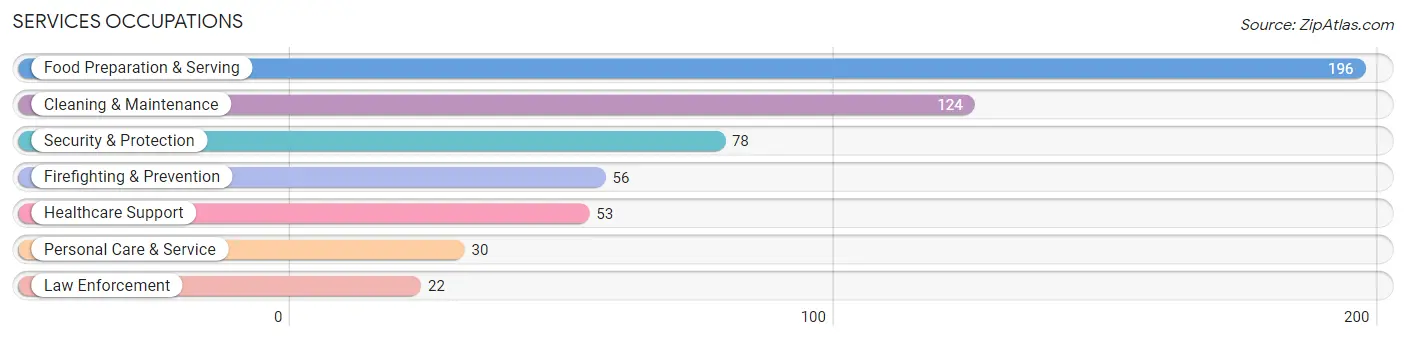
The most common Services occupations in Eagle Point are Food Preparation & Serving (196 | 4.8%), Cleaning & Maintenance (124 | 3.0%), Security & Protection (78 | 1.9%), Firefighting & Prevention (56 | 1.4%), and Healthcare Support (53 | 1.3%).
Services Occupations by Sex
Within the Services occupations in Eagle Point, the most male-oriented occupations are Law Enforcement (100.0%), Cleaning & Maintenance (100.0%), and Personal Care & Service (100.0%), while the most female-oriented occupations are Healthcare Support (100.0%), Food Preparation & Serving (100.0%), and Firefighting & Prevention (71.4%).
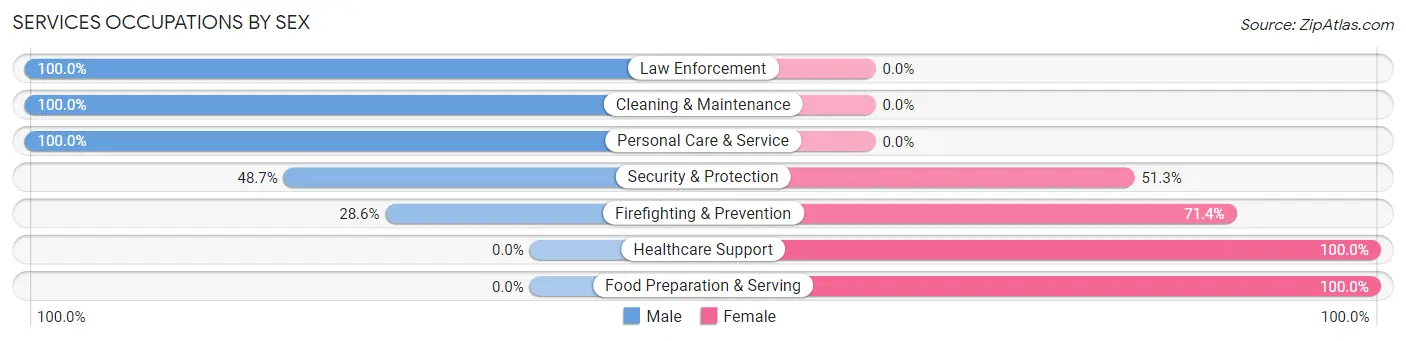
| Occupation | Male | Female |
| Healthcare Support | 0 (0.0%) | 53 (100.0%) |
| Security & Protection | 38 (48.7%) | 40 (51.3%) |
| Firefighting & Prevention | 16 (28.6%) | 40 (71.4%) |
| Law Enforcement | 22 (100.0%) | 0 (0.0%) |
| Food Preparation & Serving | 0 (0.0%) | 196 (100.0%) |
| Cleaning & Maintenance | 124 (100.0%) | 0 (0.0%) |
| Personal Care & Service | 30 (100.0%) | 0 (0.0%) |
| Total (Category) | 192 (39.9%) | 289 (60.1%) |
| Total (Overall) | 1,913 (46.7%) | 2,187 (53.3%) |
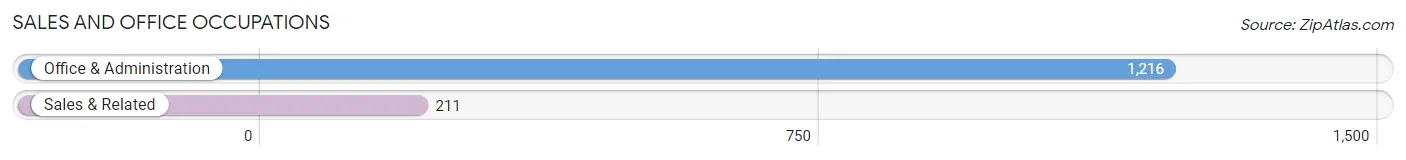
Sales and Office Occupations
The most common Sales and Office occupations in Eagle Point are Office & Administration (1,216 | 29.7%), and Sales & Related (211 | 5.1%).
Sales and Office Occupations by Sex
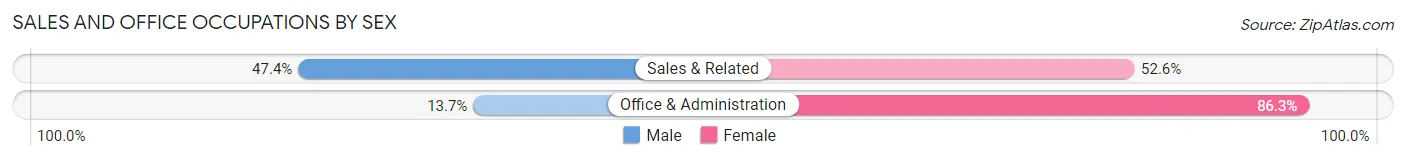
| Occupation | Male | Female |
| Sales & Related | 100 (47.4%) | 111 (52.6%) |
| Office & Administration | 167 (13.7%) | 1,049 (86.3%) |
| Total (Category) | 267 (18.7%) | 1,160 (81.3%) |
| Total (Overall) | 1,913 (46.7%) | 2,187 (53.3%) |
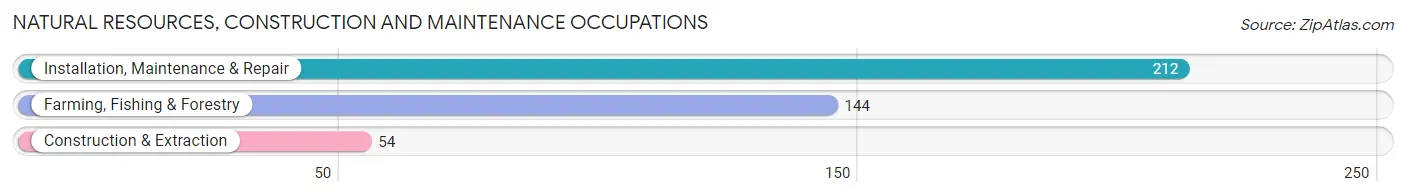
Natural Resources, Construction and Maintenance Occupations
The most common Natural Resources, Construction and Maintenance occupations in Eagle Point are Installation, Maintenance & Repair (212 | 5.2%), Farming, Fishing & Forestry (144 | 3.5%), and Construction & Extraction (54 | 1.3%).
Natural Resources, Construction and Maintenance Occupations by Sex
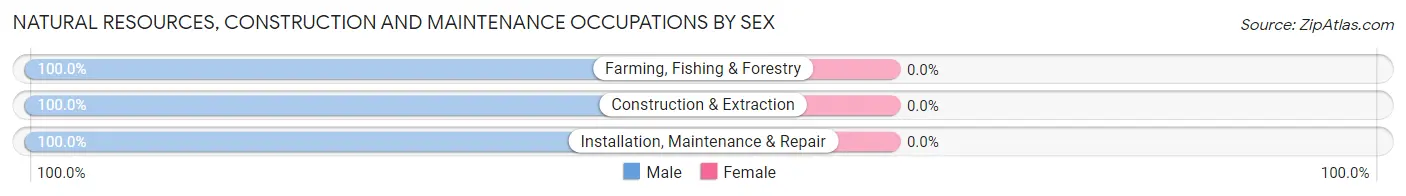
| Occupation | Male | Female |
| Farming, Fishing & Forestry | 144 (100.0%) | 0 (0.0%) |
| Construction & Extraction | 54 (100.0%) | 0 (0.0%) |
| Installation, Maintenance & Repair | 212 (100.0%) | 0 (0.0%) |
| Total (Category) | 410 (100.0%) | 0 (0.0%) |
| Total (Overall) | 1,913 (46.7%) | 2,187 (53.3%) |
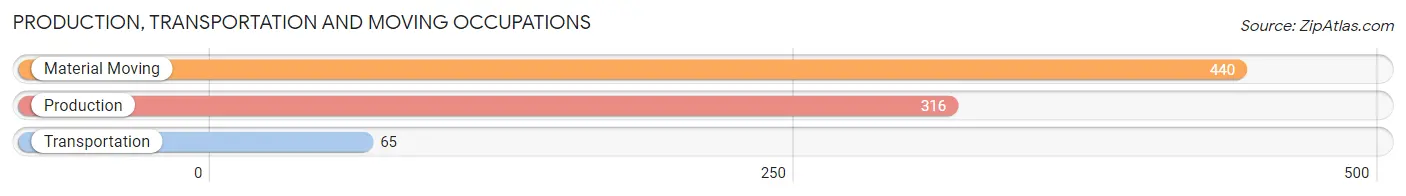
Production, Transportation and Moving Occupations
The most common Production, Transportation and Moving occupations in Eagle Point are Material Moving (440 | 10.7%), Production (316 | 7.7%), and Transportation (65 | 1.6%).
Production, Transportation and Moving Occupations by Sex
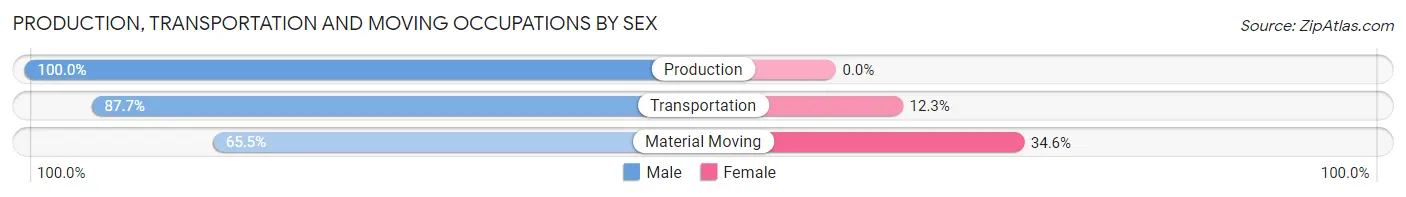
| Occupation | Male | Female |
| Production | 316 (100.0%) | 0 (0.0%) |
| Transportation | 57 (87.7%) | 8 (12.3%) |
| Material Moving | 288 (65.4%) | 152 (34.5%) |
| Total (Category) | 661 (80.5%) | 160 (19.5%) |
| Total (Overall) | 1,913 (46.7%) | 2,187 (53.3%) |
Employment Industries by Sex in Eagle Point
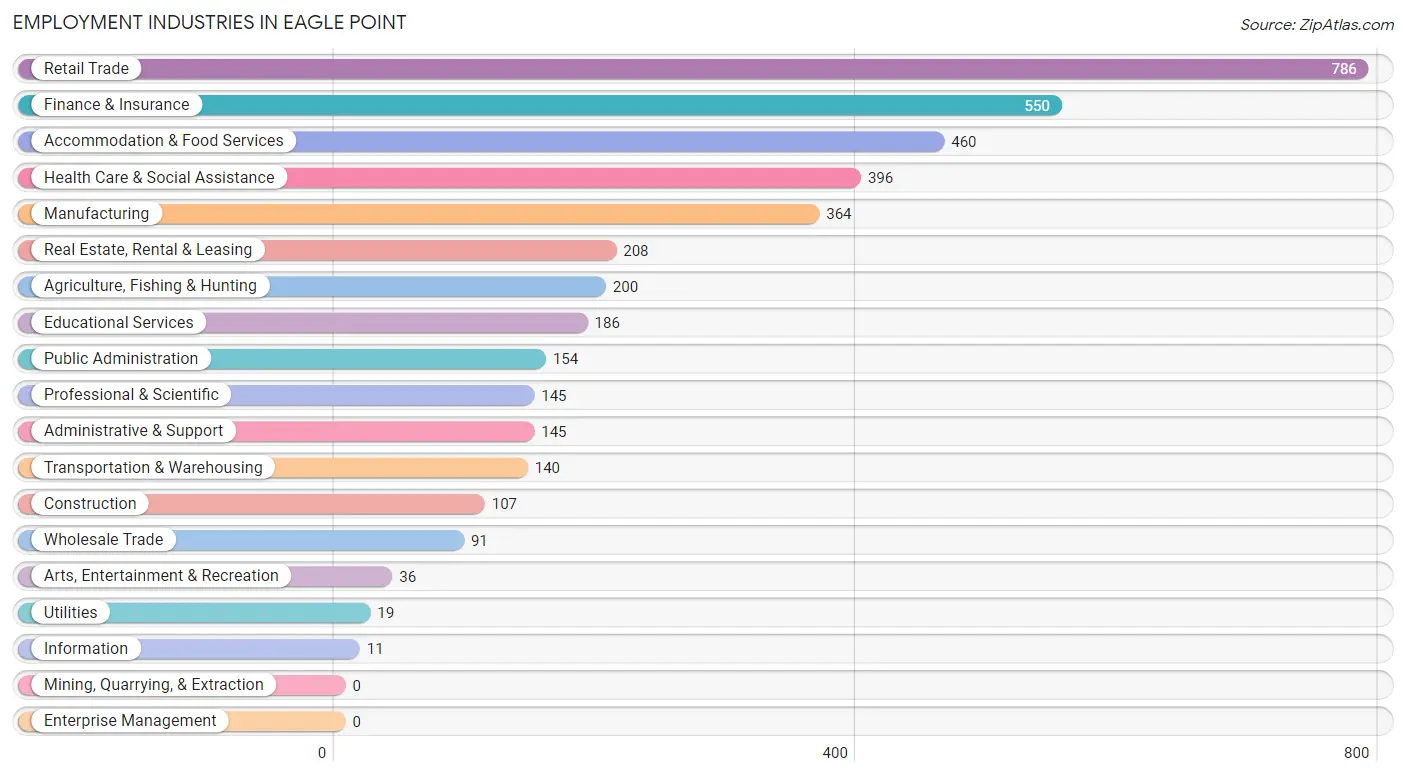
Employment Industries in Eagle Point
The major employment industries in Eagle Point include Retail Trade (786 | 19.2%), Finance & Insurance (550 | 13.4%), Accommodation & Food Services (460 | 11.2%), Health Care & Social Assistance (396 | 9.7%), and Manufacturing (364 | 8.9%).
Employment Industries by Sex in Eagle Point
The Eagle Point industries that see more men than women are Agriculture, Fishing & Hunting (100.0%), Utilities (100.0%), and Information (100.0%), whereas the industries that tend to have a higher number of women are Finance & Insurance (92.7%), Real Estate, Rental & Leasing (91.8%), and Wholesale Trade (82.4%).
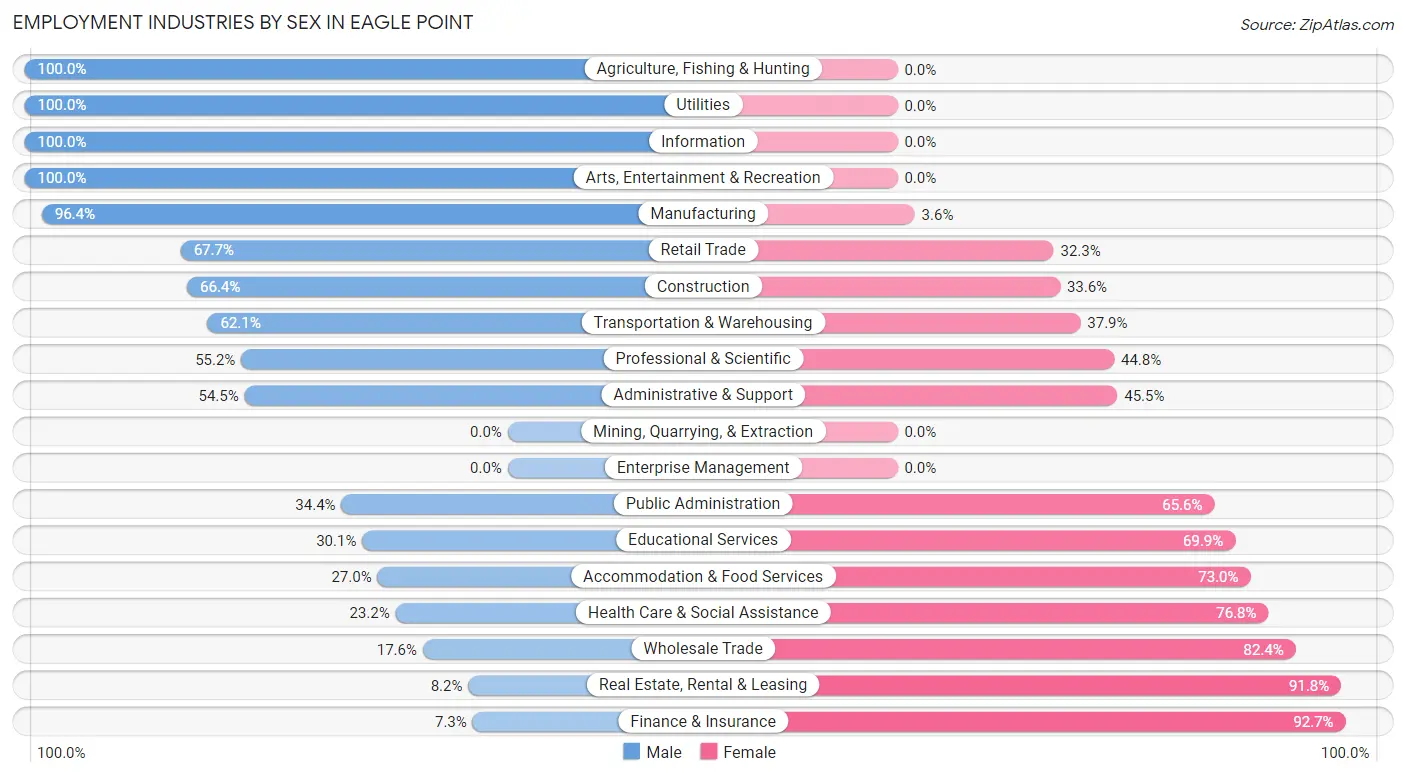
| Industry | Male | Female |
| Agriculture, Fishing & Hunting | 200 (100.0%) | 0 (0.0%) |
| Mining, Quarrying, & Extraction | 0 (0.0%) | 0 (0.0%) |
| Construction | 71 (66.4%) | 36 (33.6%) |
| Manufacturing | 351 (96.4%) | 13 (3.6%) |
| Wholesale Trade | 16 (17.6%) | 75 (82.4%) |
| Retail Trade | 532 (67.7%) | 254 (32.3%) |
| Transportation & Warehousing | 87 (62.1%) | 53 (37.9%) |
| Utilities | 19 (100.0%) | 0 (0.0%) |
| Information | 11 (100.0%) | 0 (0.0%) |
| Finance & Insurance | 40 (7.3%) | 510 (92.7%) |
| Real Estate, Rental & Leasing | 17 (8.2%) | 191 (91.8%) |
| Professional & Scientific | 80 (55.2%) | 65 (44.8%) |
| Enterprise Management | 0 (0.0%) | 0 (0.0%) |
| Administrative & Support | 79 (54.5%) | 66 (45.5%) |
| Educational Services | 56 (30.1%) | 130 (69.9%) |
| Health Care & Social Assistance | 92 (23.2%) | 304 (76.8%) |
| Arts, Entertainment & Recreation | 36 (100.0%) | 0 (0.0%) |
| Accommodation & Food Services | 124 (27.0%) | 336 (73.0%) |
| Public Administration | 53 (34.4%) | 101 (65.6%) |
| Total | 1,913 (46.7%) | 2,187 (53.3%) |
Education in Eagle Point
School Enrollment in Eagle Point
The most common levels of schooling among the 2,221 students in Eagle Point are elementary school (672 | 30.3%), middle school (625 | 28.1%), and kindergarten (398 | 17.9%).
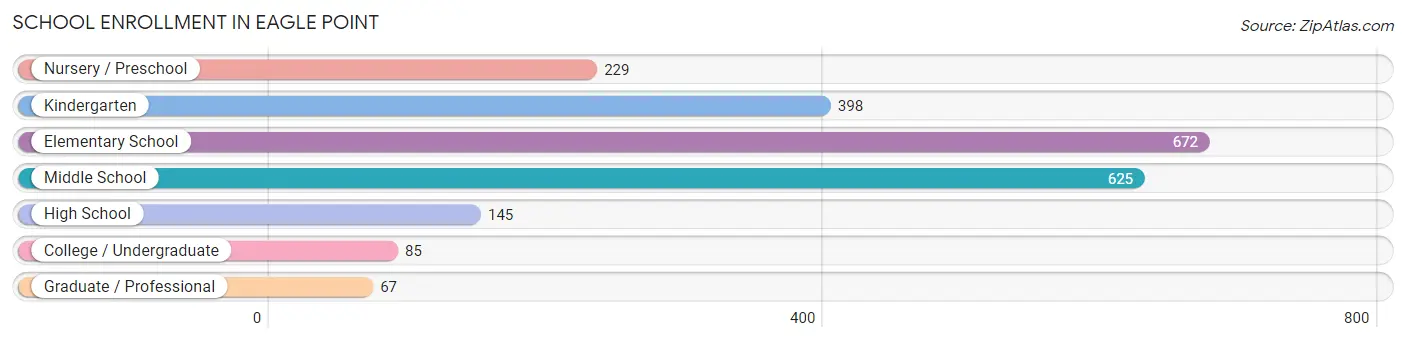
| School Level | # Students | % Students |
| Nursery / Preschool | 229 | 10.3% |
| Kindergarten | 398 | 17.9% |
| Elementary School | 672 | 30.3% |
| Middle School | 625 | 28.1% |
| High School | 145 | 6.5% |
| College / Undergraduate | 85 | 3.8% |
| Graduate / Professional | 67 | 3.0% |
| Total | 2,221 | 100.0% |
School Enrollment by Age by Funding Source in Eagle Point
Out of a total of 2,221 students who are enrolled in schools in Eagle Point, 369 (16.6%) attend a private institution, while the remaining 1,852 (83.4%) are enrolled in public schools. The age group of 3 to 4 year olds has the highest likelihood of being enrolled in private schools, with 161 (100.0% in the age bracket) enrolled. Conversely, the age group of 25 to 34 year olds has the lowest likelihood of being enrolled in a private school, with 40 (100.0% in the age bracket) attending a public institution.
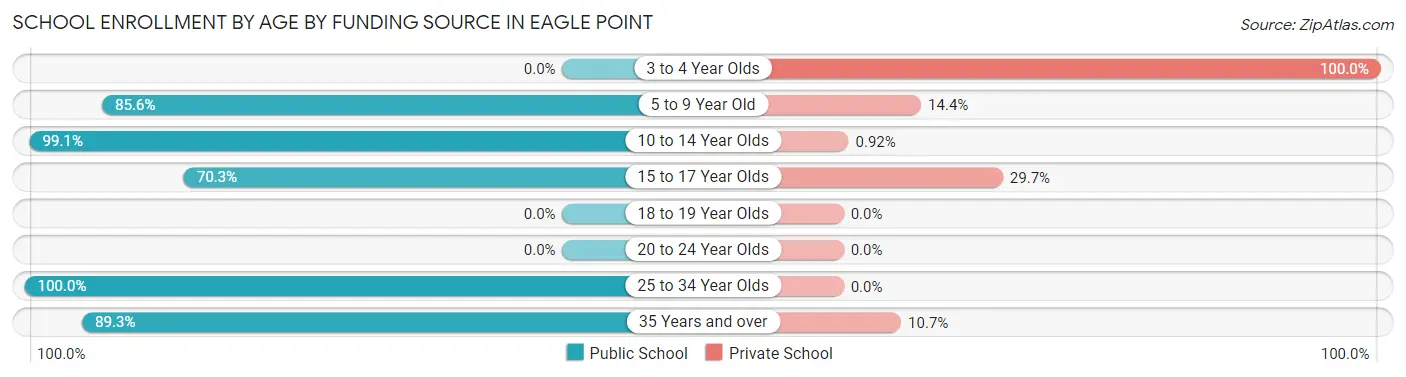
| Age Bracket | Public School | Private School |
| 3 to 4 Year Olds | 0 (0.0%) | 161 (100.0%) |
| 5 to 9 Year Old | 860 (85.6%) | 145 (14.4%) |
| 10 to 14 Year Olds | 751 (99.1%) | 7 (0.9%) |
| 15 to 17 Year Olds | 102 (70.3%) | 43 (29.7%) |
| 18 to 19 Year Olds | 0 (0.0%) | 0 (0.0%) |
| 20 to 24 Year Olds | 0 (0.0%) | 0 (0.0%) |
| 25 to 34 Year Olds | 40 (100.0%) | 0 (0.0%) |
| 35 Years and over | 100 (89.3%) | 12 (10.7%) |
| Total | 1,852 (83.4%) | 369 (16.6%) |
Educational Attainment by Field of Study in Eagle Point
Business (224 | 18.7%), social sciences (212 | 17.7%), education (176 | 14.7%), science & technology (162 | 13.6%), and liberal arts & history (89 | 7.4%) are the most common fields of study among 1,195 individuals in Eagle Point who have obtained a bachelor's degree or higher.
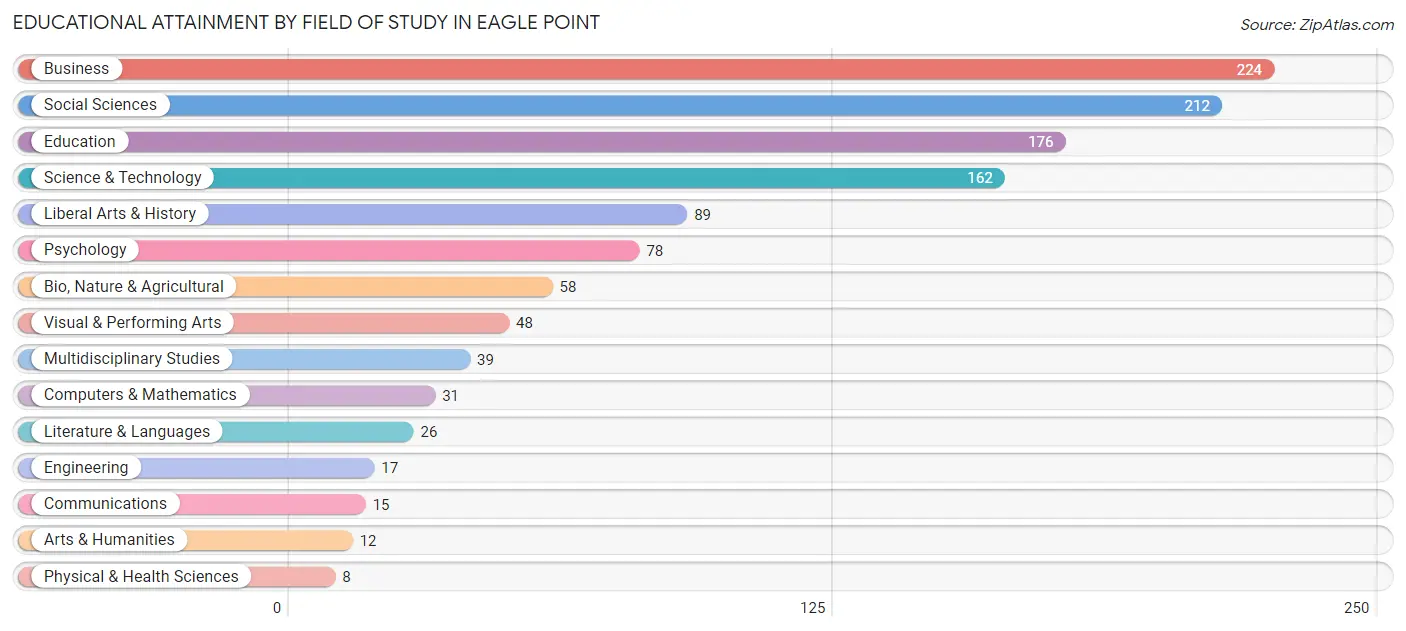
| Field of Study | # Graduates | % Graduates |
| Computers & Mathematics | 31 | 2.6% |
| Bio, Nature & Agricultural | 58 | 4.9% |
| Physical & Health Sciences | 8 | 0.7% |
| Psychology | 78 | 6.5% |
| Social Sciences | 212 | 17.7% |
| Engineering | 17 | 1.4% |
| Multidisciplinary Studies | 39 | 3.3% |
| Science & Technology | 162 | 13.6% |
| Business | 224 | 18.7% |
| Education | 176 | 14.7% |
| Literature & Languages | 26 | 2.2% |
| Liberal Arts & History | 89 | 7.4% |
| Visual & Performing Arts | 48 | 4.0% |
| Communications | 15 | 1.3% |
| Arts & Humanities | 12 | 1.0% |
| Total | 1,195 | 100.0% |
Transportation & Commute in Eagle Point
Vehicle Availability by Sex in Eagle Point
The most prevalent vehicle ownership categories in Eagle Point are males with 2 vehicles (688, accounting for 36.6%) and females with 2 vehicles (558, making up 33.9%).
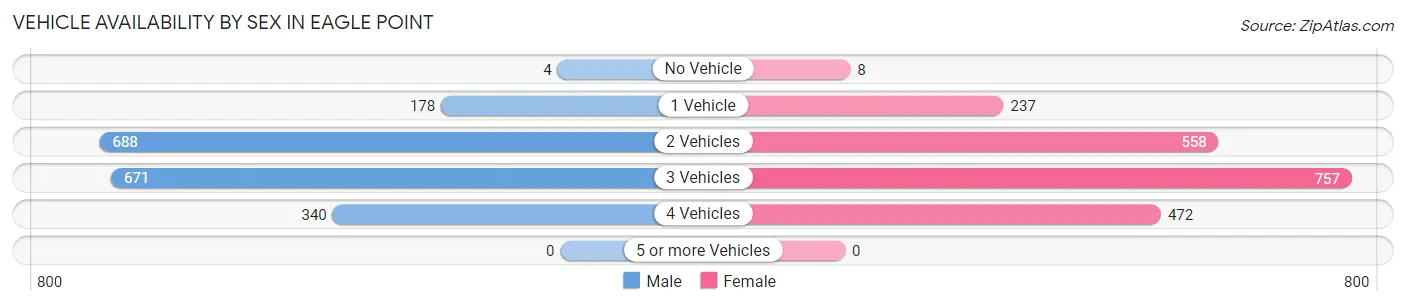
| Vehicles Available | Male | Female |
| No Vehicle | 4 (0.2%) | 8 (0.4%) |
| 1 Vehicle | 178 (9.5%) | 237 (11.7%) |
| 2 Vehicles | 688 (36.6%) | 558 (27.5%) |
| 3 Vehicles | 671 (35.7%) | 757 (37.2%) |
| 4 Vehicles | 340 (18.1%) | 472 (23.2%) |
| 5 or more Vehicles | 0 (0.0%) | 0 (0.0%) |
| Total | 1,881 (100.0%) | 2,032 (100.0%) |
Commute Time in Eagle Point
The most frequently occuring commute durations in Eagle Point are 20 to 24 minutes (953 commuters, 25.6%), 10 to 14 minutes (610 commuters, 16.4%), and 30 to 34 minutes (579 commuters, 15.5%).
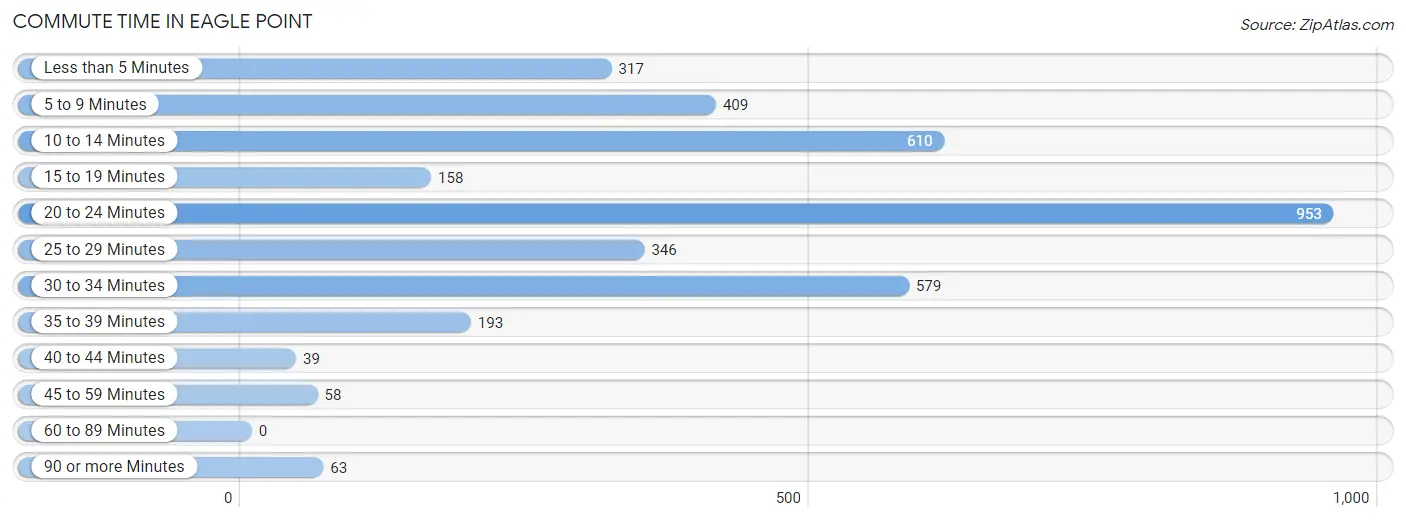
| Commute Time | # Commuters | % Commuters |
| Less than 5 Minutes | 317 | 8.5% |
| 5 to 9 Minutes | 409 | 11.0% |
| 10 to 14 Minutes | 610 | 16.4% |
| 15 to 19 Minutes | 158 | 4.2% |
| 20 to 24 Minutes | 953 | 25.6% |
| 25 to 29 Minutes | 346 | 9.3% |
| 30 to 34 Minutes | 579 | 15.5% |
| 35 to 39 Minutes | 193 | 5.2% |
| 40 to 44 Minutes | 39 | 1.1% |
| 45 to 59 Minutes | 58 | 1.6% |
| 60 to 89 Minutes | 0 | 0.0% |
| 90 or more Minutes | 63 | 1.7% |
Commute Time by Sex in Eagle Point
The most common commute times in Eagle Point are 10 to 14 minutes (488 commuters, 27.7%) for males and 20 to 24 minutes (480 commuters, 24.4%) for females.
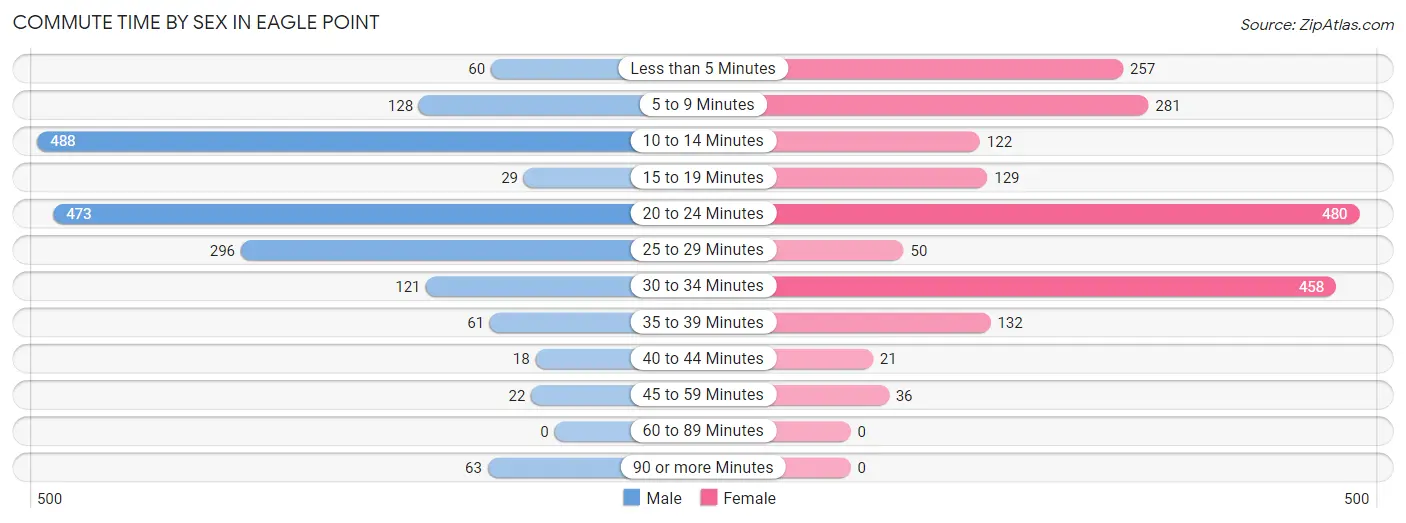
| Commute Time | Male | Female |
| Less than 5 Minutes | 60 (3.4%) | 257 (13.1%) |
| 5 to 9 Minutes | 128 (7.3%) | 281 (14.3%) |
| 10 to 14 Minutes | 488 (27.7%) | 122 (6.2%) |
| 15 to 19 Minutes | 29 (1.7%) | 129 (6.6%) |
| 20 to 24 Minutes | 473 (26.9%) | 480 (24.4%) |
| 25 to 29 Minutes | 296 (16.8%) | 50 (2.5%) |
| 30 to 34 Minutes | 121 (6.9%) | 458 (23.3%) |
| 35 to 39 Minutes | 61 (3.5%) | 132 (6.7%) |
| 40 to 44 Minutes | 18 (1.0%) | 21 (1.1%) |
| 45 to 59 Minutes | 22 (1.3%) | 36 (1.8%) |
| 60 to 89 Minutes | 0 (0.0%) | 0 (0.0%) |
| 90 or more Minutes | 63 (3.6%) | 0 (0.0%) |
Time of Departure to Work by Sex in Eagle Point
The most frequent times of departure to work in Eagle Point are 12:00 AM to 4:59 AM (651, 37.0%) for males and 7:30 AM to 7:59 AM (448, 22.8%) for females.
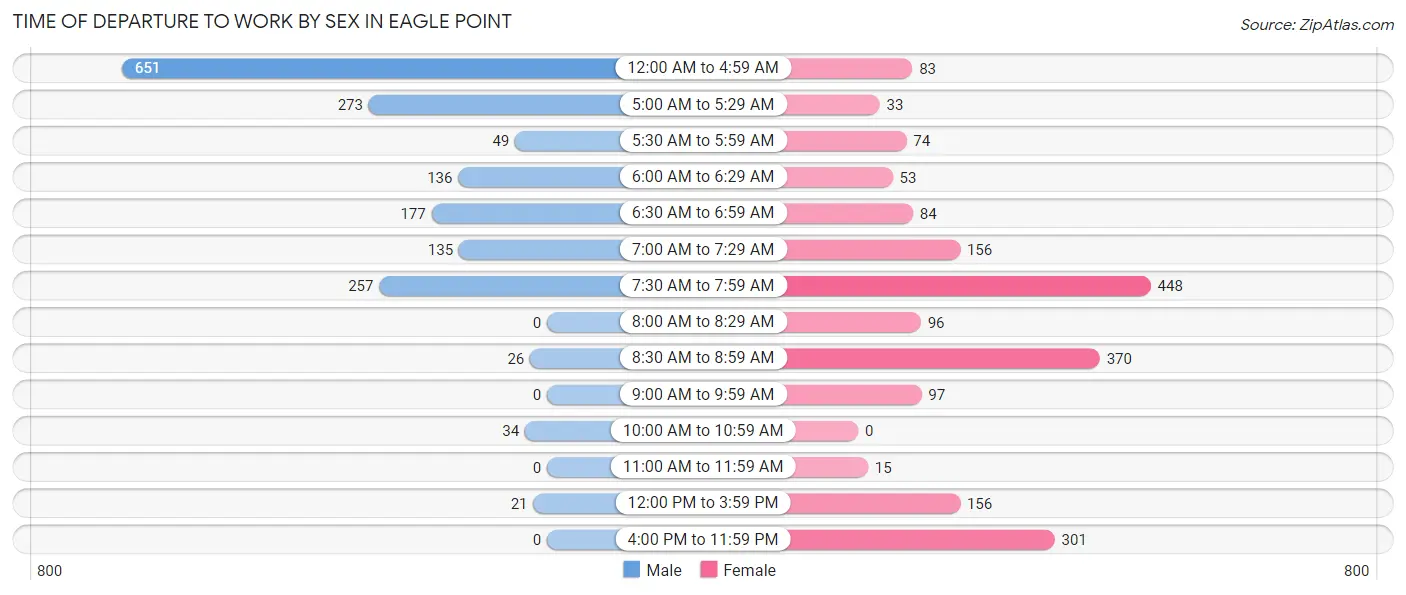
| Time of Departure | Male | Female |
| 12:00 AM to 4:59 AM | 651 (37.0%) | 83 (4.2%) |
| 5:00 AM to 5:29 AM | 273 (15.5%) | 33 (1.7%) |
| 5:30 AM to 5:59 AM | 49 (2.8%) | 74 (3.8%) |
| 6:00 AM to 6:29 AM | 136 (7.7%) | 53 (2.7%) |
| 6:30 AM to 6:59 AM | 177 (10.1%) | 84 (4.3%) |
| 7:00 AM to 7:29 AM | 135 (7.7%) | 156 (7.9%) |
| 7:30 AM to 7:59 AM | 257 (14.6%) | 448 (22.8%) |
| 8:00 AM to 8:29 AM | 0 (0.0%) | 96 (4.9%) |
| 8:30 AM to 8:59 AM | 26 (1.5%) | 370 (18.8%) |
| 9:00 AM to 9:59 AM | 0 (0.0%) | 97 (4.9%) |
| 10:00 AM to 10:59 AM | 34 (1.9%) | 0 (0.0%) |
| 11:00 AM to 11:59 AM | 0 (0.0%) | 15 (0.8%) |
| 12:00 PM to 3:59 PM | 21 (1.2%) | 156 (7.9%) |
| 4:00 PM to 11:59 PM | 0 (0.0%) | 301 (15.3%) |
| Total | 1,759 (100.0%) | 1,966 (100.0%) |
Housing Occupancy in Eagle Point
Occupancy by Ownership in Eagle Point
Of the total 3,535 dwellings in Eagle Point, owner-occupied units account for 2,509 (71.0%), while renter-occupied units make up 1,026 (29.0%).
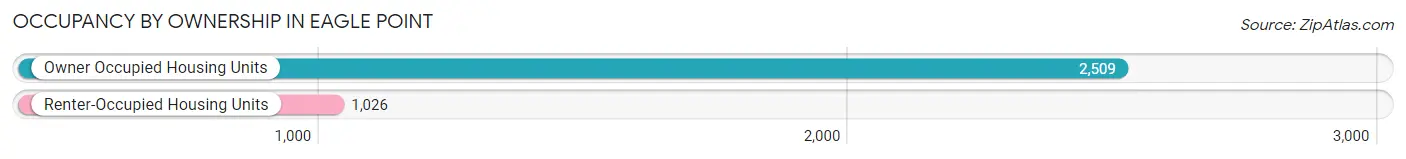
| Occupancy | # Housing Units | % Housing Units |
| Owner Occupied Housing Units | 2,509 | 71.0% |
| Renter-Occupied Housing Units | 1,026 | 29.0% |
| Total Occupied Housing Units | 3,535 | 100.0% |
Occupancy by Household Size in Eagle Point
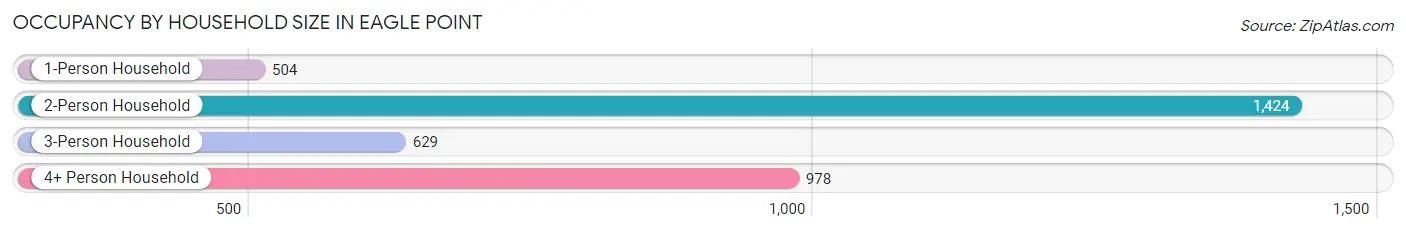
| Household Size | # Housing Units | % Housing Units |
| 1-Person Household | 504 | 14.3% |
| 2-Person Household | 1,424 | 40.3% |
| 3-Person Household | 629 | 17.8% |
| 4+ Person Household | 978 | 27.7% |
| Total Housing Units | 3,535 | 100.0% |
Occupancy by Ownership by Household Size in Eagle Point
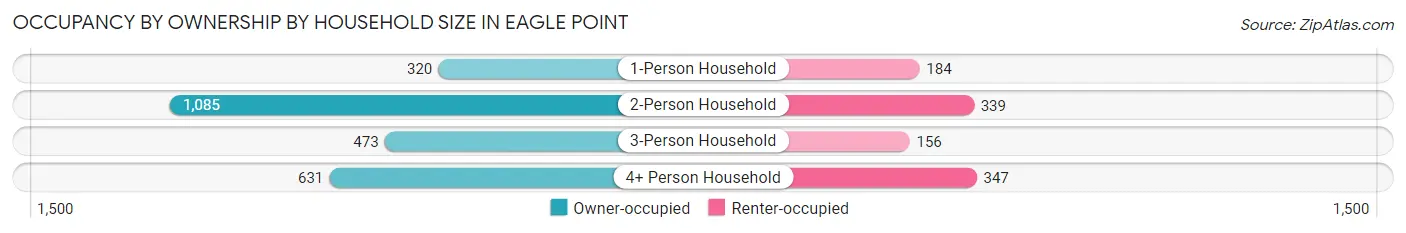
| Household Size | Owner-occupied | Renter-occupied |
| 1-Person Household | 320 (63.5%) | 184 (36.5%) |
| 2-Person Household | 1,085 (76.2%) | 339 (23.8%) |
| 3-Person Household | 473 (75.2%) | 156 (24.8%) |
| 4+ Person Household | 631 (64.5%) | 347 (35.5%) |
| Total Housing Units | 2,509 (71.0%) | 1,026 (29.0%) |
Occupancy by Educational Attainment in Eagle Point
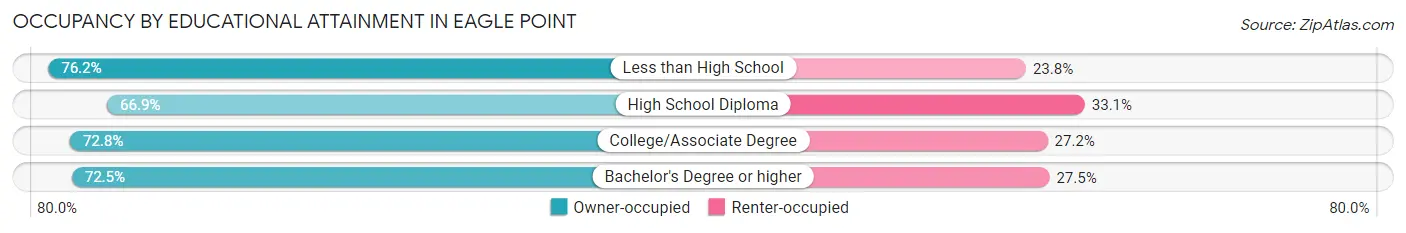
| Household Size | Owner-occupied | Renter-occupied |
| Less than High School | 138 (76.2%) | 43 (23.8%) |
| High School Diploma | 780 (66.9%) | 386 (33.1%) |
| College/Associate Degree | 1,132 (72.8%) | 423 (27.2%) |
| Bachelor's Degree or higher | 459 (72.5%) | 174 (27.5%) |
Occupancy by Age of Householder in Eagle Point
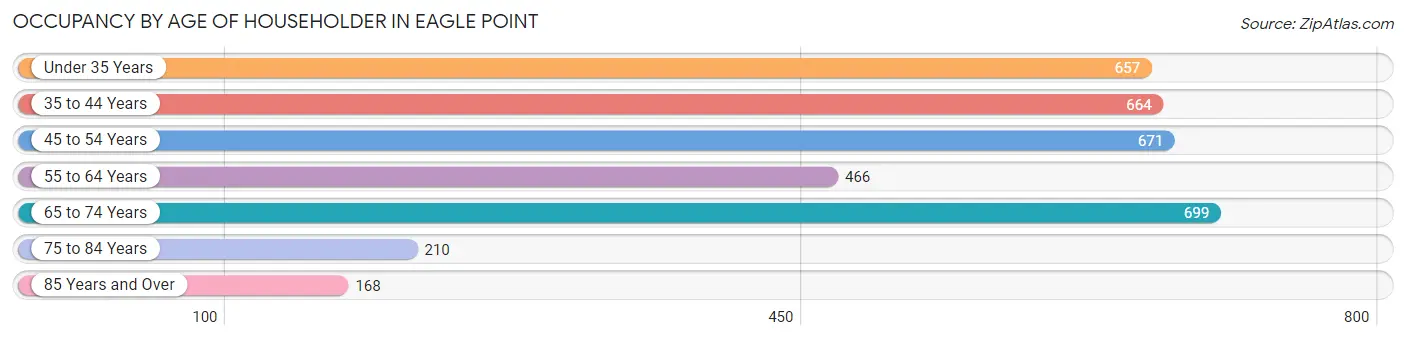
| Age Bracket | # Households | % Households |
| Under 35 Years | 657 | 18.6% |
| 35 to 44 Years | 664 | 18.8% |
| 45 to 54 Years | 671 | 19.0% |
| 55 to 64 Years | 466 | 13.2% |
| 65 to 74 Years | 699 | 19.8% |
| 75 to 84 Years | 210 | 5.9% |
| 85 Years and Over | 168 | 4.8% |
| Total | 3,535 | 100.0% |
Housing Finances in Eagle Point
Median Income by Occupancy in Eagle Point
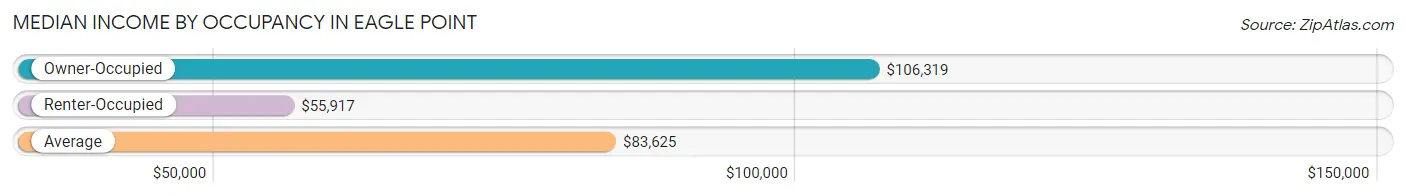
| Occupancy Type | # Households | Median Income |
| Owner-Occupied | 2,509 (71.0%) | $106,319 |
| Renter-Occupied | 1,026 (29.0%) | $55,917 |
| Average | 3,535 (100.0%) | $83,625 |
Occupancy by Householder Income Bracket in Eagle Point
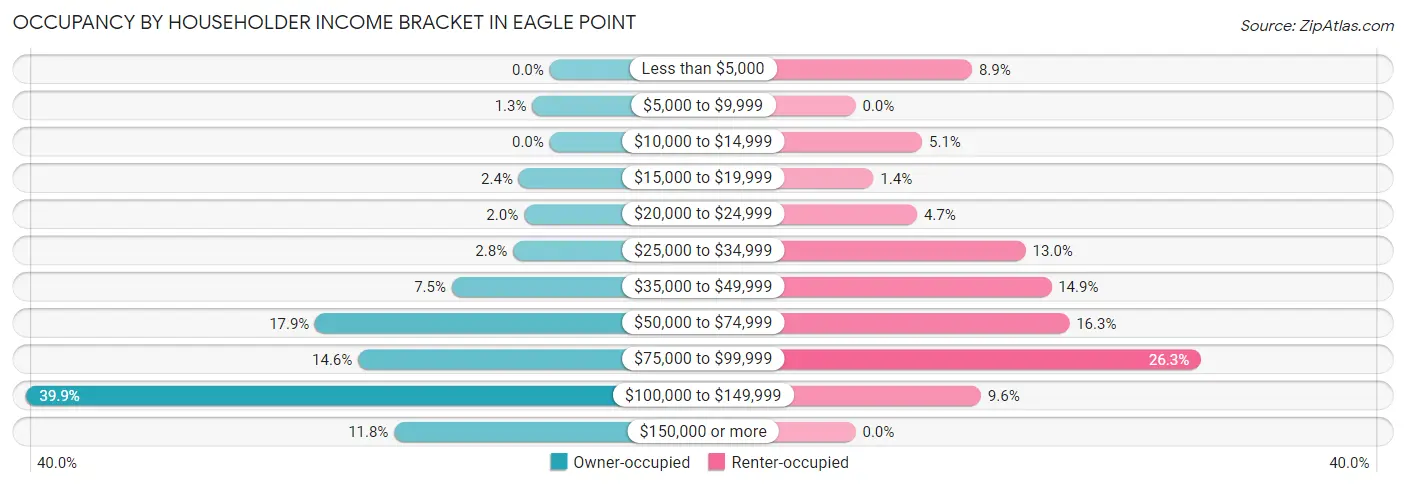
| Income Bracket | Owner-occupied | Renter-occupied |
| Less than $5,000 | 0 (0.0%) | 91 (8.9%) |
| $5,000 to $9,999 | 33 (1.3%) | 0 (0.0%) |
| $10,000 to $14,999 | 0 (0.0%) | 52 (5.1%) |
| $15,000 to $19,999 | 59 (2.4%) | 14 (1.4%) |
| $20,000 to $24,999 | 49 (1.9%) | 48 (4.7%) |
| $25,000 to $34,999 | 70 (2.8%) | 133 (13.0%) |
| $35,000 to $49,999 | 187 (7.4%) | 153 (14.9%) |
| $50,000 to $74,999 | 448 (17.9%) | 167 (16.3%) |
| $75,000 to $99,999 | 366 (14.6%) | 270 (26.3%) |
| $100,000 to $149,999 | 1,000 (39.9%) | 98 (9.6%) |
| $150,000 or more | 297 (11.8%) | 0 (0.0%) |
| Total | 2,509 (100.0%) | 1,026 (100.0%) |
Monthly Housing Cost Tiers in Eagle Point
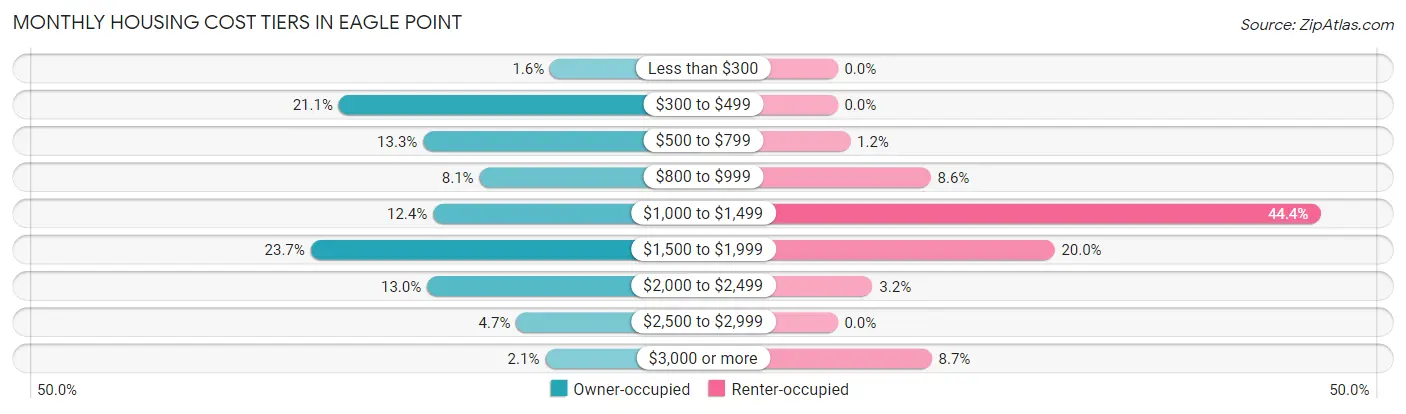
| Monthly Cost | Owner-occupied | Renter-occupied |
| Less than $300 | 41 (1.6%) | 0 (0.0%) |
| $300 to $499 | 529 (21.1%) | 0 (0.0%) |
| $500 to $799 | 334 (13.3%) | 12 (1.2%) |
| $800 to $999 | 204 (8.1%) | 88 (8.6%) |
| $1,000 to $1,499 | 311 (12.4%) | 456 (44.4%) |
| $1,500 to $1,999 | 594 (23.7%) | 205 (20.0%) |
| $2,000 to $2,499 | 325 (13.0%) | 33 (3.2%) |
| $2,500 to $2,999 | 119 (4.7%) | 0 (0.0%) |
| $3,000 or more | 52 (2.1%) | 89 (8.7%) |
| Total | 2,509 (100.0%) | 1,026 (100.0%) |
Physical Housing Characteristics in Eagle Point
Housing Structures in Eagle Point
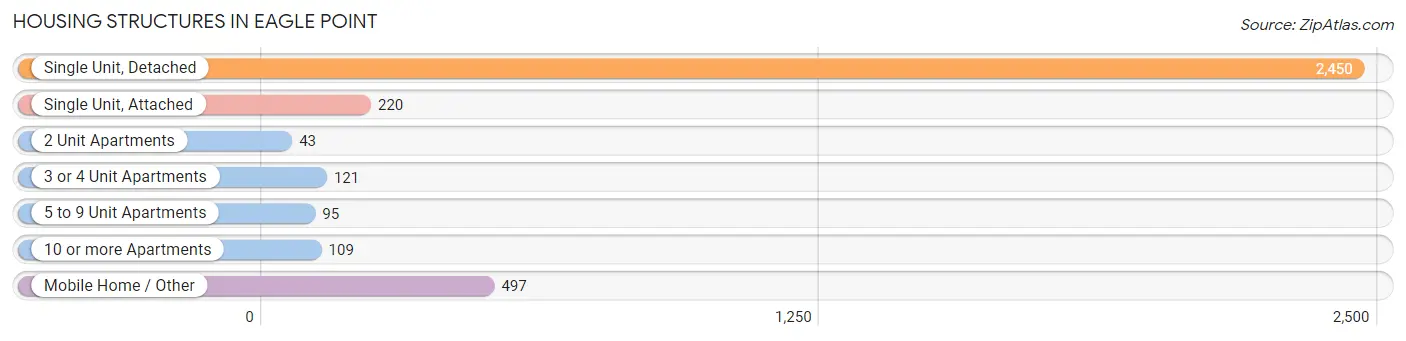
| Structure Type | # Housing Units | % Housing Units |
| Single Unit, Detached | 2,450 | 69.3% |
| Single Unit, Attached | 220 | 6.2% |
| 2 Unit Apartments | 43 | 1.2% |
| 3 or 4 Unit Apartments | 121 | 3.4% |
| 5 to 9 Unit Apartments | 95 | 2.7% |
| 10 or more Apartments | 109 | 3.1% |
| Mobile Home / Other | 497 | 14.1% |
| Total | 3,535 | 100.0% |
Housing Structures by Occupancy in Eagle Point
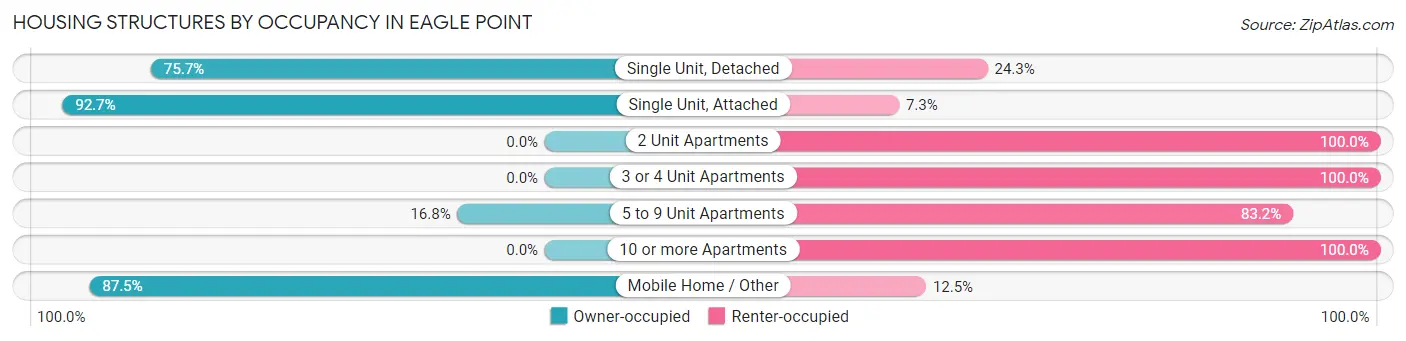
| Structure Type | Owner-occupied | Renter-occupied |
| Single Unit, Detached | 1,854 (75.7%) | 596 (24.3%) |
| Single Unit, Attached | 204 (92.7%) | 16 (7.3%) |
| 2 Unit Apartments | 0 (0.0%) | 43 (100.0%) |
| 3 or 4 Unit Apartments | 0 (0.0%) | 121 (100.0%) |
| 5 to 9 Unit Apartments | 16 (16.8%) | 79 (83.2%) |
| 10 or more Apartments | 0 (0.0%) | 109 (100.0%) |
| Mobile Home / Other | 435 (87.5%) | 62 (12.5%) |
| Total | 2,509 (71.0%) | 1,026 (29.0%) |
Housing Structures by Number of Rooms in Eagle Point
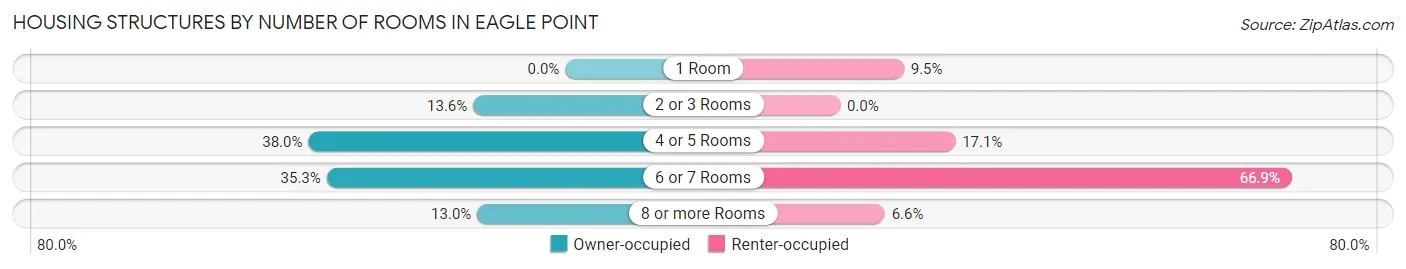
| Number of Rooms | Owner-occupied | Renter-occupied |
| 1 Room | 0 (0.0%) | 97 (9.5%) |
| 2 or 3 Rooms | 342 (13.6%) | 0 (0.0%) |
| 4 or 5 Rooms | 954 (38.0%) | 175 (17.1%) |
| 6 or 7 Rooms | 886 (35.3%) | 686 (66.9%) |
| 8 or more Rooms | 327 (13.0%) | 68 (6.6%) |
| Total | 2,509 (100.0%) | 1,026 (100.0%) |
Housing Structure by Heating Type in Eagle Point
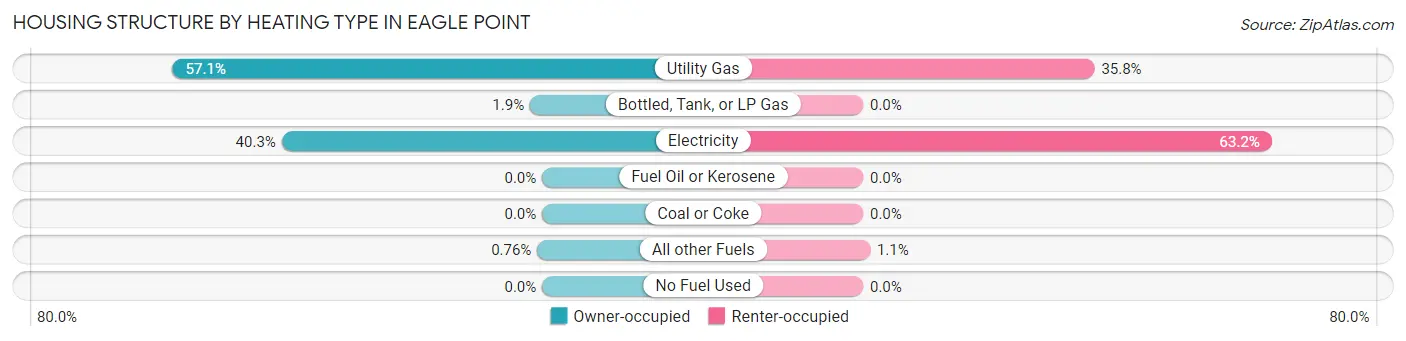
| Heating Type | Owner-occupied | Renter-occupied |
| Utility Gas | 1,433 (57.1%) | 367 (35.8%) |
| Bottled, Tank, or LP Gas | 47 (1.9%) | 0 (0.0%) |
| Electricity | 1,010 (40.3%) | 648 (63.2%) |
| Fuel Oil or Kerosene | 0 (0.0%) | 0 (0.0%) |
| Coal or Coke | 0 (0.0%) | 0 (0.0%) |
| All other Fuels | 19 (0.8%) | 11 (1.1%) |
| No Fuel Used | 0 (0.0%) | 0 (0.0%) |
| Total | 2,509 (100.0%) | 1,026 (100.0%) |
Household Vehicle Usage in Eagle Point
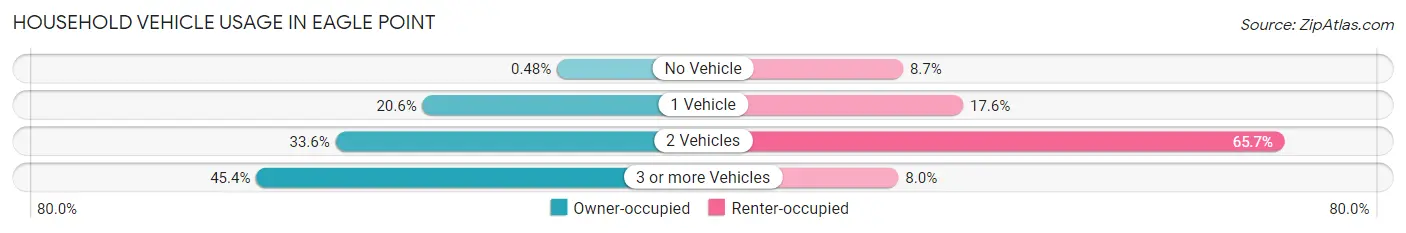
| Vehicles per Household | Owner-occupied | Renter-occupied |
| No Vehicle | 12 (0.5%) | 89 (8.7%) |
| 1 Vehicle | 516 (20.6%) | 181 (17.6%) |
| 2 Vehicles | 842 (33.6%) | 674 (65.7%) |
| 3 or more Vehicles | 1,139 (45.4%) | 82 (8.0%) |
| Total | 2,509 (100.0%) | 1,026 (100.0%) |
Real Estate & Mortgages in Eagle Point
Real Estate and Mortgage Overview in Eagle Point
| Characteristic | Without Mortgage | With Mortgage |
| Housing Units | 1,067 | 1,442 |
| Median Property Value | $348,500 | $362,900 |
| Median Household Income | $87,363 | $239 |
| Monthly Housing Costs | $491 | $52 |
| Real Estate Taxes | $2,332 | $22 |
Property Value by Mortgage Status in Eagle Point
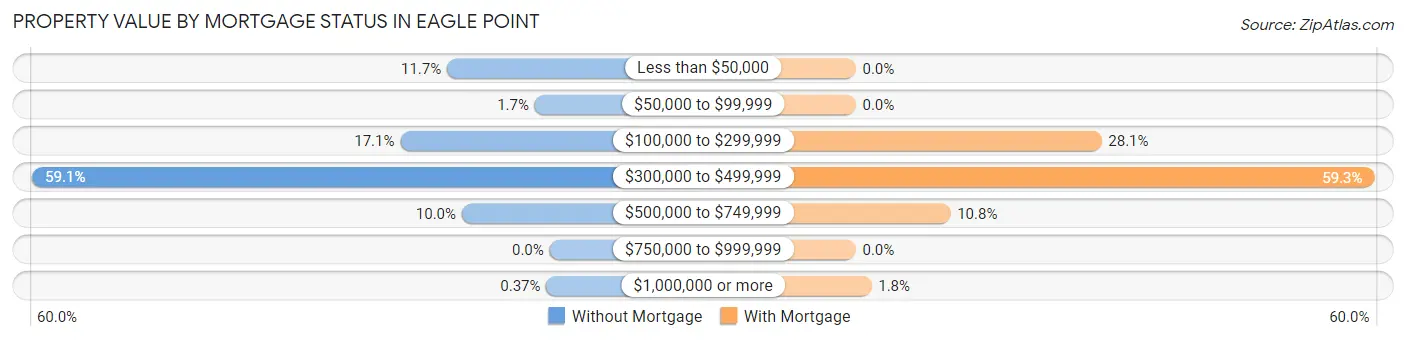
| Property Value | Without Mortgage | With Mortgage |
| Less than $50,000 | 125 (11.7%) | 0 (0.0%) |
| $50,000 to $99,999 | 18 (1.7%) | 0 (0.0%) |
| $100,000 to $299,999 | 182 (17.1%) | 405 (28.1%) |
| $300,000 to $499,999 | 631 (59.1%) | 855 (59.3%) |
| $500,000 to $749,999 | 107 (10.0%) | 156 (10.8%) |
| $750,000 to $999,999 | 0 (0.0%) | 0 (0.0%) |
| $1,000,000 or more | 4 (0.4%) | 26 (1.8%) |
| Total | 1,067 (100.0%) | 1,442 (100.0%) |
Household Income by Mortgage Status in Eagle Point
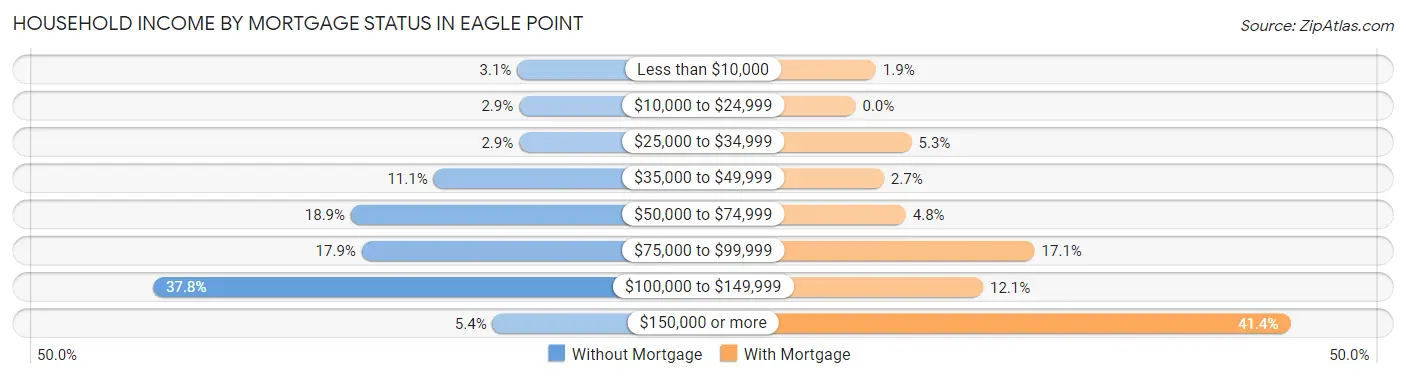
| Household Income | Without Mortgage | With Mortgage |
| Less than $10,000 | 33 (3.1%) | 28 (1.9%) |
| $10,000 to $24,999 | 31 (2.9%) | 0 (0.0%) |
| $25,000 to $34,999 | 31 (2.9%) | 77 (5.3%) |
| $35,000 to $49,999 | 118 (11.1%) | 39 (2.7%) |
| $50,000 to $74,999 | 202 (18.9%) | 69 (4.8%) |
| $75,000 to $99,999 | 191 (17.9%) | 246 (17.1%) |
| $100,000 to $149,999 | 403 (37.8%) | 175 (12.1%) |
| $150,000 or more | 58 (5.4%) | 597 (41.4%) |
| Total | 1,067 (100.0%) | 1,442 (100.0%) |
Property Value to Household Income Ratio in Eagle Point
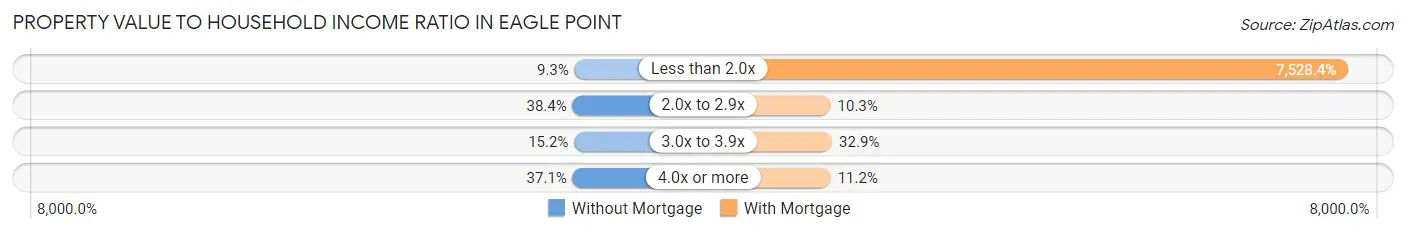
| Value-to-Income Ratio | Without Mortgage | With Mortgage |
| Less than 2.0x | 99 (9.3%) | 108,560 (7,528.4%) |
| 2.0x to 2.9x | 410 (38.4%) | 148 (10.3%) |
| 3.0x to 3.9x | 162 (15.2%) | 474 (32.9%) |
| 4.0x or more | 396 (37.1%) | 161 (11.2%) |
| Total | 1,067 (100.0%) | 1,442 (100.0%) |
Real Estate Taxes by Mortgage Status in Eagle Point
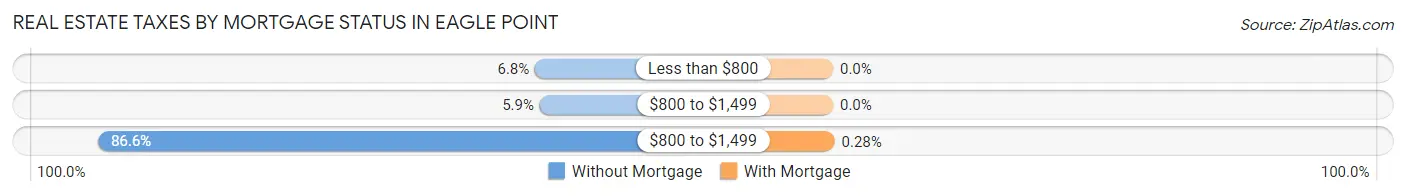
| Property Taxes | Without Mortgage | With Mortgage |
| Less than $800 | 72 (6.8%) | 0 (0.0%) |
| $800 to $1,499 | 63 (5.9%) | 0 (0.0%) |
| $800 to $1,499 | 924 (86.6%) | 4 (0.3%) |
| Total | 1,067 (100.0%) | 1,442 (100.0%) |
Health & Disability in Eagle Point
Health Insurance Coverage by Age in Eagle Point
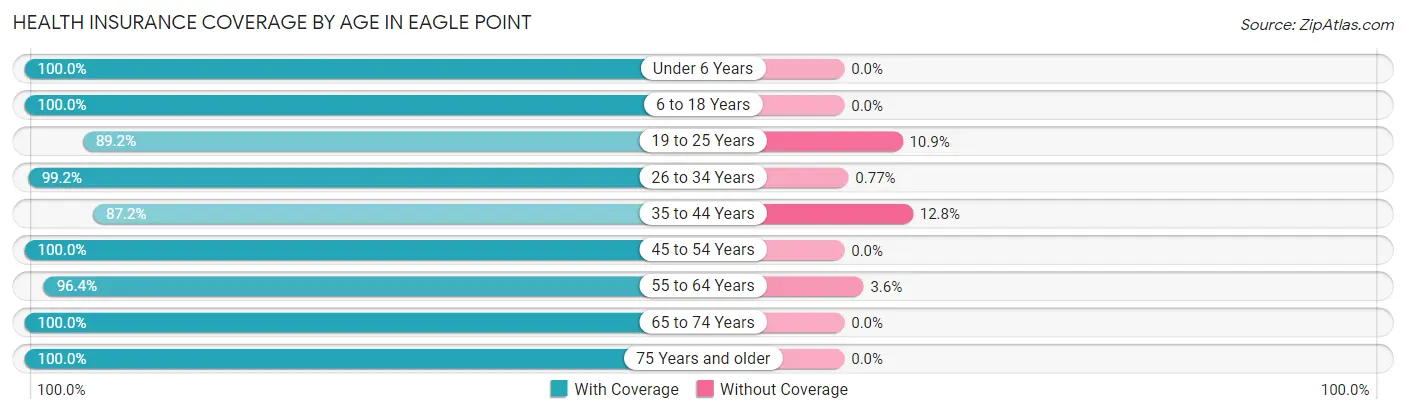
| Age Bracket | With Coverage | Without Coverage |
| Under 6 Years | 1,168 (100.0%) | 0 (0.0%) |
| 6 to 18 Years | 1,677 (100.0%) | 0 (0.0%) |
| 19 to 25 Years | 386 (89.1%) | 47 (10.8%) |
| 26 to 34 Years | 1,419 (99.2%) | 11 (0.8%) |
| 35 to 44 Years | 984 (87.2%) | 144 (12.8%) |
| 45 to 54 Years | 1,285 (100.0%) | 0 (0.0%) |
| 55 to 64 Years | 864 (96.4%) | 32 (3.6%) |
| 65 to 74 Years | 1,116 (100.0%) | 0 (0.0%) |
| 75 Years and older | 602 (100.0%) | 0 (0.0%) |
| Total | 9,501 (97.6%) | 234 (2.4%) |
Health Insurance Coverage by Citizenship Status in Eagle Point
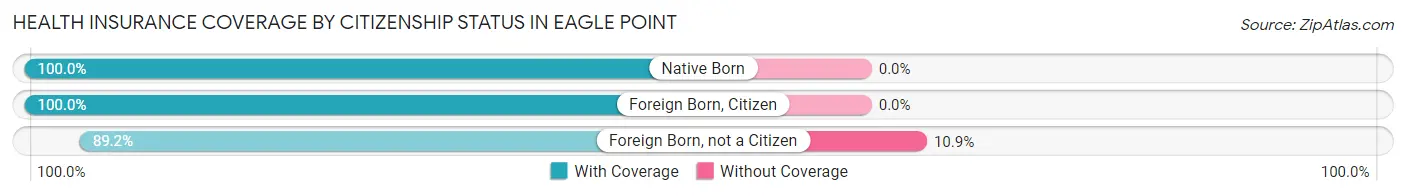
| Citizenship Status | With Coverage | Without Coverage |
| Native Born | 1,168 (100.0%) | 0 (0.0%) |
| Foreign Born, Citizen | 1,677 (100.0%) | 0 (0.0%) |
| Foreign Born, not a Citizen | 386 (89.1%) | 47 (10.8%) |
Health Insurance Coverage by Household Income in Eagle Point
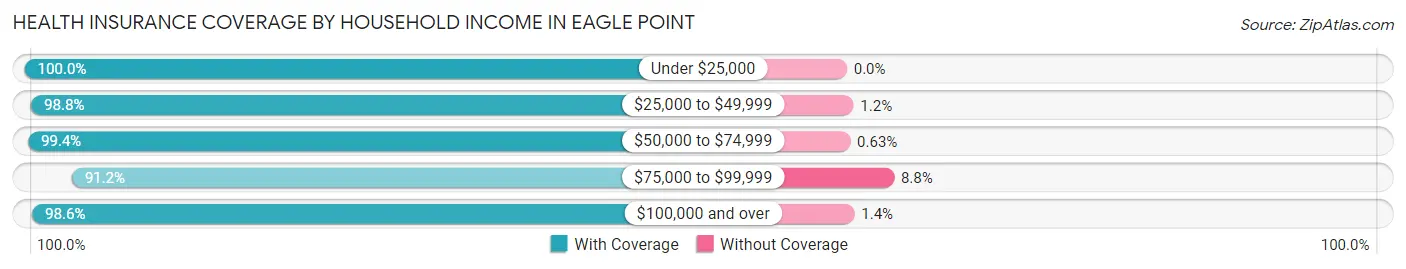
| Household Income | With Coverage | Without Coverage |
| Under $25,000 | 628 (100.0%) | 0 (0.0%) |
| $25,000 to $49,999 | 1,352 (98.8%) | 17 (1.2%) |
| $50,000 to $74,999 | 1,728 (99.4%) | 11 (0.6%) |
| $75,000 to $99,999 | 1,487 (91.2%) | 144 (8.8%) |
| $100,000 and over | 4,299 (98.6%) | 62 (1.4%) |
Public vs Private Health Insurance Coverage by Age in Eagle Point
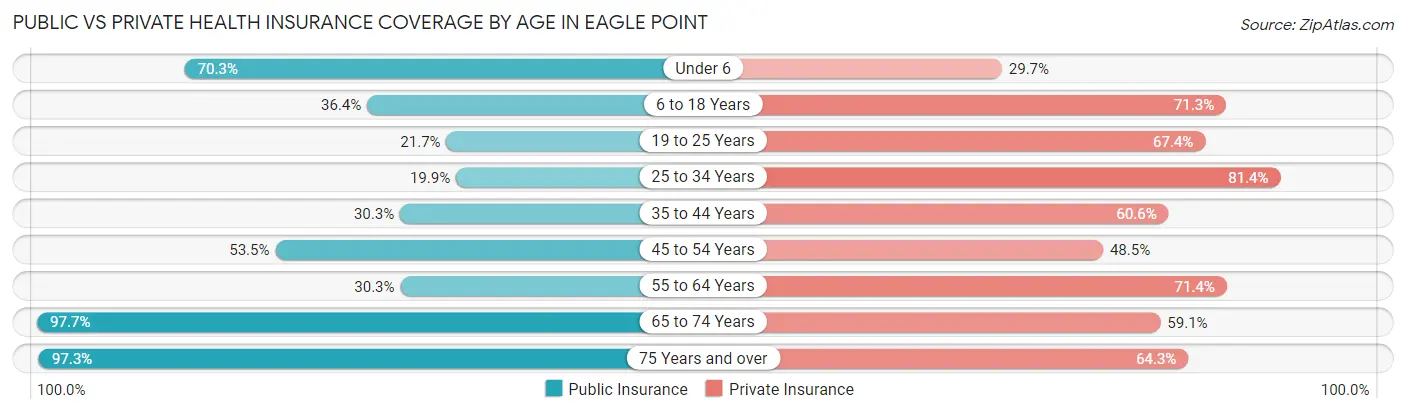
| Age Bracket | Public Insurance | Private Insurance |
| Under 6 | 821 (70.3%) | 347 (29.7%) |
| 6 to 18 Years | 611 (36.4%) | 1,196 (71.3%) |
| 19 to 25 Years | 94 (21.7%) | 292 (67.4%) |
| 25 to 34 Years | 285 (19.9%) | 1,164 (81.4%) |
| 35 to 44 Years | 342 (30.3%) | 684 (60.6%) |
| 45 to 54 Years | 687 (53.5%) | 623 (48.5%) |
| 55 to 64 Years | 271 (30.2%) | 640 (71.4%) |
| 65 to 74 Years | 1,090 (97.7%) | 660 (59.1%) |
| 75 Years and over | 586 (97.3%) | 387 (64.3%) |
| Total | 4,787 (49.2%) | 5,993 (61.6%) |
Disability Status by Sex by Age in Eagle Point
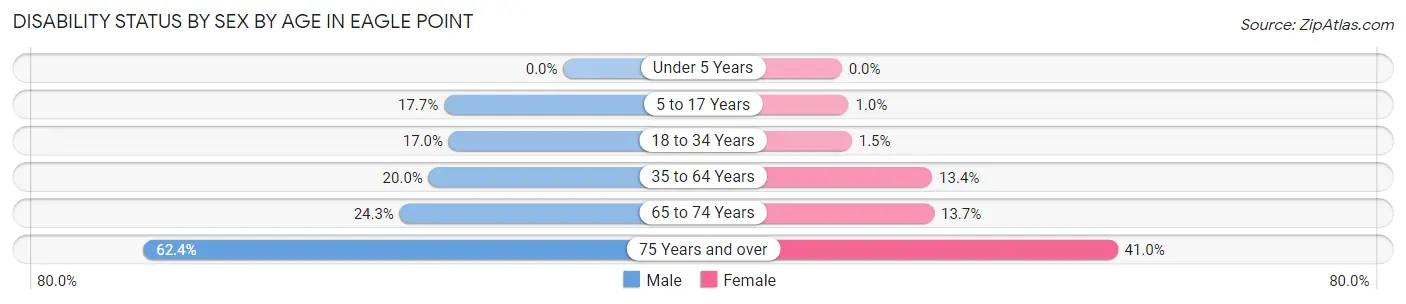
| Age Bracket | Male | Female |
| Under 5 Years | 0 (0.0%) | 0 (0.0%) |
| 5 to 17 Years | 178 (17.7%) | 9 (1.0%) |
| 18 to 34 Years | 144 (17.0%) | 15 (1.5%) |
| 35 to 64 Years | 340 (20.0%) | 216 (13.4%) |
| 65 to 74 Years | 147 (24.3%) | 70 (13.7%) |
| 75 Years and over | 179 (62.4%) | 129 (40.9%) |
Disability Class by Sex by Age in Eagle Point
Disability Class: Hearing Difficulty
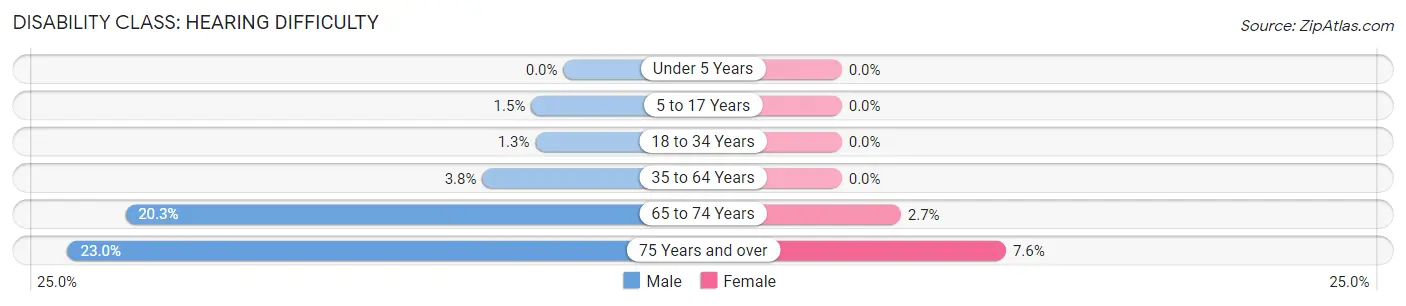
| Age Bracket | Male | Female |
| Under 5 Years | 0 (0.0%) | 0 (0.0%) |
| 5 to 17 Years | 15 (1.5%) | 0 (0.0%) |
| 18 to 34 Years | 11 (1.3%) | 0 (0.0%) |
| 35 to 64 Years | 64 (3.8%) | 0 (0.0%) |
| 65 to 74 Years | 123 (20.3%) | 14 (2.7%) |
| 75 Years and over | 66 (23.0%) | 24 (7.6%) |
Disability Class: Vision Difficulty
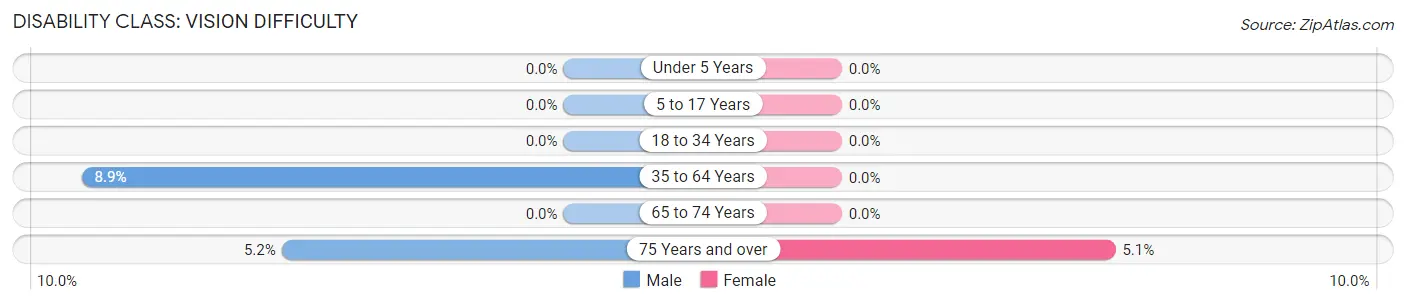
| Age Bracket | Male | Female |
| Under 5 Years | 0 (0.0%) | 0 (0.0%) |
| 5 to 17 Years | 0 (0.0%) | 0 (0.0%) |
| 18 to 34 Years | 0 (0.0%) | 0 (0.0%) |
| 35 to 64 Years | 152 (8.9%) | 0 (0.0%) |
| 65 to 74 Years | 0 (0.0%) | 0 (0.0%) |
| 75 Years and over | 15 (5.2%) | 16 (5.1%) |
Disability Class: Cognitive Difficulty
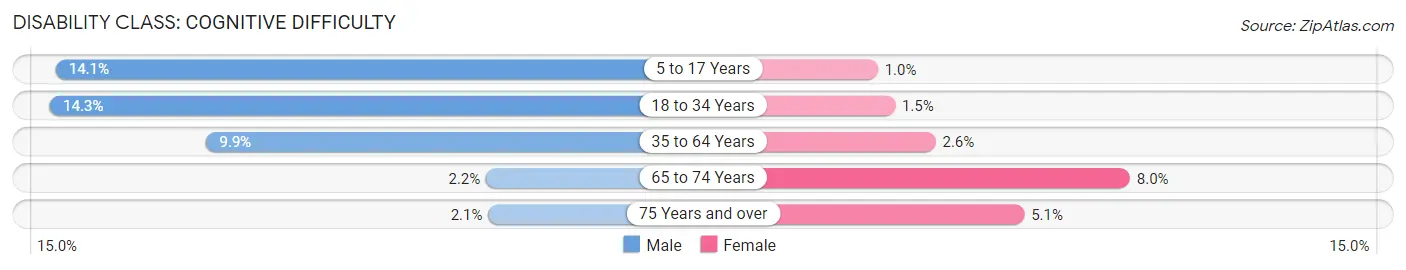
| Age Bracket | Male | Female |
| 5 to 17 Years | 142 (14.1%) | 9 (1.0%) |
| 18 to 34 Years | 121 (14.3%) | 15 (1.5%) |
| 35 to 64 Years | 169 (9.9%) | 42 (2.6%) |
| 65 to 74 Years | 13 (2.1%) | 41 (8.0%) |
| 75 Years and over | 6 (2.1%) | 16 (5.1%) |
Disability Class: Ambulatory Difficulty
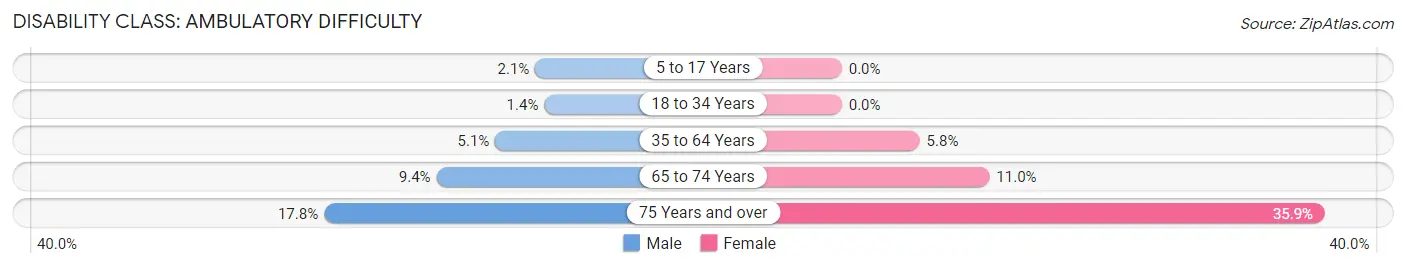
| Age Bracket | Male | Female |
| 5 to 17 Years | 21 (2.1%) | 0 (0.0%) |
| 18 to 34 Years | 12 (1.4%) | 0 (0.0%) |
| 35 to 64 Years | 86 (5.1%) | 93 (5.8%) |
| 65 to 74 Years | 57 (9.4%) | 56 (11.0%) |
| 75 Years and over | 51 (17.8%) | 113 (35.9%) |
Disability Class: Self-Care Difficulty
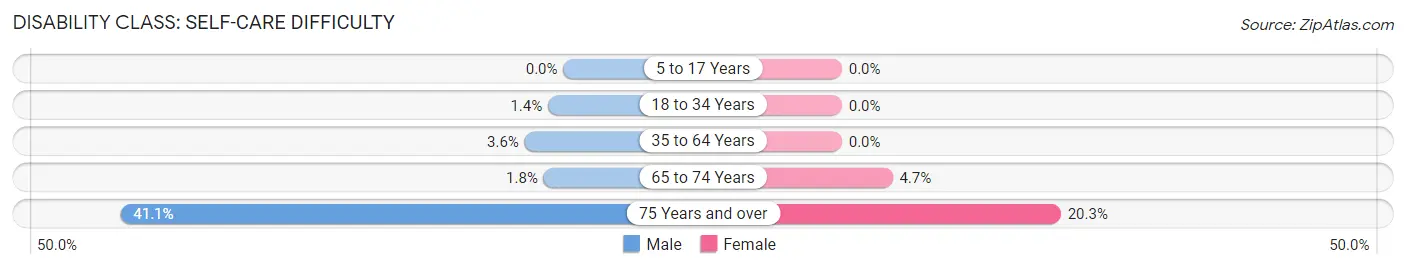
| Age Bracket | Male | Female |
| 5 to 17 Years | 0 (0.0%) | 0 (0.0%) |
| 18 to 34 Years | 12 (1.4%) | 0 (0.0%) |
| 35 to 64 Years | 61 (3.6%) | 0 (0.0%) |
| 65 to 74 Years | 11 (1.8%) | 24 (4.7%) |
| 75 Years and over | 118 (41.1%) | 64 (20.3%) |
Technology Access in Eagle Point
Computing Device Access in Eagle Point
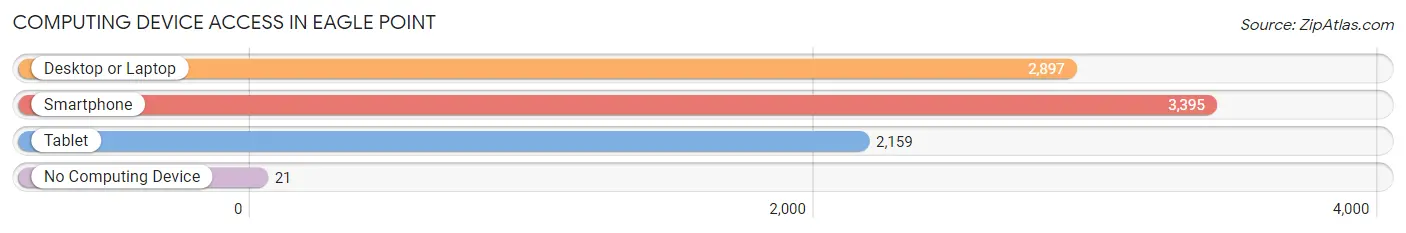
| Device Type | # Households | % Households |
| Desktop or Laptop | 2,897 | 82.0% |
| Smartphone | 3,395 | 96.0% |
| Tablet | 2,159 | 61.1% |
| No Computing Device | 21 | 0.6% |
| Total | 3,535 | 100.0% |
Internet Access in Eagle Point
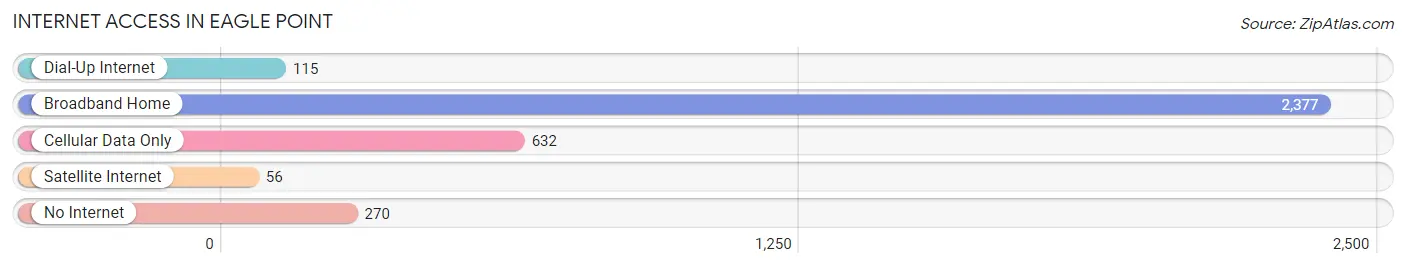
| Internet Type | # Households | % Households |
| Dial-Up Internet | 115 | 3.3% |
| Broadband Home | 2,377 | 67.2% |
| Cellular Data Only | 632 | 17.9% |
| Satellite Internet | 56 | 1.6% |
| No Internet | 270 | 7.6% |
| Total | 3,535 | 100.0% |
Eagle Point Summary
Eagle Point is a city located in Jackson County, Oregon, United States. It is situated in the foothills of the Cascade Mountains, approximately 15 miles northeast of Medford. The city is part of the Rogue Valley Metropolitan Statistical Area and has a population of 8,469 as of the 2010 census.
History
The area that is now Eagle Point was originally inhabited by the Takelma Native Americans. The first non-native settlers arrived in the area in the 1850s, and the city was officially incorporated in 1911. The city was named after a nearby mountain peak, which was named by early settlers for its resemblance to an eagle in flight.
Geography
Eagle Point is located at 42°25'25" North, 122°51'45" West (42.423, -122.862). It is situated in the foothills of the Cascade Mountains, approximately 15 miles northeast of Medford. The city has a total area of 4.2 square miles, all of which is land.
Climate
Eagle Point has a Mediterranean climate, with hot, dry summers and mild, wet winters. The average annual temperature is 54°F, with an average high of 79°F in July and an average low of 30°F in January. The average annual precipitation is 28.5 inches, with an average of 4.5 inches of snowfall per year.
Economy
The economy of Eagle Point is largely based on agriculture and tourism. The city is home to several wineries, as well as a number of farms and ranches. The city is also home to several businesses, including a lumber mill, a furniture factory, and a number of retail stores.
Demographics
As of the 2010 census, there were 8,469 people, 3,093 households, and 2,092 families residing in the city. The population density was 2,019.3 people per square mile. The racial makeup of the city was 87.2% White, 0.7% African American, 1.2% Native American, 0.9% Asian, 0.1% Pacific Islander, 7.2% from other races, and 2.7% from two or more races. Hispanic or Latino of any race were 13.2% of the population.
The median income for a household in the city was $41,944, and the median income for a family was $50,919. The per capita income for the city was $20,845. About 11.2% of families and 14.3% of the population were below the poverty line, including 19.2% of those under age 18 and 8.2% of those age 65 or over.
Conclusion
Eagle Point is a city located in Jackson County, Oregon, United States. It is situated in the foothills of the Cascade Mountains, approximately 15 miles northeast of Medford. The city is part of the Rogue Valley Metropolitan Statistical Area and has a population of 8,469 as of the 2010 census. The economy of Eagle Point is largely based on agriculture and tourism, and the city is home to several wineries, farms, and businesses. The population is largely white, with a significant Hispanic or Latino population. The median income for a household in the city is $41,944, and the median income for a family is $50,919.
Common Questions
What is Per Capita Income in Eagle Point?
Per Capita income in Eagle Point is $31,783.
What is the Median Family Income in Eagle Point?
Median Family Income in Eagle Point is $70,332.
What is the Median Household income in Eagle Point?
Median Household Income in Eagle Point is $83,625.
What is Income or Wage Gap in Eagle Point?
Income or Wage Gap in Eagle Point is 18.9%.
Women in Eagle Point earn 81.1 cents for every dollar earned by a man.
What is Inequality or Gini Index in Eagle Point?
Inequality or Gini Index in Eagle Point is 0.31.
What is the Total Population of Eagle Point?
Total Population of Eagle Point is 9,735.
What is the Total Male Population of Eagle Point?
Total Male Population of Eagle Point is 4,752.
What is the Total Female Population of Eagle Point?
Total Female Population of Eagle Point is 4,983.
What is the Ratio of Males per 100 Females in Eagle Point?
There are 95.36 Males per 100 Females in Eagle Point.
What is the Ratio of Females per 100 Males in Eagle Point?
There are 104.86 Females per 100 Males in Eagle Point.
What is the Median Population Age in Eagle Point?
Median Population Age in Eagle Point is 36.7 Years.
What is the Average Family Size in Eagle Point
Average Family Size in Eagle Point is 2.9 People.
What is the Average Household Size in Eagle Point
Average Household Size in Eagle Point is 2.8 People.
How Large is the Labor Force in Eagle Point?
There are 4,706 People in the Labor Forcein in Eagle Point.
What is the Percentage of People in the Labor Force in Eagle Point?
67.1% of People are in the Labor Force in Eagle Point.
What is the Unemployment Rate in Eagle Point?
Unemployment Rate in Eagle Point is 12.9%.