Chickasha, OK Map & Demographics
Chickasha Map
Chickasha Overview
$31,688
PER CAPITA INCOME
$68,871
AVG FAMILY INCOME
$55,136
AVG HOUSEHOLD INCOME
51.8%
WAGE / INCOME GAP [ % ]
48.2¢/ $1
WAGE / INCOME GAP [ $ ]
$11,667
FAMILY INCOME DEFICIT
0.48
INEQUALITY / GINI INDEX
16,231
TOTAL POPULATION
7,962
MALE POPULATION
8,269
FEMALE POPULATION
96.29
MALES / 100 FEMALES
103.86
FEMALES / 100 MALES
36.4
MEDIAN AGE
3.2
AVG FAMILY SIZE
2.5
AVG HOUSEHOLD SIZE
7,544
LABOR FORCE [ PEOPLE ]
57.7%
PERCENT IN LABOR FORCE
5.7%
UNEMPLOYMENT RATE
Chickasha Zip Codes
Chickasha Area Codes
Income in Chickasha
Income Overview in Chickasha
Per Capita Income in Chickasha is $31,688, while median incomes of families and households are $68,871 and $55,136 respectively.
| Characteristic | Number | Measure |
| Per Capita Income | 16,231 | $31,688 |
| Median Family Income | 3,773 | $68,871 |
| Mean Family Income | 3,773 | $90,195 |
| Median Household Income | 6,222 | $55,136 |
| Mean Household Income | 6,222 | $74,629 |
| Income Deficit | 3,773 | $11,667 |
| Wage / Income Gap (%) | 16,231 | 51.75% |
| Wage / Income Gap ($) | 16,231 | 48.25¢ per $1 |
| Gini / Inequality Index | 16,231 | 0.48 |
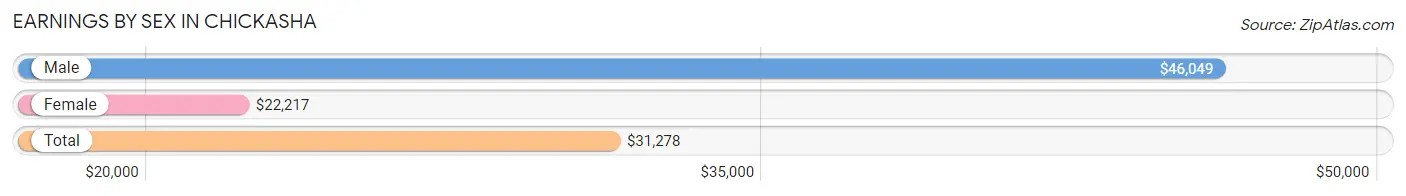
Earnings by Sex in Chickasha
Average Earnings in Chickasha are $31,278, $46,049 for men and $22,217 for women, a difference of 51.7%.
| Sex | Number | Average Earnings |
| Male | 4,211 (51.6%) | $46,049 |
| Female | 3,948 (48.4%) | $22,217 |
| Total | 8,159 (100.0%) | $31,278 |
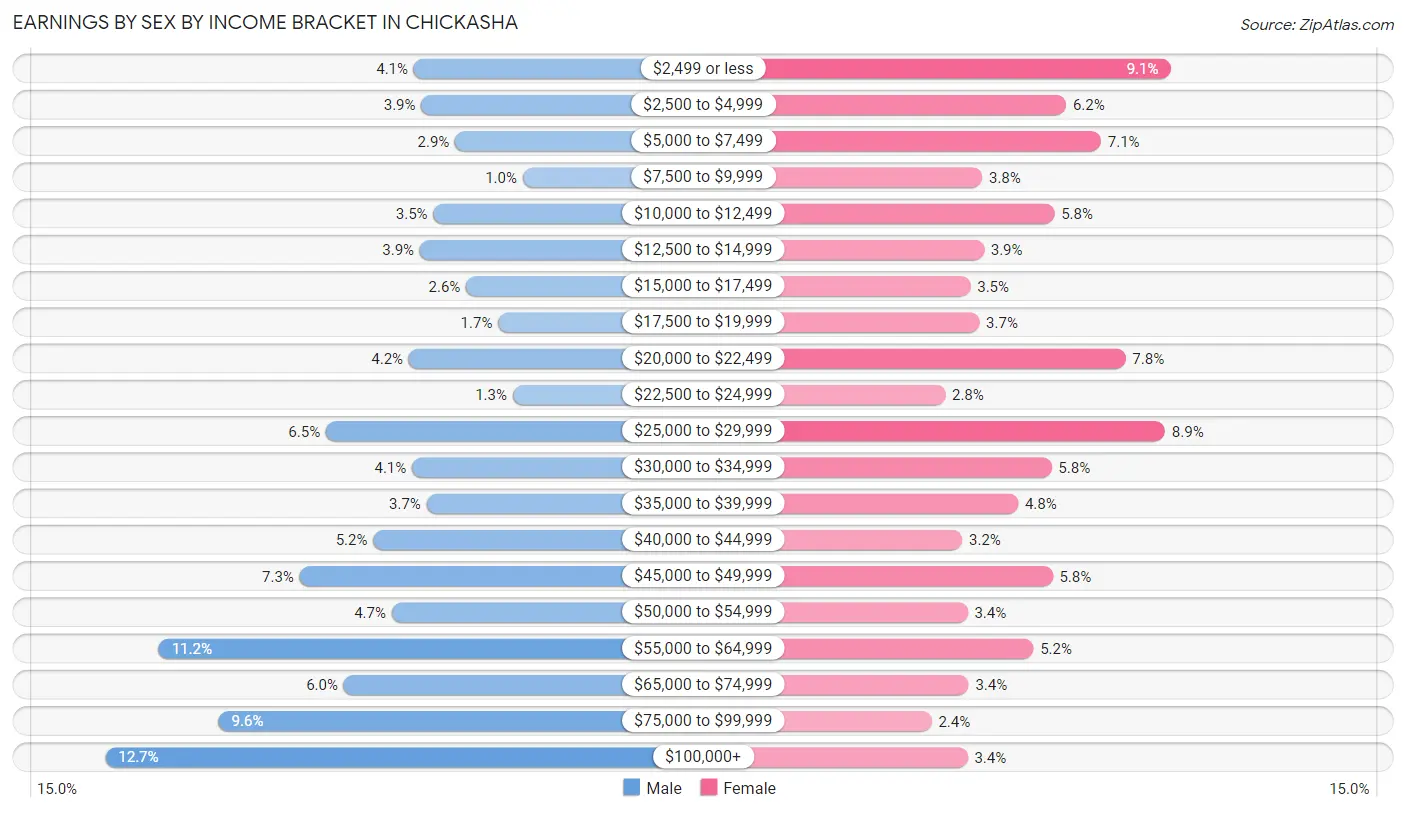
Earnings by Sex by Income Bracket in Chickasha
The most common earnings brackets in Chickasha are $100,000+ for men (536 | 12.7%) and $2,499 or less for women (359 | 9.1%).
| Income | Male | Female |
| $2,499 or less | 171 (4.1%) | 359 (9.1%) |
| $2,500 to $4,999 | 162 (3.8%) | 243 (6.2%) |
| $5,000 to $7,499 | 122 (2.9%) | 282 (7.1%) |
| $7,500 to $9,999 | 42 (1.0%) | 150 (3.8%) |
| $10,000 to $12,499 | 148 (3.5%) | 230 (5.8%) |
| $12,500 to $14,999 | 164 (3.9%) | 152 (3.8%) |
| $15,000 to $17,499 | 109 (2.6%) | 137 (3.5%) |
| $17,500 to $19,999 | 71 (1.7%) | 147 (3.7%) |
| $20,000 to $22,499 | 177 (4.2%) | 309 (7.8%) |
| $22,500 to $24,999 | 54 (1.3%) | 109 (2.8%) |
| $25,000 to $29,999 | 275 (6.5%) | 353 (8.9%) |
| $30,000 to $34,999 | 173 (4.1%) | 227 (5.8%) |
| $35,000 to $39,999 | 156 (3.7%) | 190 (4.8%) |
| $40,000 to $44,999 | 219 (5.2%) | 128 (3.2%) |
| $45,000 to $49,999 | 306 (7.3%) | 228 (5.8%) |
| $50,000 to $54,999 | 197 (4.7%) | 134 (3.4%) |
| $55,000 to $64,999 | 473 (11.2%) | 207 (5.2%) |
| $65,000 to $74,999 | 254 (6.0%) | 135 (3.4%) |
| $75,000 to $99,999 | 402 (9.6%) | 94 (2.4%) |
| $100,000+ | 536 (12.7%) | 134 (3.4%) |
| Total | 4,211 (100.0%) | 3,948 (100.0%) |
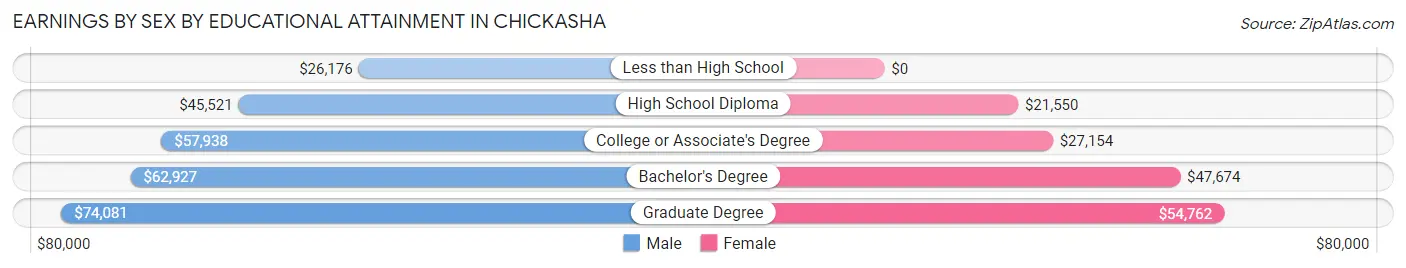
Earnings by Sex by Educational Attainment in Chickasha
Average earnings in Chickasha are $51,250 for men and $26,590 for women, a difference of 48.1%. Men with an educational attainment of graduate degree enjoy the highest average annual earnings of $74,081, while those with less than high school education earn the least with $26,176. Women with an educational attainment of graduate degree earn the most with the average annual earnings of $54,762, while those with high school diploma education have the smallest earnings of $21,550.
| Educational Attainment | Male Income | Female Income |
| Less than High School | $26,176 | $0 |
| High School Diploma | $45,521 | $21,550 |
| College or Associate's Degree | $57,938 | $27,154 |
| Bachelor's Degree | $62,927 | $47,674 |
| Graduate Degree | $74,081 | $54,762 |
| Total | $51,250 | $26,590 |
Family Income in Chickasha
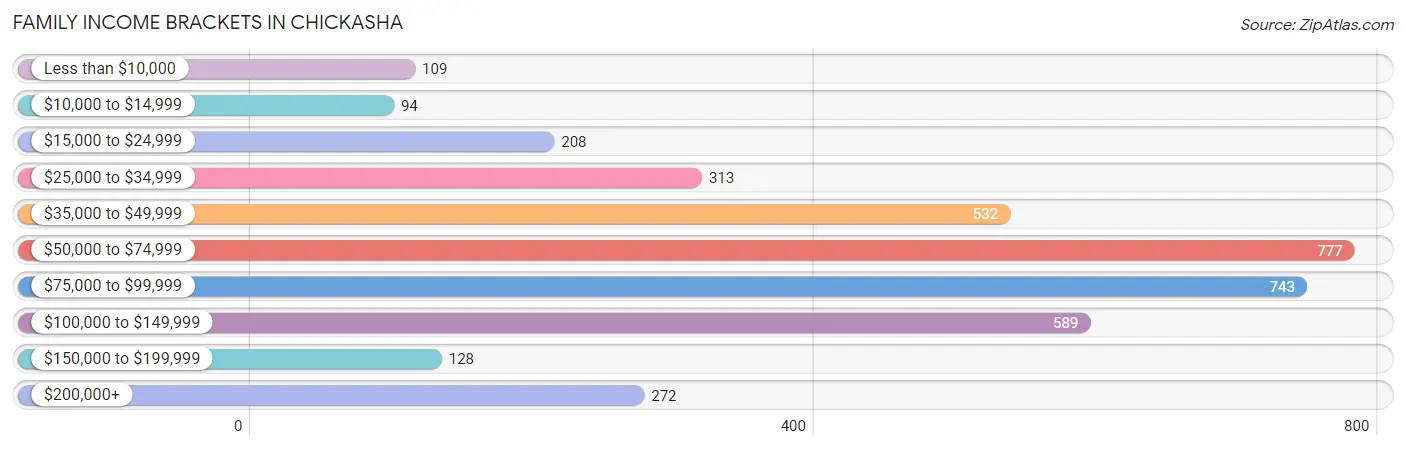
Family Income Brackets in Chickasha
According to the Chickasha family income data, there are 777 families falling into the $50,000 to $74,999 income range, which is the most common income bracket and makes up 20.6% of all families. Conversely, the $10,000 to $14,999 income bracket is the least frequent group with only 94 families (2.5%) belonging to this category.
| Income Bracket | # Families | % Families |
| Less than $10,000 | 109 | 2.9% |
| $10,000 to $14,999 | 94 | 2.5% |
| $15,000 to $24,999 | 208 | 5.5% |
| $25,000 to $34,999 | 313 | 8.3% |
| $35,000 to $49,999 | 532 | 14.1% |
| $50,000 to $74,999 | 777 | 20.6% |
| $75,000 to $99,999 | 743 | 19.7% |
| $100,000 to $149,999 | 589 | 15.6% |
| $150,000 to $199,999 | 128 | 3.4% |
| $200,000+ | 272 | 7.2% |
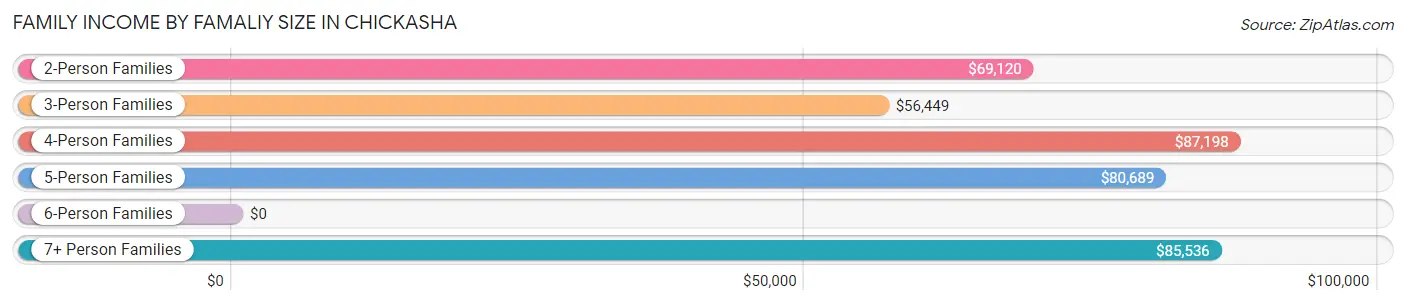
Family Income by Famaliy Size in Chickasha
4-person families (613 | 16.3%) account for the highest median family income in Chickasha with $87,198 per family, while 2-person families (1,674 | 44.4%) have the highest median income of $34,560 per family member.
| Income Bracket | # Families | Median Income |
| 2-Person Families | 1,674 (44.4%) | $69,120 |
| 3-Person Families | 1,037 (27.5%) | $56,449 |
| 4-Person Families | 613 (16.3%) | $87,198 |
| 5-Person Families | 289 (7.7%) | $80,689 |
| 6-Person Families | 106 (2.8%) | $0 |
| 7+ Person Families | 54 (1.4%) | $85,536 |
| Total | 3,773 (100.0%) | $68,871 |
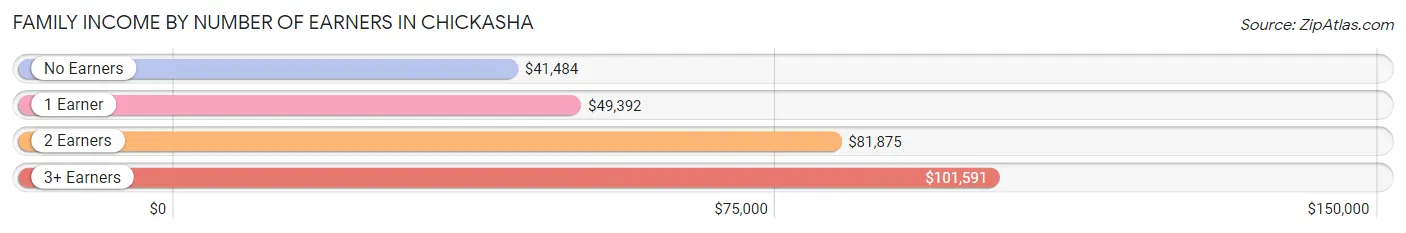
Family Income by Number of Earners in Chickasha
The median family income in Chickasha is $68,871, with families comprising 3+ earners (320) having the highest median family income of $101,591, while families with no earners (569) have the lowest median family income of $41,484, accounting for 8.5% and 15.1% of families, respectively.
| Number of Earners | # Families | Median Income |
| No Earners | 569 (15.1%) | $41,484 |
| 1 Earner | 1,281 (34.0%) | $49,392 |
| 2 Earners | 1,603 (42.5%) | $81,875 |
| 3+ Earners | 320 (8.5%) | $101,591 |
| Total | 3,773 (100.0%) | $68,871 |
Household Income in Chickasha
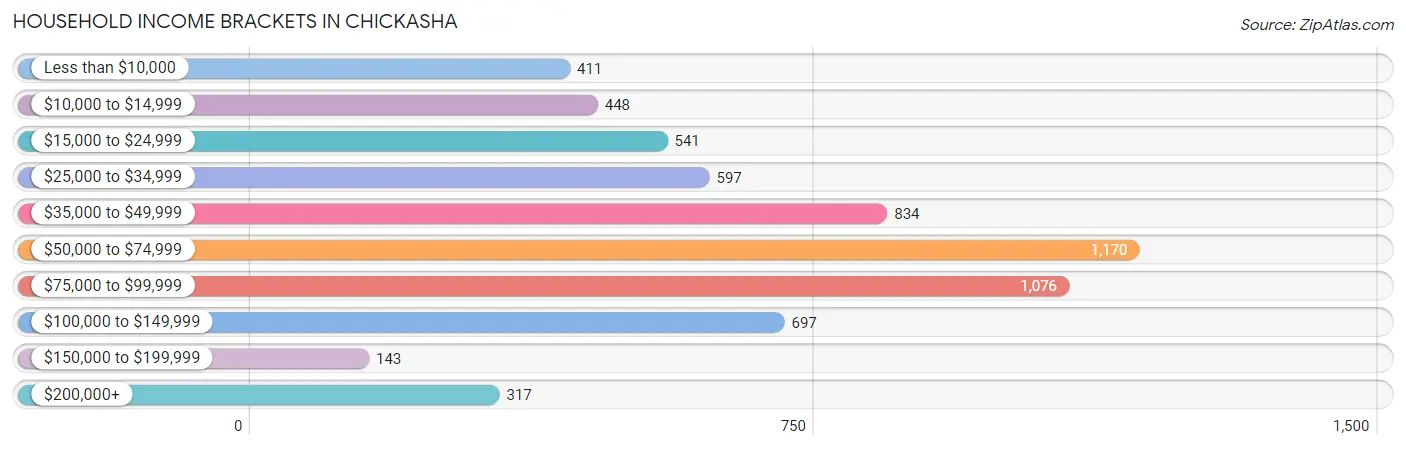
Household Income Brackets in Chickasha
With 1,170 households falling in the category, the $50,000 to $74,999 income range is the most frequent in Chickasha, accounting for 18.8% of all households. In contrast, only 143 households (2.3%) fall into the $150,000 to $199,999 income bracket, making it the least populous group.
| Income Bracket | # Households | % Households |
| Less than $10,000 | 411 | 6.6% |
| $10,000 to $14,999 | 448 | 7.2% |
| $15,000 to $24,999 | 541 | 8.7% |
| $25,000 to $34,999 | 597 | 9.6% |
| $35,000 to $49,999 | 834 | 13.4% |
| $50,000 to $74,999 | 1,170 | 18.8% |
| $75,000 to $99,999 | 1,076 | 17.3% |
| $100,000 to $149,999 | 697 | 11.2% |
| $150,000 to $199,999 | 143 | 2.3% |
| $200,000+ | 317 | 5.1% |
Household Income by Householder Age in Chickasha
The median household income in Chickasha is $55,136, with the highest median household income of $68,061 found in the 25 to 44 years age bracket for the primary householder. A total of 2,076 households (33.4%) fall into this category. Meanwhile, the 15 to 24 years age bracket for the primary householder has the lowest median household income of $25,380, with 329 households (5.3%) in this group.
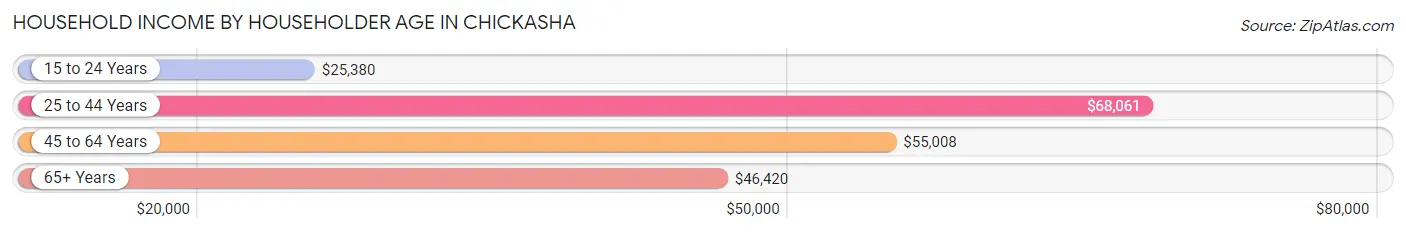
| Income Bracket | # Households | Median Income |
| 15 to 24 Years | 329 (5.3%) | $25,380 |
| 25 to 44 Years | 2,076 (33.4%) | $68,061 |
| 45 to 64 Years | 2,145 (34.5%) | $55,008 |
| 65+ Years | 1,672 (26.9%) | $46,420 |
| Total | 6,222 (100.0%) | $55,136 |
Poverty in Chickasha
Income Below Poverty by Sex and Age in Chickasha
With 17.4% poverty level for males and 17.6% for females among the residents of Chickasha, 12 to 14 year old males and 15 year old females are the most vulnerable to poverty, with 132 males (43.6%) and 61 females (39.1%) in their respective age groups living below the poverty level.
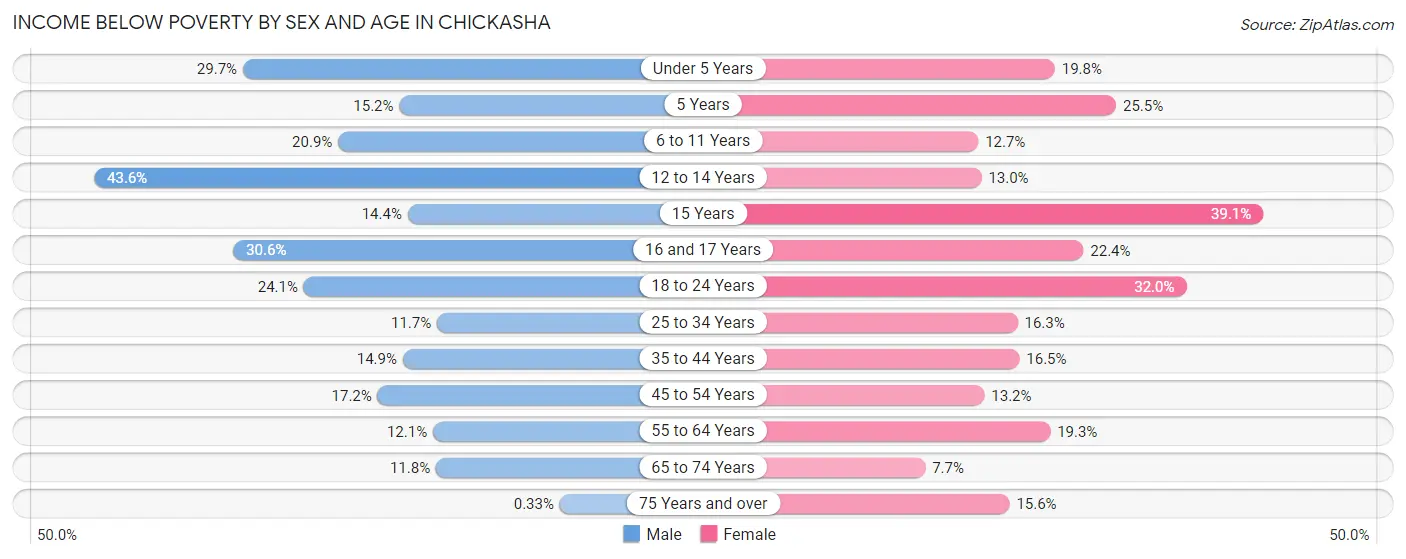
| Age Bracket | Male | Female |
| Under 5 Years | 135 (29.7%) | 52 (19.8%) |
| 5 Years | 7 (15.2%) | 14 (25.5%) |
| 6 to 11 Years | 134 (20.9%) | 79 (12.7%) |
| 12 to 14 Years | 132 (43.6%) | 46 (13.0%) |
| 15 Years | 27 (14.4%) | 61 (39.1%) |
| 16 and 17 Years | 72 (30.6%) | 37 (22.4%) |
| 18 to 24 Years | 193 (24.1%) | 274 (32.0%) |
| 25 to 34 Years | 133 (11.7%) | 160 (16.3%) |
| 35 to 44 Years | 159 (14.9%) | 177 (16.5%) |
| 45 to 54 Years | 121 (17.2%) | 136 (13.2%) |
| 55 to 64 Years | 121 (12.1%) | 189 (19.3%) |
| 65 to 74 Years | 80 (11.8%) | 46 (7.7%) |
| 75 Years and over | 1 (0.3%) | 113 (15.6%) |
| Total | 1,315 (17.4%) | 1,384 (17.6%) |
Income Above Poverty by Sex and Age in Chickasha
According to the poverty statistics in Chickasha, males aged 75 years and over and females aged 65 to 74 years are the age groups that are most secure financially, with 99.7% of males and 92.3% of females in these age groups living above the poverty line.
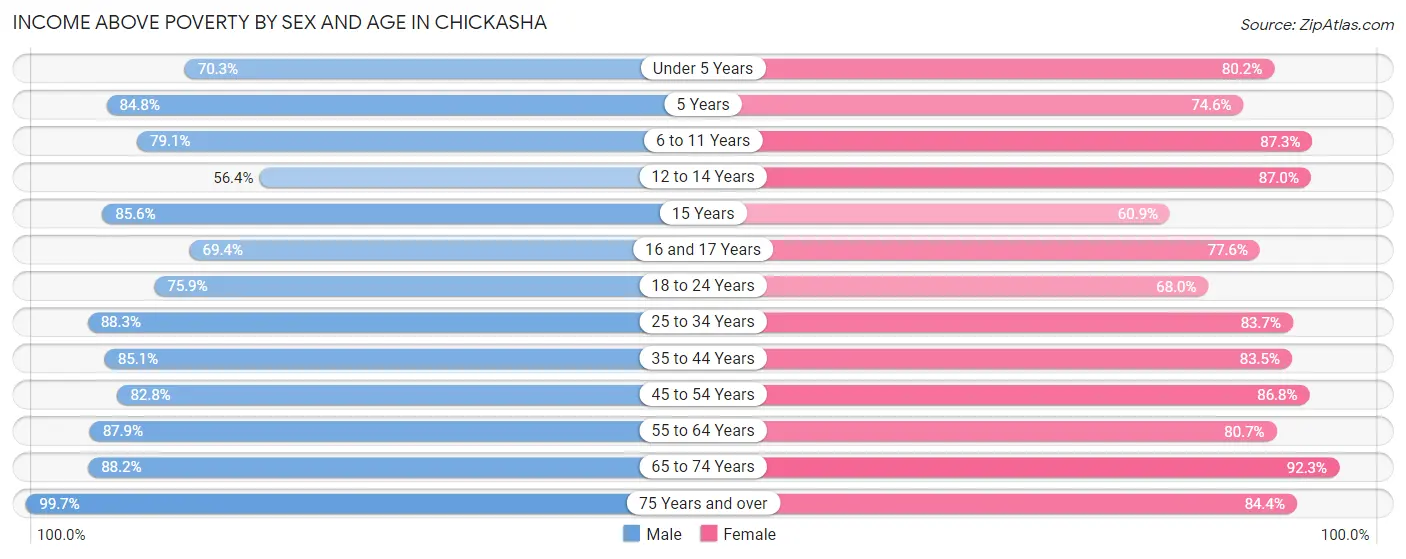
| Age Bracket | Male | Female |
| Under 5 Years | 319 (70.3%) | 211 (80.2%) |
| 5 Years | 39 (84.8%) | 41 (74.6%) |
| 6 to 11 Years | 507 (79.1%) | 545 (87.3%) |
| 12 to 14 Years | 171 (56.4%) | 309 (87.0%) |
| 15 Years | 160 (85.6%) | 95 (60.9%) |
| 16 and 17 Years | 163 (69.4%) | 128 (77.6%) |
| 18 to 24 Years | 608 (75.9%) | 583 (68.0%) |
| 25 to 34 Years | 1,002 (88.3%) | 821 (83.7%) |
| 35 to 44 Years | 908 (85.1%) | 897 (83.5%) |
| 45 to 54 Years | 581 (82.8%) | 892 (86.8%) |
| 55 to 64 Years | 879 (87.9%) | 788 (80.7%) |
| 65 to 74 Years | 597 (88.2%) | 548 (92.3%) |
| 75 Years and over | 303 (99.7%) | 613 (84.4%) |
| Total | 6,237 (82.6%) | 6,471 (82.4%) |
Income Below Poverty Among Married-Couple Families in Chickasha
The poverty statistics for married-couple families in Chickasha show that 4.6% or 120 of the total 2,606 families live below the poverty line. Families with 5 or more children have the highest poverty rate of 33.3%, comprising of 1 families. On the other hand, families with no children have the lowest poverty rate of 2.7%, which includes 41 families.
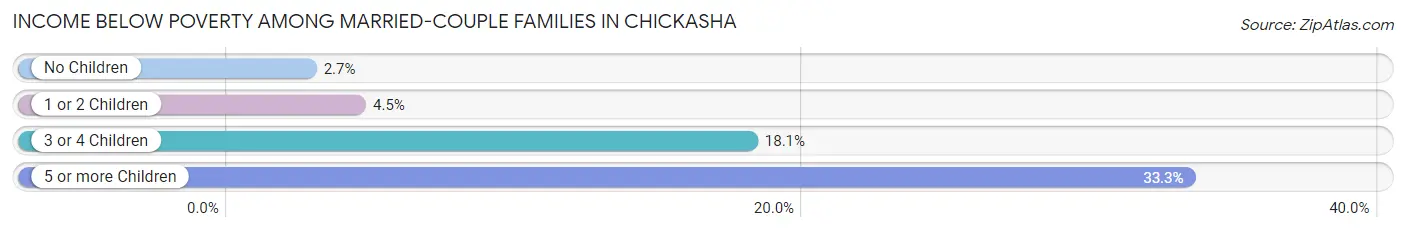
| Children | Above Poverty | Below Poverty |
| No Children | 1,456 (97.3%) | 41 (2.7%) |
| 1 or 2 Children | 856 (95.5%) | 40 (4.5%) |
| 3 or 4 Children | 172 (81.9%) | 38 (18.1%) |
| 5 or more Children | 2 (66.7%) | 1 (33.3%) |
| Total | 2,486 (95.4%) | 120 (4.6%) |
Income Below Poverty Among Single-Parent Households in Chickasha
According to the poverty data in Chickasha, 7.0% or 18 single-father households and 30.3% or 276 single-mother households are living below the poverty line. Among single-father households, those with 3 or 4 children have the highest poverty rate, with 8 households (100.0%) experiencing poverty. Likewise, among single-mother households, those with 5 or more children have the highest poverty rate, with 18 households (100.0%) falling below the poverty line.
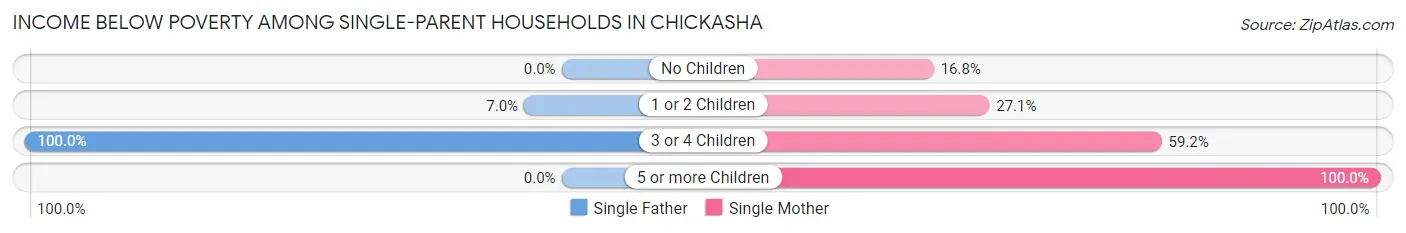
| Children | Single Father | Single Mother |
| No Children | 0 (0.0%) | 53 (16.8%) |
| 1 or 2 Children | 10 (7.0%) | 115 (27.1%) |
| 3 or 4 Children | 8 (100.0%) | 90 (59.2%) |
| 5 or more Children | 0 (0.0%) | 18 (100.0%) |
| Total | 18 (7.0%) | 276 (30.3%) |
Income Below Poverty Among Married-Couple vs Single-Parent Households in Chickasha
The poverty data for Chickasha shows that 120 of the married-couple family households (4.6%) and 294 of the single-parent households (25.2%) are living below the poverty level. Within the married-couple family households, those with 5 or more children have the highest poverty rate, with 1 households (33.3%) falling below the poverty line. Among the single-parent households, those with 5 or more children have the highest poverty rate, with 18 household (100.0%) living below poverty.
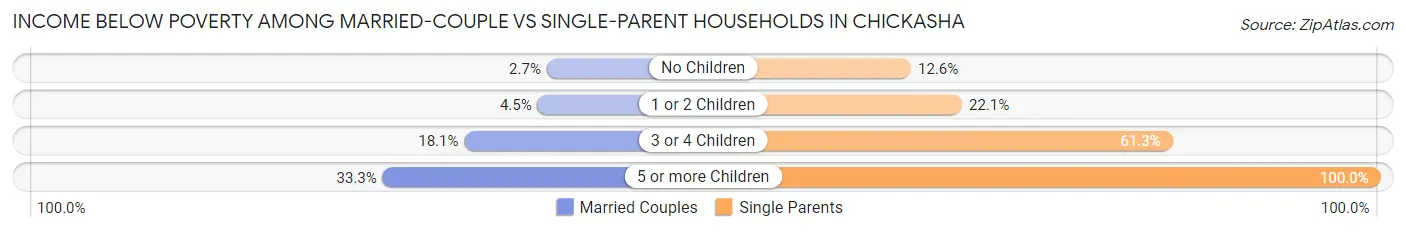
| Children | Married-Couple Families | Single-Parent Households |
| No Children | 41 (2.7%) | 53 (12.6%) |
| 1 or 2 Children | 40 (4.5%) | 125 (22.1%) |
| 3 or 4 Children | 38 (18.1%) | 98 (61.3%) |
| 5 or more Children | 1 (33.3%) | 18 (100.0%) |
| Total | 120 (4.6%) | 294 (25.2%) |
Race in Chickasha
The most populous races in Chickasha are White / Caucasian (12,204 | 75.2%), Two or more Races (1,877 | 11.6%), and Hispanic or Latino (1,370 | 8.4%).
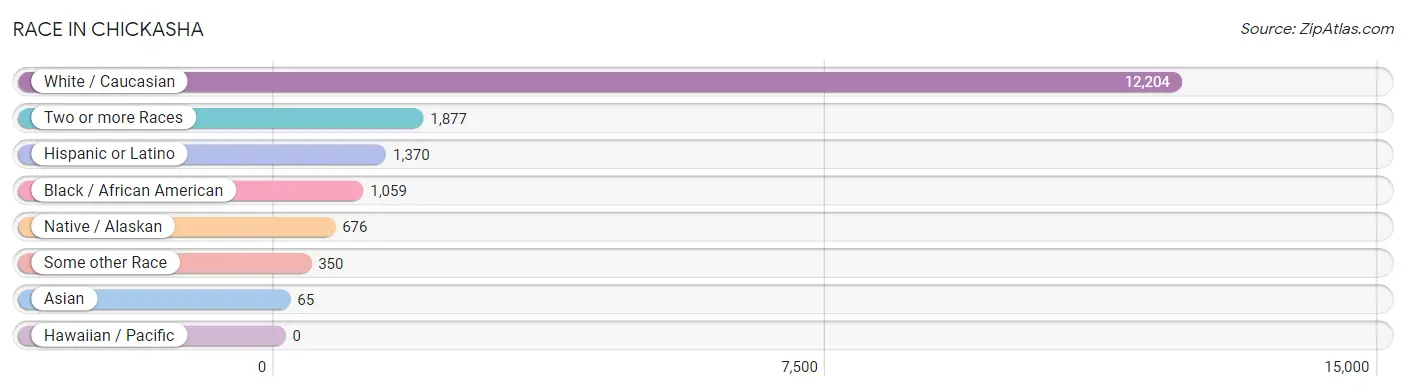
| Race | # Population | % Population |
| Asian | 65 | 0.4% |
| Black / African American | 1,059 | 6.5% |
| Hawaiian / Pacific | 0 | 0.0% |
| Hispanic or Latino | 1,370 | 8.4% |
| Native / Alaskan | 676 | 4.2% |
| White / Caucasian | 12,204 | 75.2% |
| Two or more Races | 1,877 | 11.6% |
| Some other Race | 350 | 2.2% |
| Total | 16,231 | 100.0% |
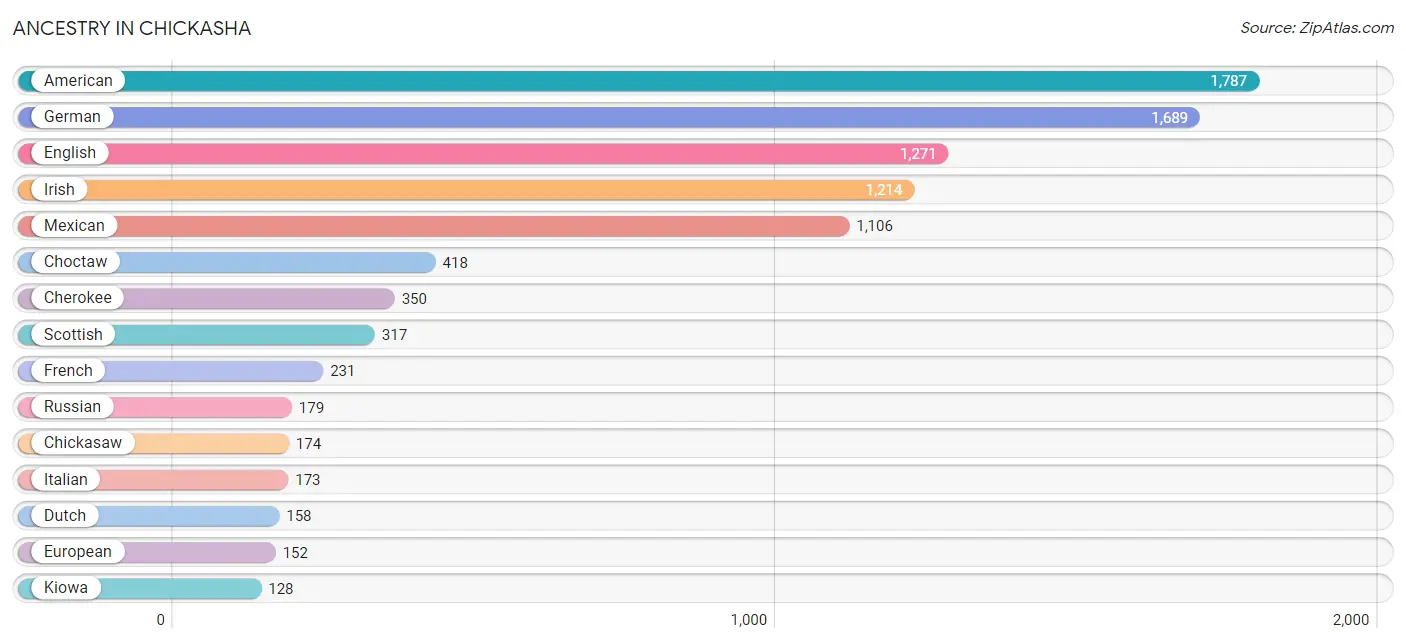
Ancestry in Chickasha
The most populous ancestries reported in Chickasha are American (1,787 | 11.0%), German (1,689 | 10.4%), English (1,271 | 7.8%), Irish (1,214 | 7.5%), and Mexican (1,106 | 6.8%), together accounting for 43.5% of all Chickasha residents.
| Ancestry | # Population | % Population |
| African | 11 | 0.1% |
| American | 1,787 | 11.0% |
| Apache | 96 | 0.6% |
| Arapaho | 29 | 0.2% |
| Austrian | 20 | 0.1% |
| Bhutanese | 19 | 0.1% |
| Blackfeet | 28 | 0.2% |
| British | 20 | 0.1% |
| Burmese | 76 | 0.5% |
| Central American | 19 | 0.1% |
| Cherokee | 350 | 2.2% |
| Cheyenne | 29 | 0.2% |
| Chickasaw | 174 | 1.1% |
| Chippewa | 2 | 0.0% |
| Choctaw | 418 | 2.6% |
| Comanche | 119 | 0.7% |
| Creek | 16 | 0.1% |
| Czech | 38 | 0.2% |
| Czechoslovakian | 2 | 0.0% |
| Danish | 9 | 0.1% |
| Delaware | 64 | 0.4% |
| Dominican | 28 | 0.2% |
| Dutch | 158 | 1.0% |
| Dutch West Indian | 107 | 0.7% |
| English | 1,271 | 7.8% |
| European | 152 | 0.9% |
| French | 231 | 1.4% |
| French Canadian | 10 | 0.1% |
| German | 1,689 | 10.4% |
| Greek | 4 | 0.0% |
| Guatemalan | 9 | 0.1% |
| Hungarian | 10 | 0.1% |
| Iranian | 31 | 0.2% |
| Irish | 1,214 | 7.5% |
| Italian | 173 | 1.1% |
| Jamaican | 24 | 0.2% |
| Kiowa | 128 | 0.8% |
| Korean | 12 | 0.1% |
| Malaysian | 35 | 0.2% |
| Mexican | 1,106 | 6.8% |
| Mexican American Indian | 19 | 0.1% |
| Navajo | 31 | 0.2% |
| Nigerian | 71 | 0.4% |
| Northern European | 125 | 0.8% |
| Norwegian | 67 | 0.4% |
| Pennsylvania German | 15 | 0.1% |
| Polish | 106 | 0.6% |
| Portuguese | 15 | 0.1% |
| Potawatomi | 28 | 0.2% |
| Pueblo | 16 | 0.1% |
| Puerto Rican | 46 | 0.3% |
| Russian | 179 | 1.1% |
| Salvadoran | 10 | 0.1% |
| Samoan | 10 | 0.1% |
| Scandinavian | 23 | 0.1% |
| Scotch-Irish | 117 | 0.7% |
| Scottish | 317 | 1.9% |
| Seminole | 29 | 0.2% |
| Spaniard | 19 | 0.1% |
| Spanish | 21 | 0.1% |
| Spanish American | 13 | 0.1% |
| Subsaharan African | 82 | 0.5% |
| Swedish | 55 | 0.3% |
| Swiss | 1 | 0.0% |
| Thai | 3 | 0.0% |
| Ukrainian | 8 | 0.1% |
| Welsh | 52 | 0.3% | View All 67 Rows |
Immigrants in Chickasha
The most numerous immigrant groups reported in Chickasha came from Latin America (234 | 1.4%), Central America (206 | 1.3%), Mexico (187 | 1.1%), Europe (75 | 0.5%), and Africa (61 | 0.4%), together accounting for 4.7% of all Chickasha residents.
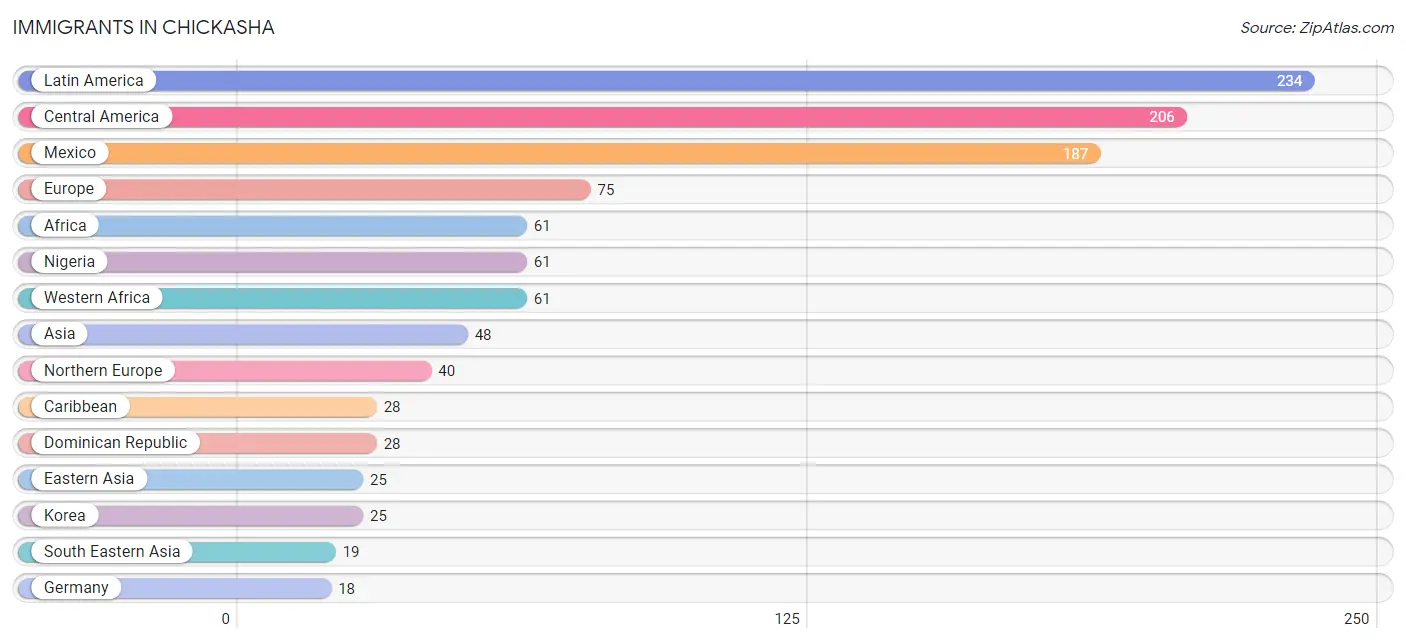
| Immigration Origin | # Population | % Population |
| Africa | 61 | 0.4% |
| Asia | 48 | 0.3% |
| Caribbean | 28 | 0.2% |
| Central America | 206 | 1.3% |
| Dominican Republic | 28 | 0.2% |
| Eastern Asia | 25 | 0.2% |
| Eastern Europe | 17 | 0.1% |
| El Salvador | 10 | 0.1% |
| England | 6 | 0.0% |
| Europe | 75 | 0.5% |
| Germany | 18 | 0.1% |
| Guatemala | 9 | 0.1% |
| Iran | 1 | 0.0% |
| Korea | 25 | 0.2% |
| Laos | 17 | 0.1% |
| Latin America | 234 | 1.4% |
| Mexico | 187 | 1.1% |
| Nepal | 3 | 0.0% |
| Nigeria | 61 | 0.4% |
| Northern Europe | 40 | 0.3% |
| Philippines | 2 | 0.0% |
| Poland | 17 | 0.1% |
| South Central Asia | 4 | 0.0% |
| South Eastern Asia | 19 | 0.1% |
| Western Africa | 61 | 0.4% |
| Western Europe | 18 | 0.1% | View All 26 Rows |
Sex and Age in Chickasha
Sex and Age in Chickasha
The most populous age groups in Chickasha are 15 to 19 Years (761 | 9.6%) for men and 20 to 24 Years (797 | 9.6%) for women.
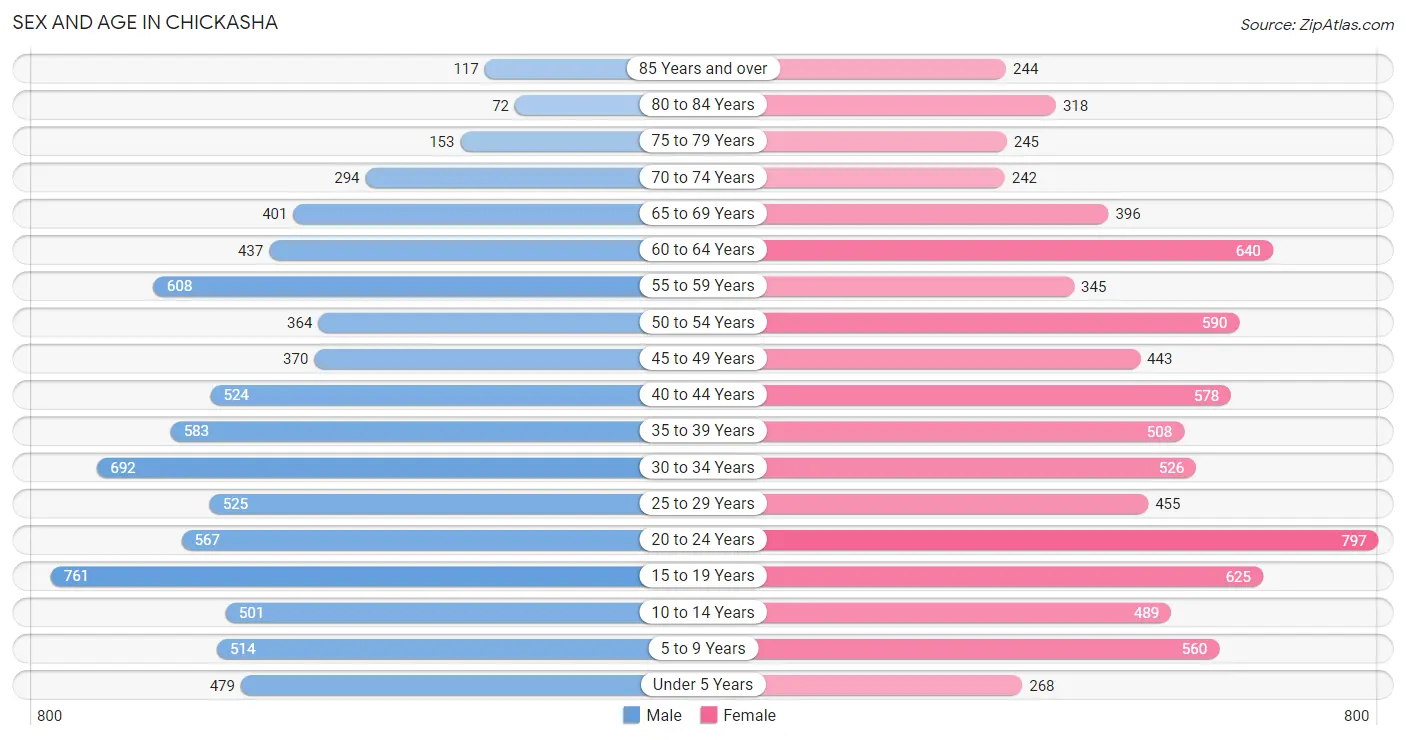
| Age Bracket | Male | Female |
| Under 5 Years | 479 (6.0%) | 268 (3.2%) |
| 5 to 9 Years | 514 (6.5%) | 560 (6.8%) |
| 10 to 14 Years | 501 (6.3%) | 489 (5.9%) |
| 15 to 19 Years | 761 (9.6%) | 625 (7.6%) |
| 20 to 24 Years | 567 (7.1%) | 797 (9.6%) |
| 25 to 29 Years | 525 (6.6%) | 455 (5.5%) |
| 30 to 34 Years | 692 (8.7%) | 526 (6.4%) |
| 35 to 39 Years | 583 (7.3%) | 508 (6.1%) |
| 40 to 44 Years | 524 (6.6%) | 578 (7.0%) |
| 45 to 49 Years | 370 (4.6%) | 443 (5.4%) |
| 50 to 54 Years | 364 (4.6%) | 590 (7.1%) |
| 55 to 59 Years | 608 (7.6%) | 345 (4.2%) |
| 60 to 64 Years | 437 (5.5%) | 640 (7.7%) |
| 65 to 69 Years | 401 (5.0%) | 396 (4.8%) |
| 70 to 74 Years | 294 (3.7%) | 242 (2.9%) |
| 75 to 79 Years | 153 (1.9%) | 245 (3.0%) |
| 80 to 84 Years | 72 (0.9%) | 318 (3.8%) |
| 85 Years and over | 117 (1.5%) | 244 (2.9%) |
| Total | 7,962 (100.0%) | 8,269 (100.0%) |
Families and Households in Chickasha
Median Family Size in Chickasha
The median family size in Chickasha is 3.20 persons per family, with single female/mother families (910 | 24.1%) accounting for the largest median family size of 3.92 persons per family. On the other hand, single male/father families (257 | 6.8%) represent the smallest median family size with 2.92 persons per family.
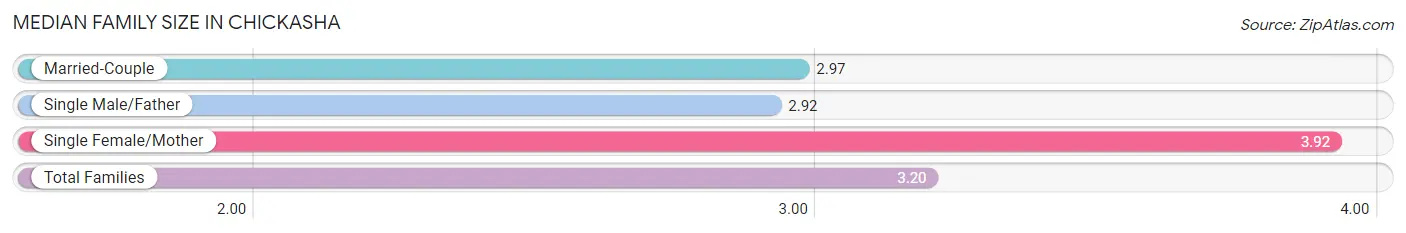
| Family Type | # Families | Family Size |
| Married-Couple | 2,606 (69.1%) | 2.97 |
| Single Male/Father | 257 (6.8%) | 2.92 |
| Single Female/Mother | 910 (24.1%) | 3.92 |
| Total Families | 3,773 (100.0%) | 3.20 |
Median Household Size in Chickasha
The median household size in Chickasha is 2.48 persons per household, with single female/mother households (910 | 14.6%) accounting for the largest median household size of 4.19 persons per household. non-family households (2,449 | 39.4%) represent the smallest median household size with 1.21 persons per household.
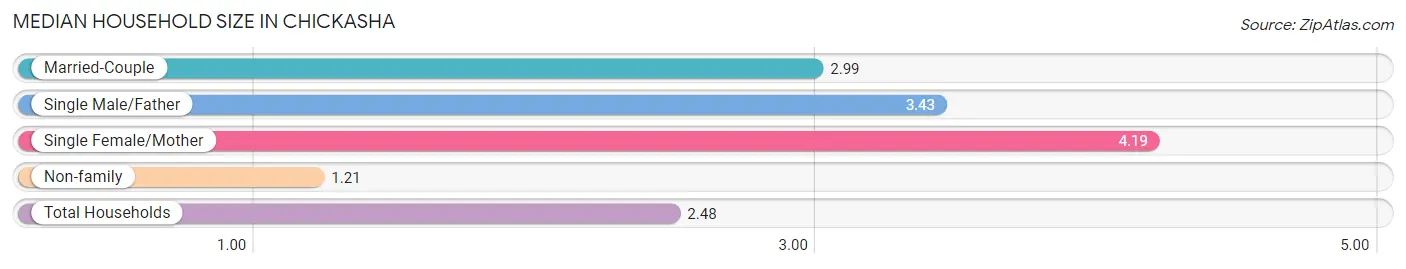
| Household Type | # Households | Household Size |
| Married-Couple | 2,606 (41.9%) | 2.99 |
| Single Male/Father | 257 (4.1%) | 3.43 |
| Single Female/Mother | 910 (14.6%) | 4.19 |
| Non-family | 2,449 (39.4%) | 1.21 |
| Total Households | 6,222 (100.0%) | 2.48 |
Household Size by Marriage Status in Chickasha
Out of a total of 6,222 households in Chickasha, 3,773 (60.6%) are family households, while 2,449 (39.4%) are nonfamily households. The most numerous type of family households are 2-person households, comprising 1,617, and the most common type of nonfamily households are 1-person households, comprising 2,086.
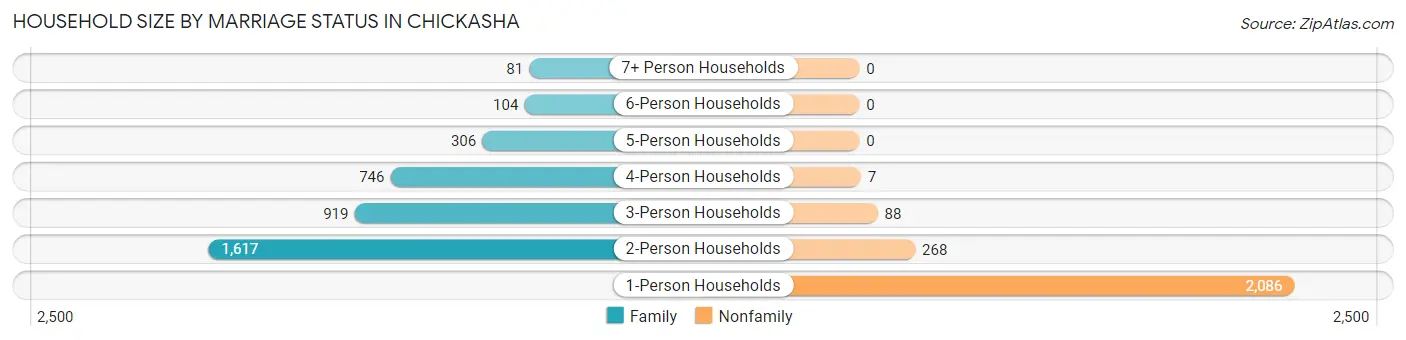
| Household Size | Family Households | Nonfamily Households |
| 1-Person Households | - | 2,086 (33.5%) |
| 2-Person Households | 1,617 (26.0%) | 268 (4.3%) |
| 3-Person Households | 919 (14.8%) | 88 (1.4%) |
| 4-Person Households | 746 (12.0%) | 7 (0.1%) |
| 5-Person Households | 306 (4.9%) | 0 (0.0%) |
| 6-Person Households | 104 (1.7%) | 0 (0.0%) |
| 7+ Person Households | 81 (1.3%) | 0 (0.0%) |
| Total | 3,773 (60.6%) | 2,449 (39.4%) |
Female Fertility in Chickasha
Fertility by Age in Chickasha
Average fertility rate in Chickasha is 56.0 births per 1,000 women. Women in the age bracket of 20 to 34 years have the highest fertility rate with 113.0 births per 1,000 women. Women in the age bracket of 20 to 34 years acount for 89.3% of all women with births.
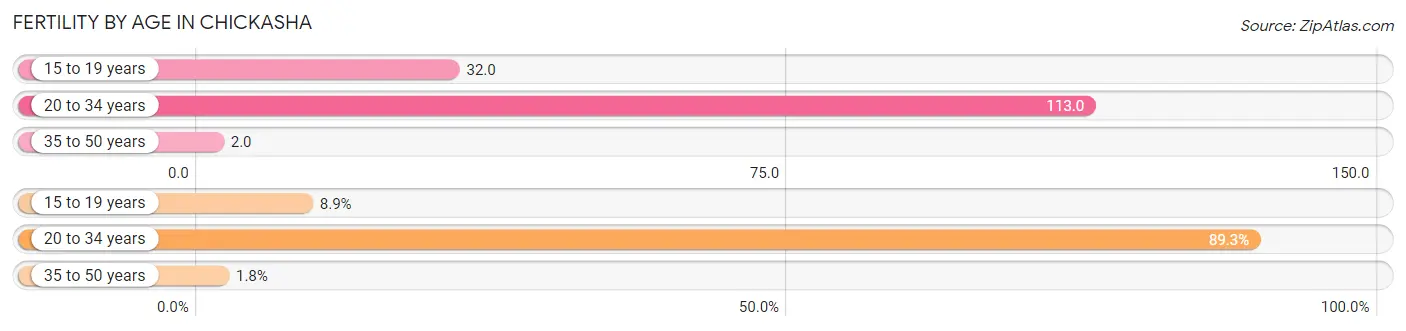
| Age Bracket | Women with Births | Births / 1,000 Women |
| 15 to 19 years | 20 (8.9%) | 32.0 |
| 20 to 34 years | 201 (89.3%) | 113.0 |
| 35 to 50 years | 4 (1.8%) | 2.0 |
| Total | 225 (100.0%) | 56.0 |
Fertility by Age by Marriage Status in Chickasha
42.7% of women with births (225) in Chickasha are married. The highest percentage of unmarried women with births falls into 15 to 19 years age bracket with 100.0% of them unmarried at the time of birth, while the lowest percentage of unmarried women with births belong to 20 to 34 years age bracket with 52.2% of them unmarried.
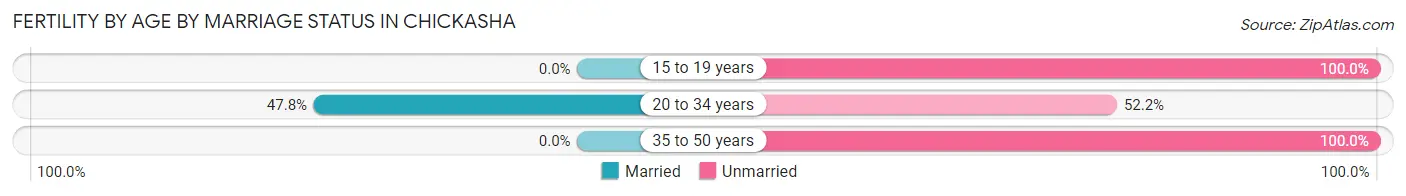
| Age Bracket | Married | Unmarried |
| 15 to 19 years | 0 (0.0%) | 20 (100.0%) |
| 20 to 34 years | 96 (47.8%) | 105 (52.2%) |
| 35 to 50 years | 0 (0.0%) | 4 (100.0%) |
| Total | 96 (42.7%) | 129 (57.3%) |
Fertility by Education in Chickasha
Average fertility rate in Chickasha is 56.0 births per 1,000 women. Women with the education attainment of high school diploma have the highest fertility rate of 72.0 births per 1,000 women, while women with the education attainment of bachelor's degree have the lowest fertility at 45.0 births per 1,000 women. Women with the education attainment of high school diploma represent 46.7% of all women with births.
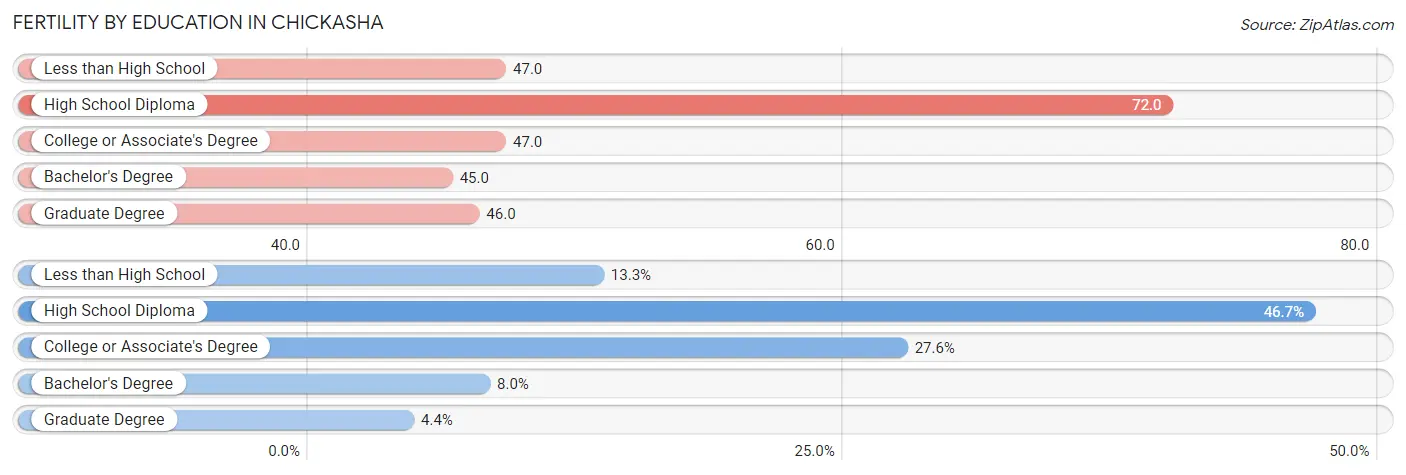
| Educational Attainment | Women with Births | Births / 1,000 Women |
| Less than High School | 30 (13.3%) | 47.0 |
| High School Diploma | 105 (46.7%) | 72.0 |
| College or Associate's Degree | 62 (27.6%) | 47.0 |
| Bachelor's Degree | 18 (8.0%) | 45.0 |
| Graduate Degree | 10 (4.4%) | 46.0 |
| Total | 225 (100.0%) | 56.0 |
Fertility by Education by Marriage Status in Chickasha
57.3% of women with births in Chickasha are unmarried. Women with the educational attainment of bachelor's degree are most likely to be married with 100.0% of them married at childbirth, while women with the educational attainment of less than high school are least likely to be married with 100.0% of them unmarried at childbirth.
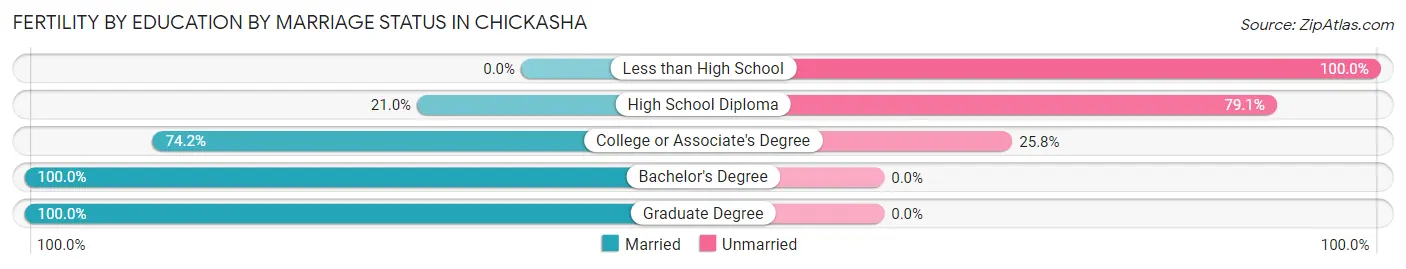
| Educational Attainment | Married | Unmarried |
| Less than High School | 0 (0.0%) | 30 (100.0%) |
| High School Diploma | 22 (20.9%) | 83 (79.0%) |
| College or Associate's Degree | 46 (74.2%) | 16 (25.8%) |
| Bachelor's Degree | 18 (100.0%) | 0 (0.0%) |
| Graduate Degree | 10 (100.0%) | 0 (0.0%) |
| Total | 96 (42.7%) | 129 (57.3%) |
Employment Characteristics in Chickasha
Employment by Class of Employer in Chickasha
Among the 6,987 employed individuals in Chickasha, private company employees (5,062 | 72.5%), local government employees (501 | 7.2%), and self-employed (not incorporated) (391 | 5.6%) make up the most common classes of employment.
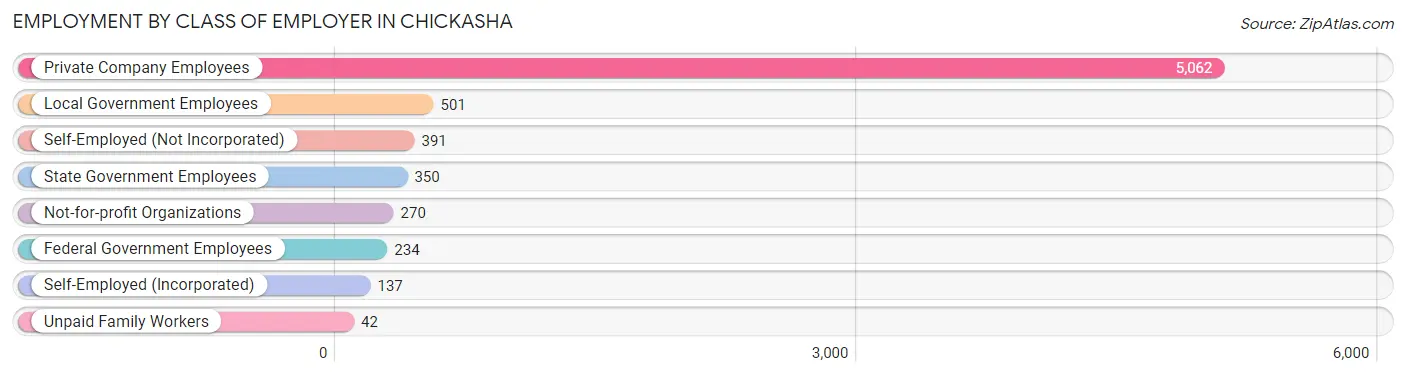
| Employer Class | # Employees | % Employees |
| Private Company Employees | 5,062 | 72.5% |
| Self-Employed (Incorporated) | 137 | 2.0% |
| Self-Employed (Not Incorporated) | 391 | 5.6% |
| Not-for-profit Organizations | 270 | 3.9% |
| Local Government Employees | 501 | 7.2% |
| State Government Employees | 350 | 5.0% |
| Federal Government Employees | 234 | 3.4% |
| Unpaid Family Workers | 42 | 0.6% |
| Total | 6,987 | 100.0% |
Employment Status by Age in Chickasha
According to the labor force statistics for Chickasha, out of the total population over 16 years of age (13,075), 57.7% or 7,544 individuals are in the labor force, with 5.7% or 430 of them unemployed. The age group with the highest labor force participation rate is 30 to 34 years, with 80.5% or 980 individuals in the labor force. Within the labor force, the 20 to 24 years age range has the highest percentage of unemployed individuals, with 8.1% or 77 of them being unemployed.
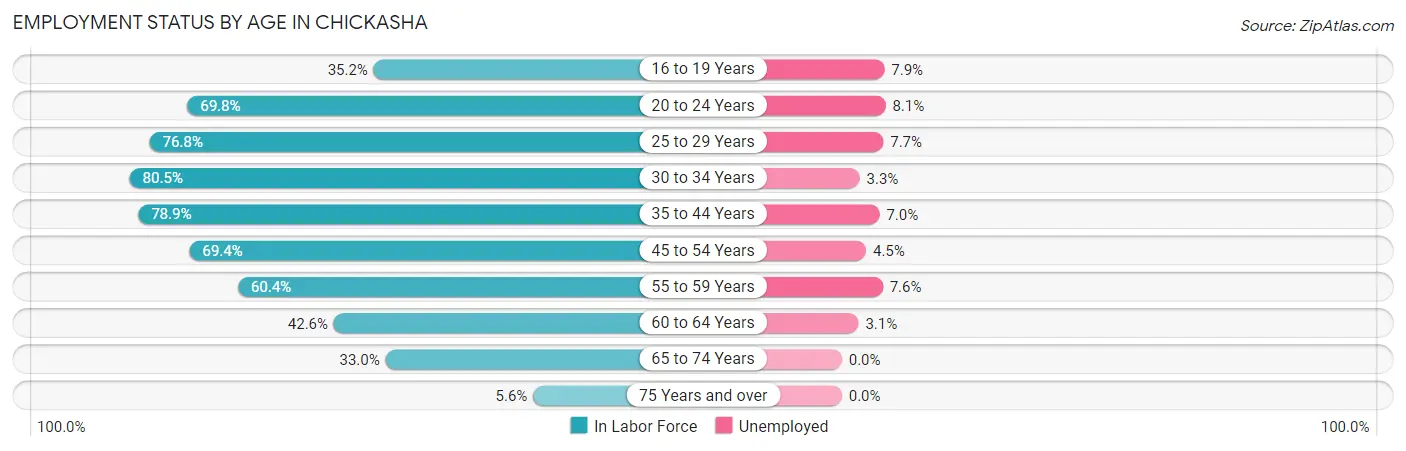
| Age Bracket | In Labor Force | Unemployed |
| 16 to 19 Years | 366 (35.2%) | 29 (7.9%) |
| 20 to 24 Years | 952 (69.8%) | 77 (8.1%) |
| 25 to 29 Years | 753 (76.8%) | 58 (7.7%) |
| 30 to 34 Years | 980 (80.5%) | 32 (3.3%) |
| 35 to 44 Years | 1,730 (78.9%) | 121 (7.0%) |
| 45 to 54 Years | 1,226 (69.4%) | 55 (4.5%) |
| 55 to 59 Years | 576 (60.4%) | 44 (7.6%) |
| 60 to 64 Years | 459 (42.6%) | 14 (3.1%) |
| 65 to 74 Years | 440 (33.0%) | 0 (0.0%) |
| 75 Years and over | 64 (5.6%) | 0 (0.0%) |
| Total | 7,544 (57.7%) | 430 (5.7%) |
Employment Status by Educational Attainment in Chickasha
According to labor force statistics for Chickasha, 69.9% of individuals (5,723) out of the total population between 25 and 64 years of age (8,188) are in the labor force, with 5.7% or 326 of them being unemployed. The group with the highest labor force participation rate are those with the educational attainment of bachelor's degree or higher, with 87.1% or 1,191 individuals in the labor force. Within the labor force, individuals with less than high school education have the highest percentage of unemployment, with 13.9% or 42 of them being unemployed.
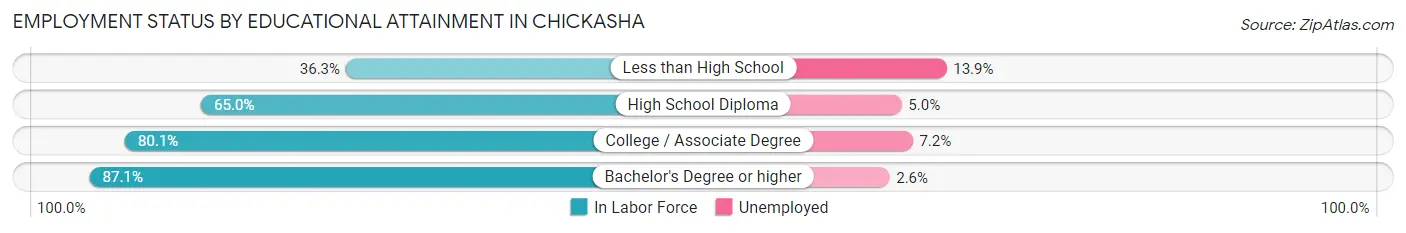
| Educational Attainment | In Labor Force | Unemployed |
| Less than High School | 303 (36.3%) | 116 (13.9%) |
| High School Diploma | 2,415 (65.0%) | 186 (5.0%) |
| College / Associate Degree | 1,818 (80.1%) | 163 (7.2%) |
| Bachelor's Degree or higher | 1,191 (87.1%) | 36 (2.6%) |
| Total | 5,723 (69.9%) | 467 (5.7%) |
Employment Occupations by Sex in Chickasha
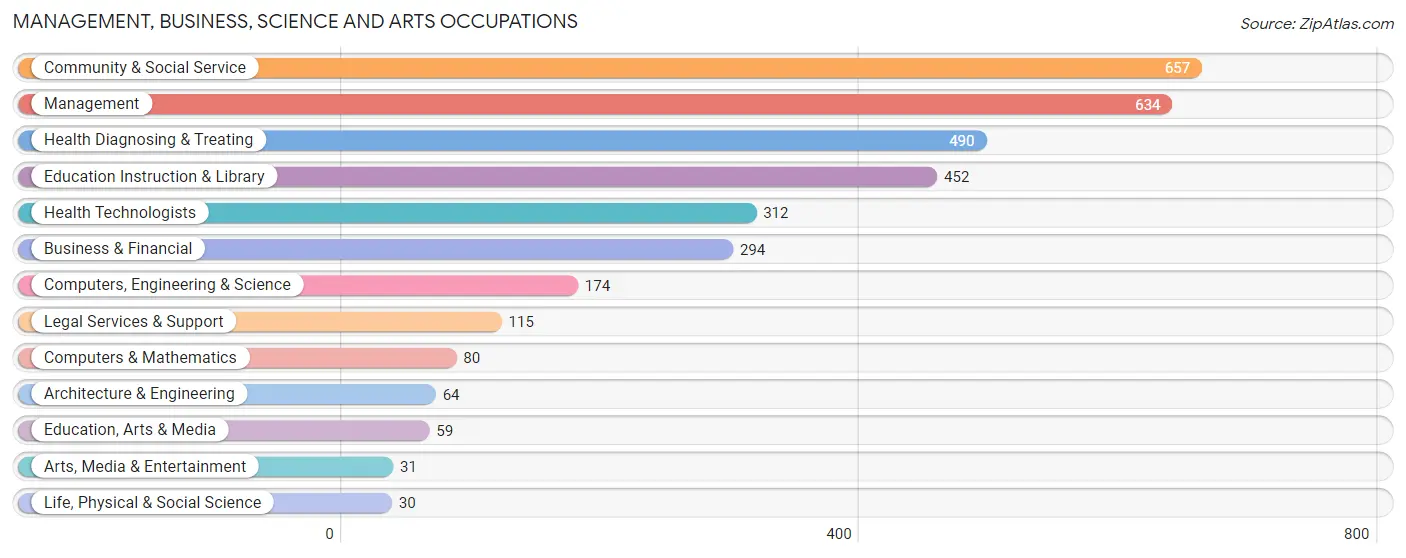
Management, Business, Science and Arts Occupations
The most common Management, Business, Science and Arts occupations in Chickasha are Community & Social Service (657 | 9.3%), Management (634 | 8.9%), Health Diagnosing & Treating (490 | 6.9%), Education Instruction & Library (452 | 6.4%), and Health Technologists (312 | 4.4%).
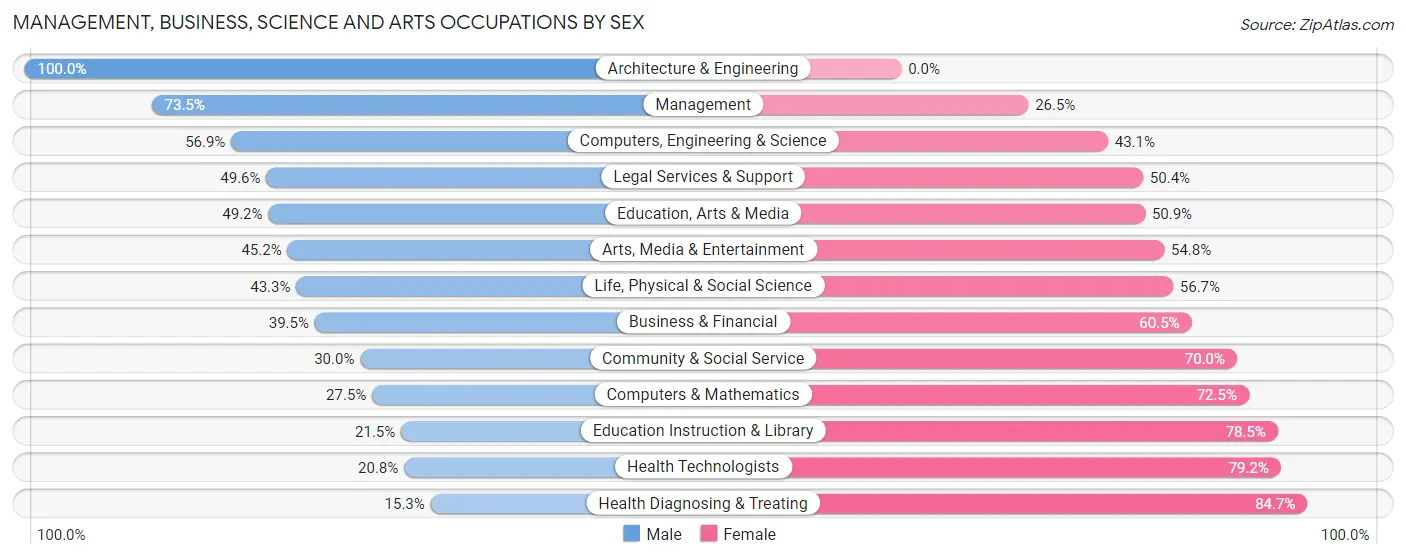
Management, Business, Science and Arts Occupations by Sex
Within the Management, Business, Science and Arts occupations in Chickasha, the most male-oriented occupations are Architecture & Engineering (100.0%), Management (73.5%), and Computers, Engineering & Science (56.9%), while the most female-oriented occupations are Health Diagnosing & Treating (84.7%), Health Technologists (79.2%), and Education Instruction & Library (78.5%).
| Occupation | Male | Female |
| Management | 466 (73.5%) | 168 (26.5%) |
| Business & Financial | 116 (39.5%) | 178 (60.5%) |
| Computers, Engineering & Science | 99 (56.9%) | 75 (43.1%) |
| Computers & Mathematics | 22 (27.5%) | 58 (72.5%) |
| Architecture & Engineering | 64 (100.0%) | 0 (0.0%) |
| Life, Physical & Social Science | 13 (43.3%) | 17 (56.7%) |
| Community & Social Service | 197 (30.0%) | 460 (70.0%) |
| Education, Arts & Media | 29 (49.1%) | 30 (50.8%) |
| Legal Services & Support | 57 (49.6%) | 58 (50.4%) |
| Education Instruction & Library | 97 (21.5%) | 355 (78.5%) |
| Arts, Media & Entertainment | 14 (45.2%) | 17 (54.8%) |
| Health Diagnosing & Treating | 75 (15.3%) | 415 (84.7%) |
| Health Technologists | 65 (20.8%) | 247 (79.2%) |
| Total (Category) | 953 (42.4%) | 1,296 (57.6%) |
| Total (Overall) | 3,887 (54.8%) | 3,211 (45.2%) |
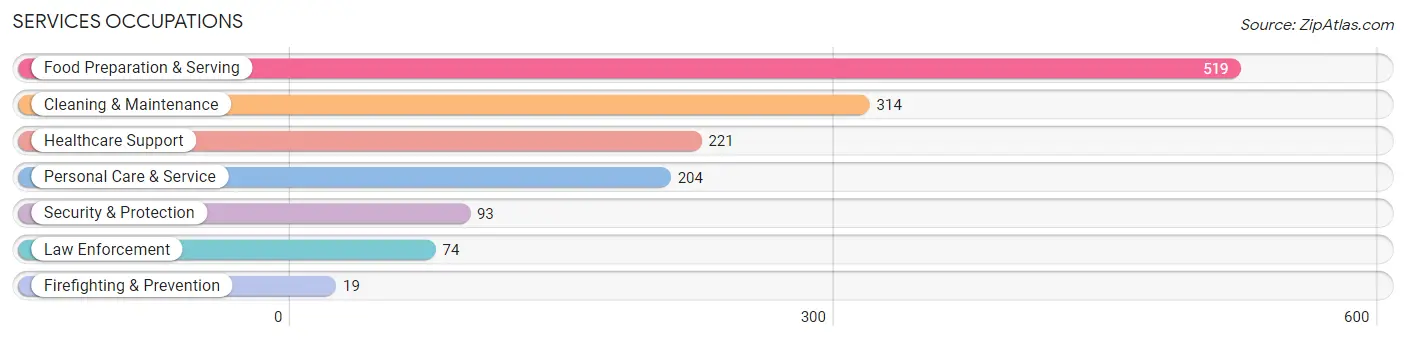
Services Occupations
The most common Services occupations in Chickasha are Food Preparation & Serving (519 | 7.3%), Cleaning & Maintenance (314 | 4.4%), Healthcare Support (221 | 3.1%), Personal Care & Service (204 | 2.9%), and Security & Protection (93 | 1.3%).
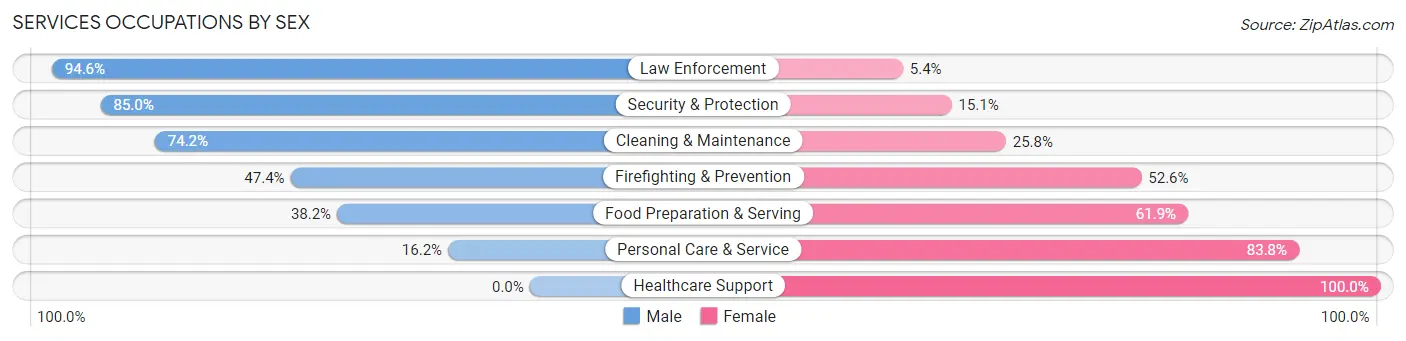
Services Occupations by Sex
Within the Services occupations in Chickasha, the most male-oriented occupations are Law Enforcement (94.6%), Security & Protection (85.0%), and Cleaning & Maintenance (74.2%), while the most female-oriented occupations are Healthcare Support (100.0%), Personal Care & Service (83.8%), and Food Preparation & Serving (61.9%).
| Occupation | Male | Female |
| Healthcare Support | 0 (0.0%) | 221 (100.0%) |
| Security & Protection | 79 (85.0%) | 14 (15.0%) |
| Firefighting & Prevention | 9 (47.4%) | 10 (52.6%) |
| Law Enforcement | 70 (94.6%) | 4 (5.4%) |
| Food Preparation & Serving | 198 (38.2%) | 321 (61.9%) |
| Cleaning & Maintenance | 233 (74.2%) | 81 (25.8%) |
| Personal Care & Service | 33 (16.2%) | 171 (83.8%) |
| Total (Category) | 543 (40.2%) | 808 (59.8%) |
| Total (Overall) | 3,887 (54.8%) | 3,211 (45.2%) |
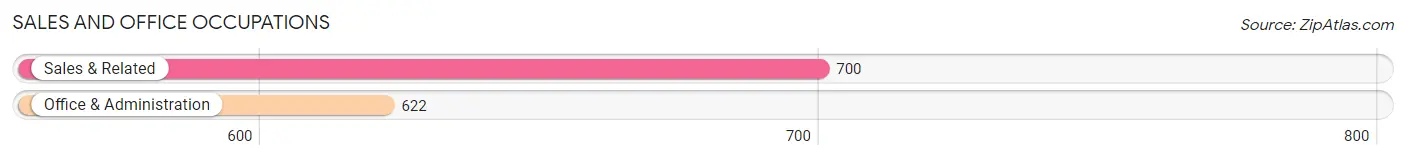
Sales and Office Occupations
The most common Sales and Office occupations in Chickasha are Sales & Related (700 | 9.9%), and Office & Administration (622 | 8.8%).
Sales and Office Occupations by Sex
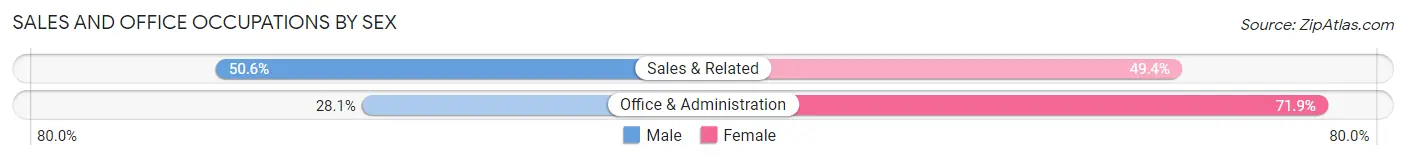
| Occupation | Male | Female |
| Sales & Related | 354 (50.6%) | 346 (49.4%) |
| Office & Administration | 175 (28.1%) | 447 (71.9%) |
| Total (Category) | 529 (40.0%) | 793 (60.0%) |
| Total (Overall) | 3,887 (54.8%) | 3,211 (45.2%) |
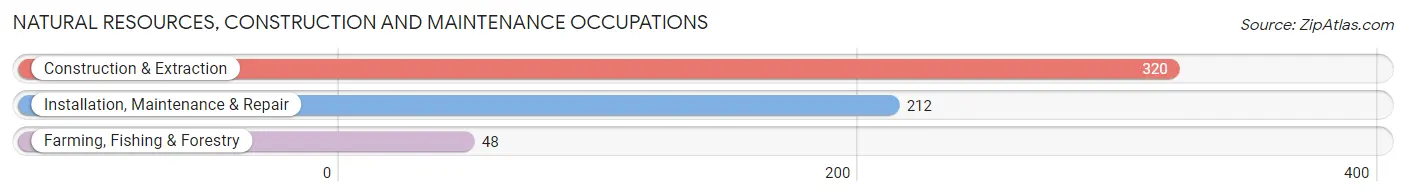
Natural Resources, Construction and Maintenance Occupations
The most common Natural Resources, Construction and Maintenance occupations in Chickasha are Construction & Extraction (320 | 4.5%), Installation, Maintenance & Repair (212 | 3.0%), and Farming, Fishing & Forestry (48 | 0.7%).
Natural Resources, Construction and Maintenance Occupations by Sex
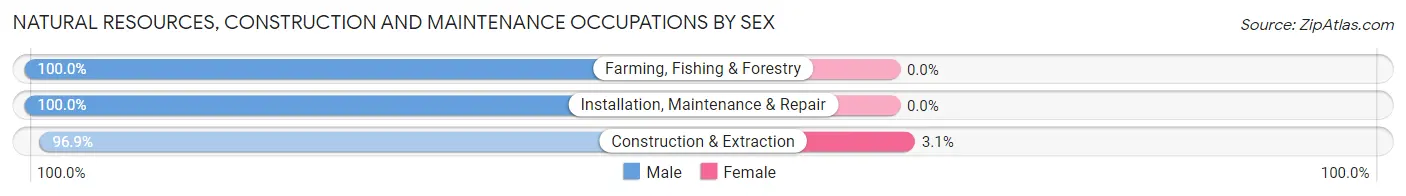
| Occupation | Male | Female |
| Farming, Fishing & Forestry | 48 (100.0%) | 0 (0.0%) |
| Construction & Extraction | 310 (96.9%) | 10 (3.1%) |
| Installation, Maintenance & Repair | 212 (100.0%) | 0 (0.0%) |
| Total (Category) | 570 (98.3%) | 10 (1.7%) |
| Total (Overall) | 3,887 (54.8%) | 3,211 (45.2%) |
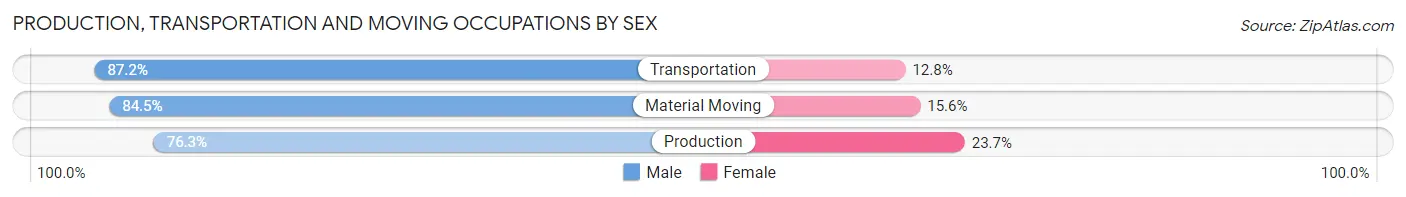
Production, Transportation and Moving Occupations
The most common Production, Transportation and Moving occupations in Chickasha are Production (759 | 10.7%), Material Moving (611 | 8.6%), and Transportation (226 | 3.2%).

Production, Transportation and Moving Occupations by Sex
| Occupation | Male | Female |
| Production | 579 (76.3%) | 180 (23.7%) |
| Transportation | 197 (87.2%) | 29 (12.8%) |
| Material Moving | 516 (84.5%) | 95 (15.5%) |
| Total (Category) | 1,292 (80.9%) | 304 (19.1%) |
| Total (Overall) | 3,887 (54.8%) | 3,211 (45.2%) |
Employment Industries by Sex in Chickasha
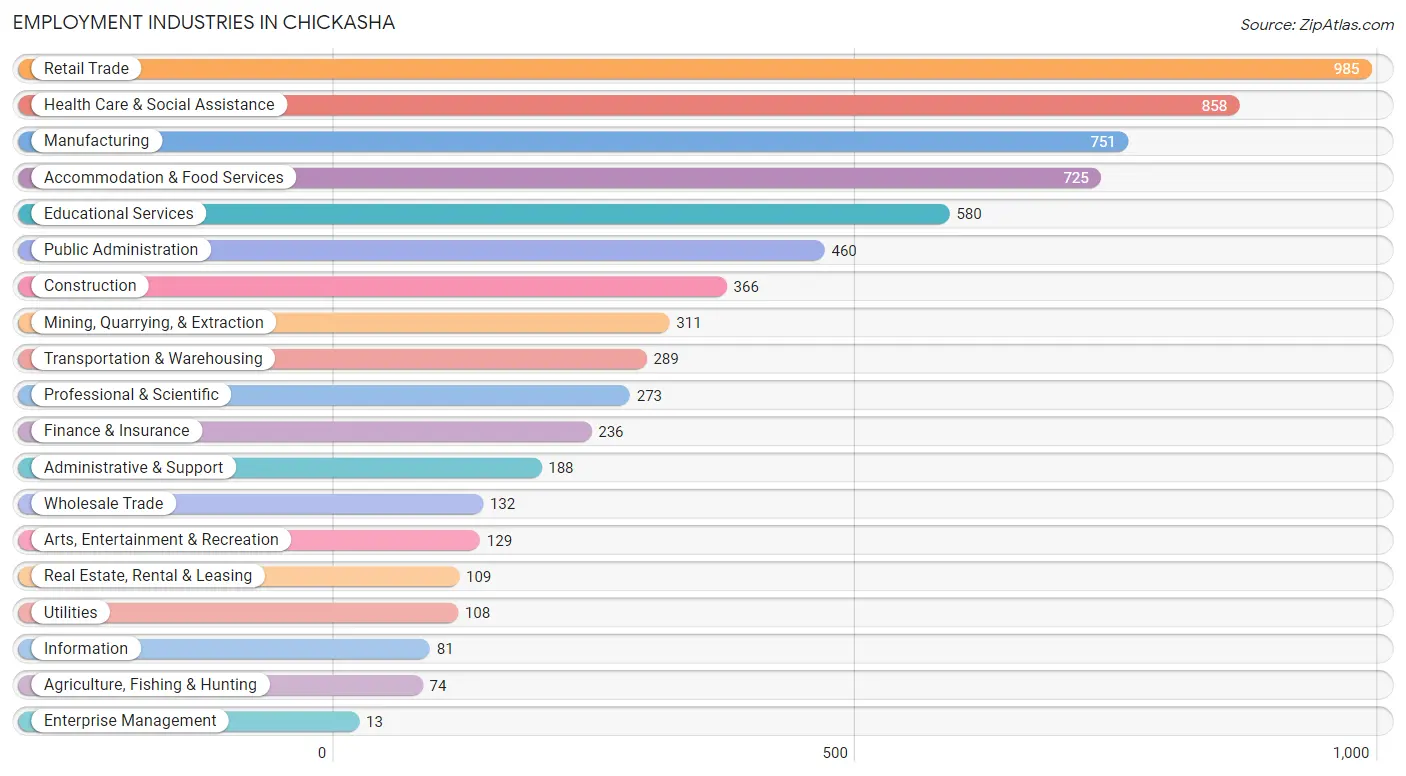
Employment Industries in Chickasha
The major employment industries in Chickasha include Retail Trade (985 | 13.9%), Health Care & Social Assistance (858 | 12.1%), Manufacturing (751 | 10.6%), Accommodation & Food Services (725 | 10.2%), and Educational Services (580 | 8.2%).
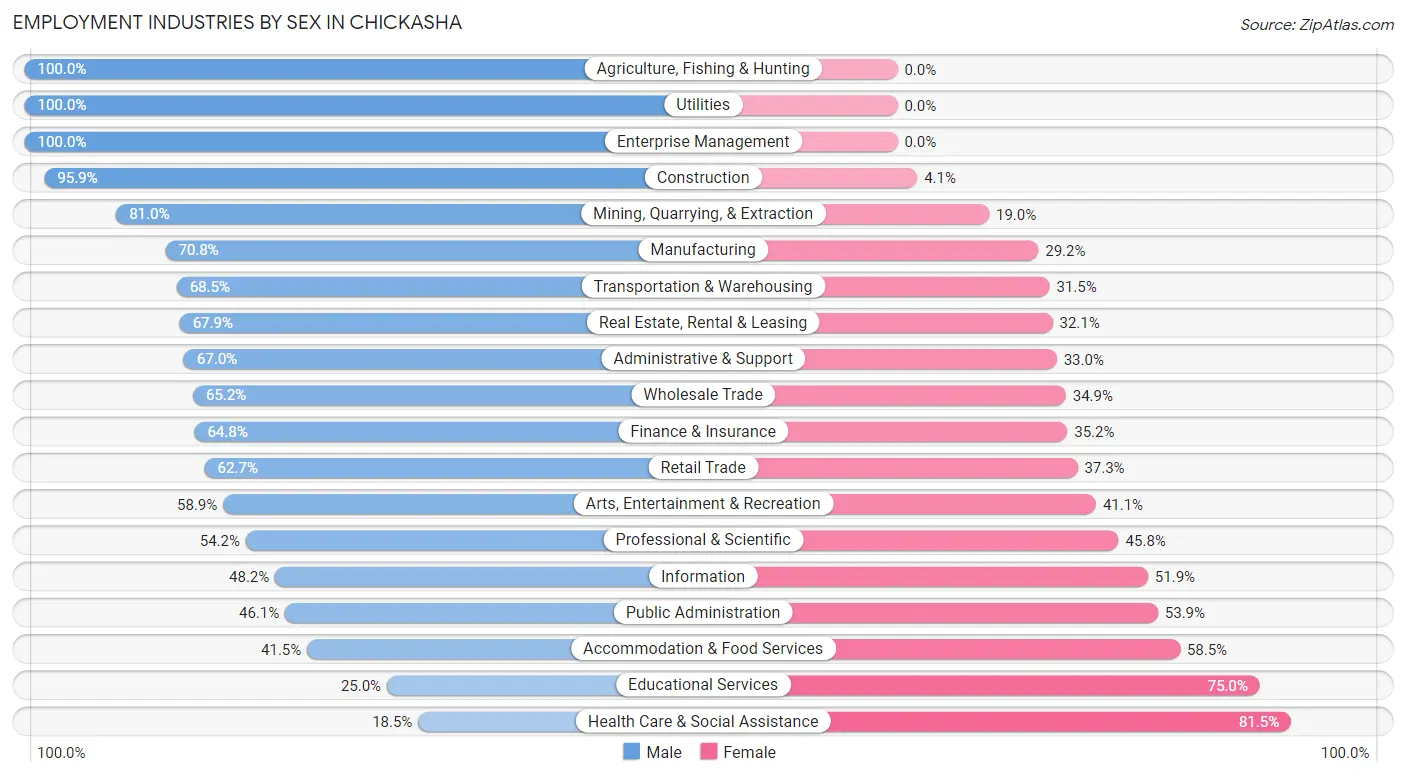
Employment Industries by Sex in Chickasha
The Chickasha industries that see more men than women are Agriculture, Fishing & Hunting (100.0%), Utilities (100.0%), and Enterprise Management (100.0%), whereas the industries that tend to have a higher number of women are Health Care & Social Assistance (81.5%), Educational Services (75.0%), and Accommodation & Food Services (58.5%).
| Industry | Male | Female |
| Agriculture, Fishing & Hunting | 74 (100.0%) | 0 (0.0%) |
| Mining, Quarrying, & Extraction | 252 (81.0%) | 59 (19.0%) |
| Construction | 351 (95.9%) | 15 (4.1%) |
| Manufacturing | 532 (70.8%) | 219 (29.2%) |
| Wholesale Trade | 86 (65.1%) | 46 (34.8%) |
| Retail Trade | 618 (62.7%) | 367 (37.3%) |
| Transportation & Warehousing | 198 (68.5%) | 91 (31.5%) |
| Utilities | 108 (100.0%) | 0 (0.0%) |
| Information | 39 (48.1%) | 42 (51.8%) |
| Finance & Insurance | 153 (64.8%) | 83 (35.2%) |
| Real Estate, Rental & Leasing | 74 (67.9%) | 35 (32.1%) |
| Professional & Scientific | 148 (54.2%) | 125 (45.8%) |
| Enterprise Management | 13 (100.0%) | 0 (0.0%) |
| Administrative & Support | 126 (67.0%) | 62 (33.0%) |
| Educational Services | 145 (25.0%) | 435 (75.0%) |
| Health Care & Social Assistance | 159 (18.5%) | 699 (81.5%) |
| Arts, Entertainment & Recreation | 76 (58.9%) | 53 (41.1%) |
| Accommodation & Food Services | 301 (41.5%) | 424 (58.5%) |
| Public Administration | 212 (46.1%) | 248 (53.9%) |
| Total | 3,887 (54.8%) | 3,211 (45.2%) |
Education in Chickasha
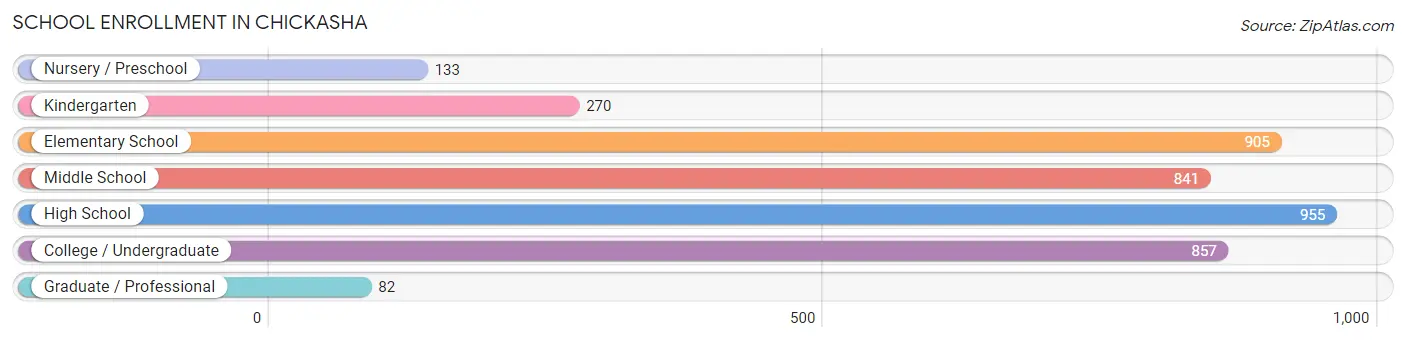
School Enrollment in Chickasha
The most common levels of schooling among the 4,043 students in Chickasha are high school (955 | 23.6%), elementary school (905 | 22.4%), and college / undergraduate (857 | 21.2%).
| School Level | # Students | % Students |
| Nursery / Preschool | 133 | 3.3% |
| Kindergarten | 270 | 6.7% |
| Elementary School | 905 | 22.4% |
| Middle School | 841 | 20.8% |
| High School | 955 | 23.6% |
| College / Undergraduate | 857 | 21.2% |
| Graduate / Professional | 82 | 2.0% |
| Total | 4,043 | 100.0% |
School Enrollment by Age by Funding Source in Chickasha
Out of a total of 4,043 students who are enrolled in schools in Chickasha, 154 (3.8%) attend a private institution, while the remaining 3,889 (96.2%) are enrolled in public schools. The age group of 35 years and over has the highest likelihood of being enrolled in private schools, with 24 (24.5% in the age bracket) enrolled. Conversely, the age group of 25 to 34 year olds has the lowest likelihood of being enrolled in a private school, with 87 (100.0% in the age bracket) attending a public institution.
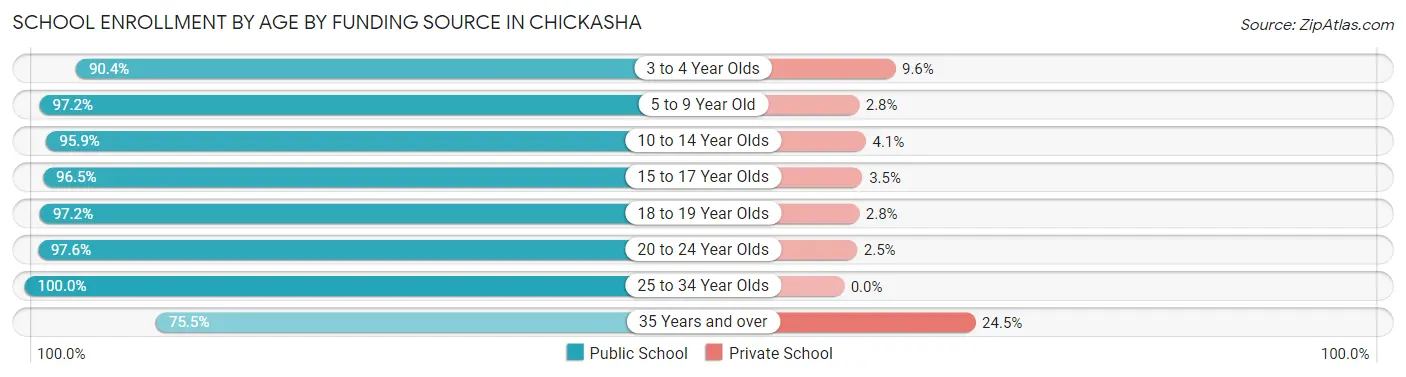
| Age Bracket | Public School | Private School |
| 3 to 4 Year Olds | 85 (90.4%) | 9 (9.6%) |
| 5 to 9 Year Old | 1,038 (97.2%) | 30 (2.8%) |
| 10 to 14 Year Olds | 944 (95.9%) | 40 (4.1%) |
| 15 to 17 Year Olds | 698 (96.5%) | 25 (3.5%) |
| 18 to 19 Year Olds | 446 (97.2%) | 13 (2.8%) |
| 20 to 24 Year Olds | 517 (97.6%) | 13 (2.5%) |
| 25 to 34 Year Olds | 87 (100.0%) | 0 (0.0%) |
| 35 Years and over | 74 (75.5%) | 24 (24.5%) |
| Total | 3,889 (96.2%) | 154 (3.8%) |
Educational Attainment by Field of Study in Chickasha
Education (605 | 27.7%), business (470 | 21.5%), arts & humanities (215 | 9.9%), science & technology (202 | 9.3%), and social sciences (174 | 8.0%) are the most common fields of study among 2,181 individuals in Chickasha who have obtained a bachelor's degree or higher.
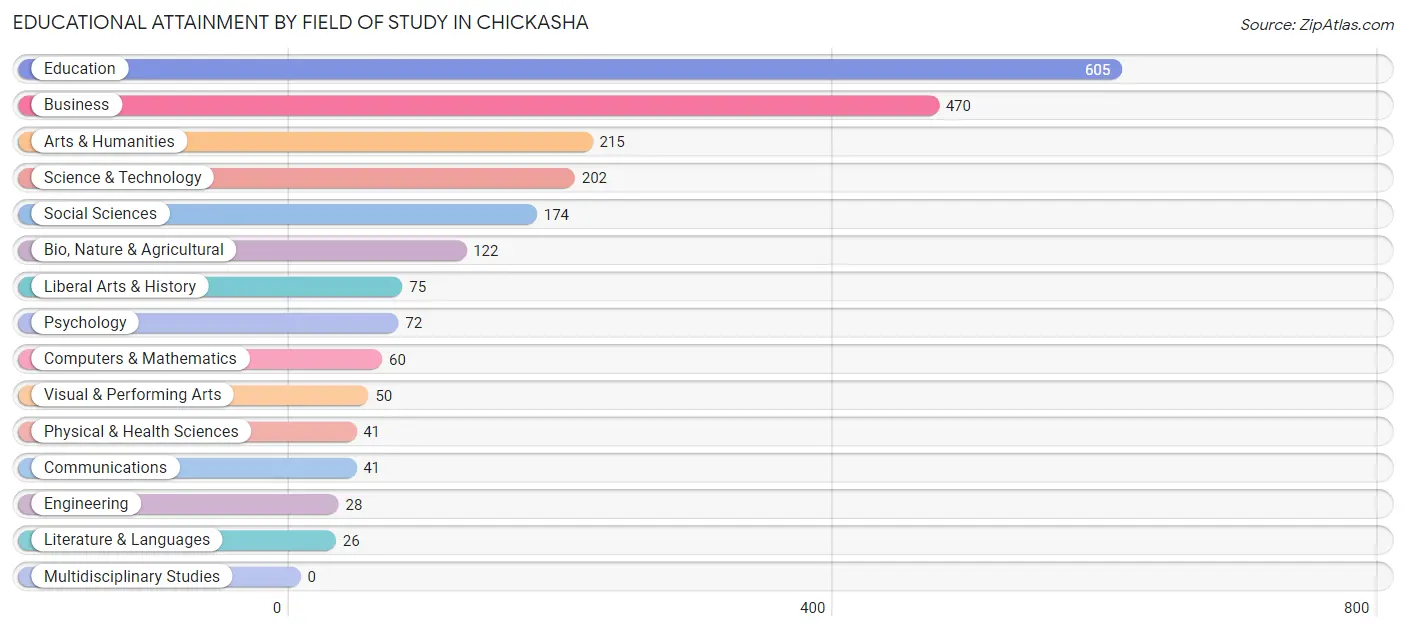
| Field of Study | # Graduates | % Graduates |
| Computers & Mathematics | 60 | 2.8% |
| Bio, Nature & Agricultural | 122 | 5.6% |
| Physical & Health Sciences | 41 | 1.9% |
| Psychology | 72 | 3.3% |
| Social Sciences | 174 | 8.0% |
| Engineering | 28 | 1.3% |
| Multidisciplinary Studies | 0 | 0.0% |
| Science & Technology | 202 | 9.3% |
| Business | 470 | 21.5% |
| Education | 605 | 27.7% |
| Literature & Languages | 26 | 1.2% |
| Liberal Arts & History | 75 | 3.4% |
| Visual & Performing Arts | 50 | 2.3% |
| Communications | 41 | 1.9% |
| Arts & Humanities | 215 | 9.9% |
| Total | 2,181 | 100.0% |
Transportation & Commute in Chickasha
Vehicle Availability by Sex in Chickasha
The most prevalent vehicle ownership categories in Chickasha are males with 2 vehicles (1,902, accounting for 49.7%) and females with 2 vehicles (1,328, making up 61.6%).
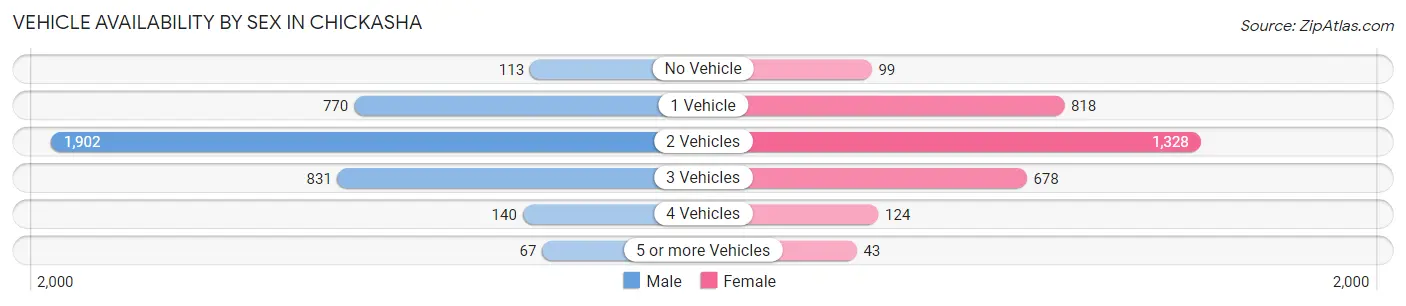
| Vehicles Available | Male | Female |
| No Vehicle | 113 (3.0%) | 99 (3.2%) |
| 1 Vehicle | 770 (20.1%) | 818 (26.5%) |
| 2 Vehicles | 1,902 (49.7%) | 1,328 (43.0%) |
| 3 Vehicles | 831 (21.7%) | 678 (21.9%) |
| 4 Vehicles | 140 (3.7%) | 124 (4.0%) |
| 5 or more Vehicles | 67 (1.8%) | 43 (1.4%) |
| Total | 3,823 (100.0%) | 3,090 (100.0%) |
Commute Time in Chickasha
The most frequently occuring commute durations in Chickasha are 5 to 9 minutes (1,960 commuters, 29.0%), 10 to 14 minutes (1,884 commuters, 27.9%), and 45 to 59 minutes (656 commuters, 9.7%).
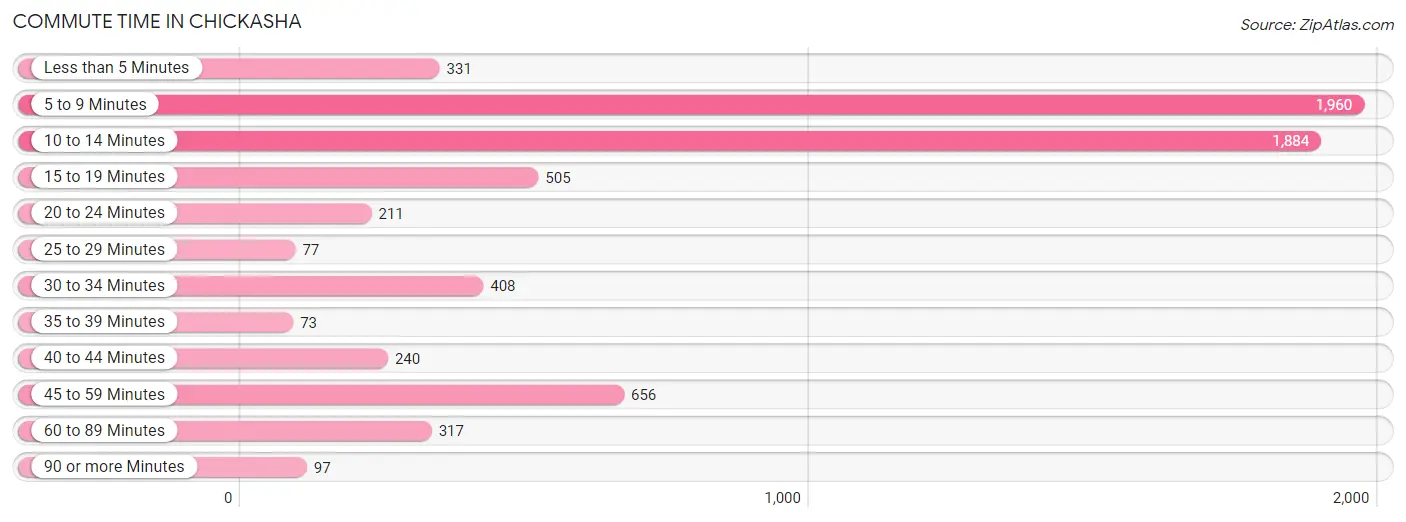
| Commute Time | # Commuters | % Commuters |
| Less than 5 Minutes | 331 | 4.9% |
| 5 to 9 Minutes | 1,960 | 29.0% |
| 10 to 14 Minutes | 1,884 | 27.9% |
| 15 to 19 Minutes | 505 | 7.5% |
| 20 to 24 Minutes | 211 | 3.1% |
| 25 to 29 Minutes | 77 | 1.1% |
| 30 to 34 Minutes | 408 | 6.0% |
| 35 to 39 Minutes | 73 | 1.1% |
| 40 to 44 Minutes | 240 | 3.5% |
| 45 to 59 Minutes | 656 | 9.7% |
| 60 to 89 Minutes | 317 | 4.7% |
| 90 or more Minutes | 97 | 1.4% |
Commute Time by Sex in Chickasha
The most common commute times in Chickasha are 10 to 14 minutes (1,020 commuters, 27.1%) for males and 5 to 9 minutes (1,033 commuters, 34.4%) for females.
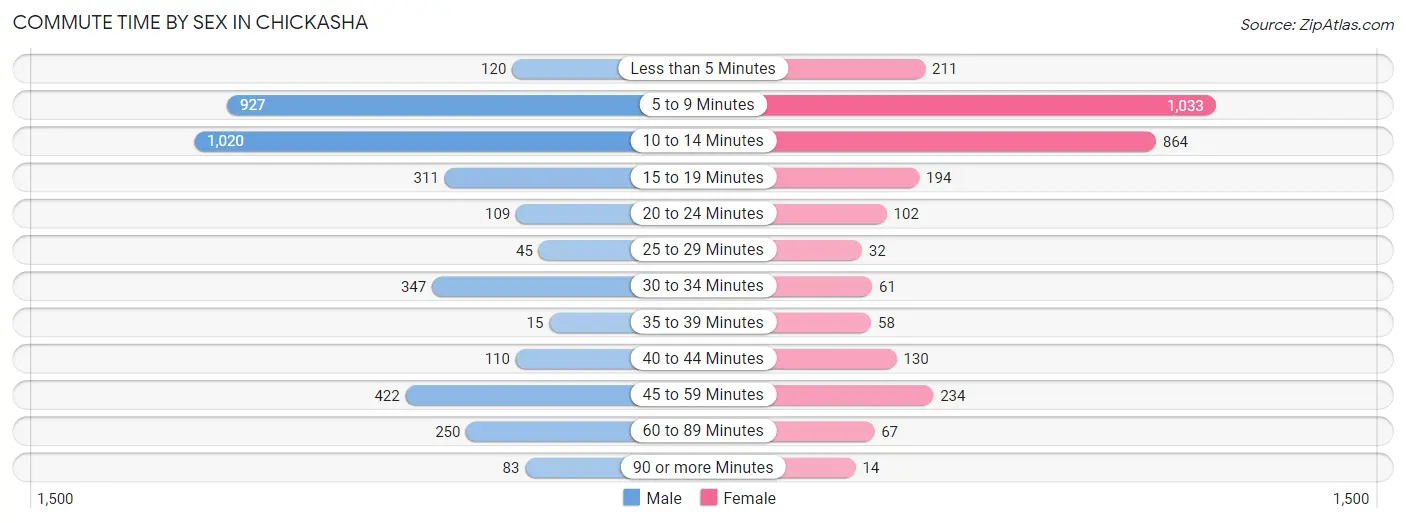
| Commute Time | Male | Female |
| Less than 5 Minutes | 120 (3.2%) | 211 (7.0%) |
| 5 to 9 Minutes | 927 (24.7%) | 1,033 (34.4%) |
| 10 to 14 Minutes | 1,020 (27.1%) | 864 (28.8%) |
| 15 to 19 Minutes | 311 (8.3%) | 194 (6.5%) |
| 20 to 24 Minutes | 109 (2.9%) | 102 (3.4%) |
| 25 to 29 Minutes | 45 (1.2%) | 32 (1.1%) |
| 30 to 34 Minutes | 347 (9.2%) | 61 (2.0%) |
| 35 to 39 Minutes | 15 (0.4%) | 58 (1.9%) |
| 40 to 44 Minutes | 110 (2.9%) | 130 (4.3%) |
| 45 to 59 Minutes | 422 (11.2%) | 234 (7.8%) |
| 60 to 89 Minutes | 250 (6.7%) | 67 (2.2%) |
| 90 or more Minutes | 83 (2.2%) | 14 (0.5%) |
Time of Departure to Work by Sex in Chickasha
The most frequent times of departure to work in Chickasha are 7:30 AM to 7:59 AM (503, 13.4%) for males and 7:00 AM to 7:29 AM (537, 17.9%) for females.
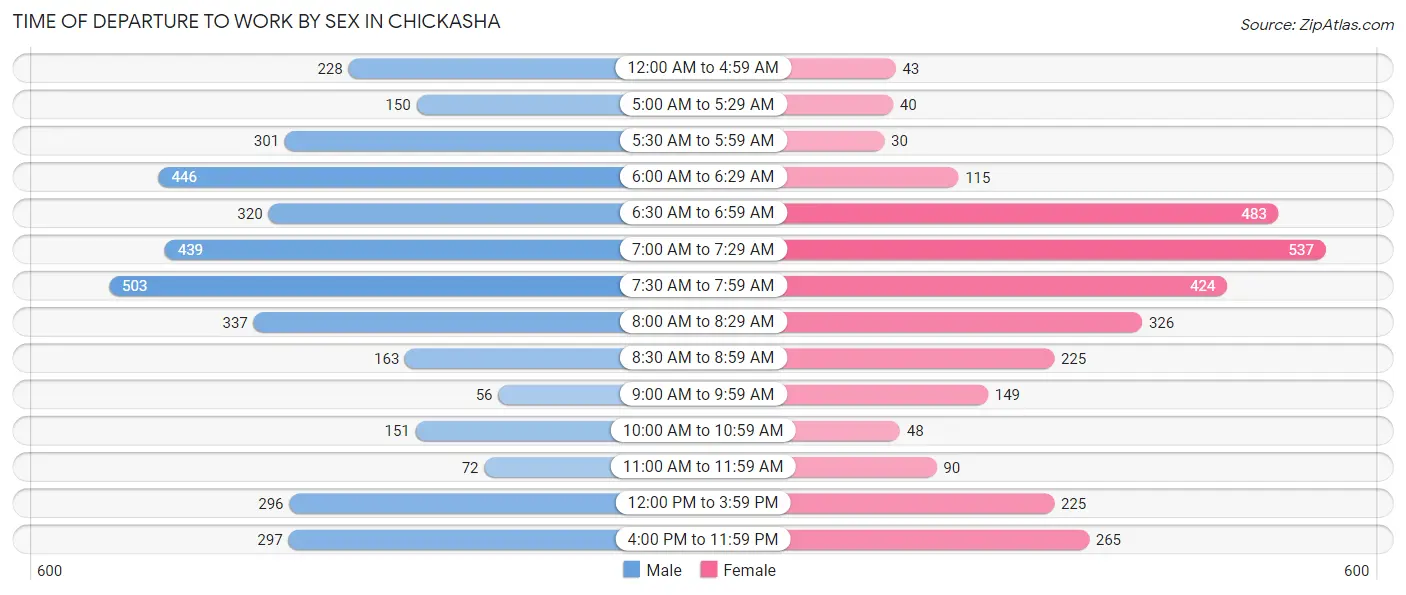
| Time of Departure | Male | Female |
| 12:00 AM to 4:59 AM | 228 (6.1%) | 43 (1.4%) |
| 5:00 AM to 5:29 AM | 150 (4.0%) | 40 (1.3%) |
| 5:30 AM to 5:59 AM | 301 (8.0%) | 30 (1.0%) |
| 6:00 AM to 6:29 AM | 446 (11.9%) | 115 (3.8%) |
| 6:30 AM to 6:59 AM | 320 (8.5%) | 483 (16.1%) |
| 7:00 AM to 7:29 AM | 439 (11.7%) | 537 (17.9%) |
| 7:30 AM to 7:59 AM | 503 (13.4%) | 424 (14.1%) |
| 8:00 AM to 8:29 AM | 337 (9.0%) | 326 (10.9%) |
| 8:30 AM to 8:59 AM | 163 (4.3%) | 225 (7.5%) |
| 9:00 AM to 9:59 AM | 56 (1.5%) | 149 (5.0%) |
| 10:00 AM to 10:59 AM | 151 (4.0%) | 48 (1.6%) |
| 11:00 AM to 11:59 AM | 72 (1.9%) | 90 (3.0%) |
| 12:00 PM to 3:59 PM | 296 (7.9%) | 225 (7.5%) |
| 4:00 PM to 11:59 PM | 297 (7.9%) | 265 (8.8%) |
| Total | 3,759 (100.0%) | 3,000 (100.0%) |
Housing Occupancy in Chickasha
Occupancy by Ownership in Chickasha
Of the total 6,222 dwellings in Chickasha, owner-occupied units account for 3,237 (52.0%), while renter-occupied units make up 2,985 (48.0%).
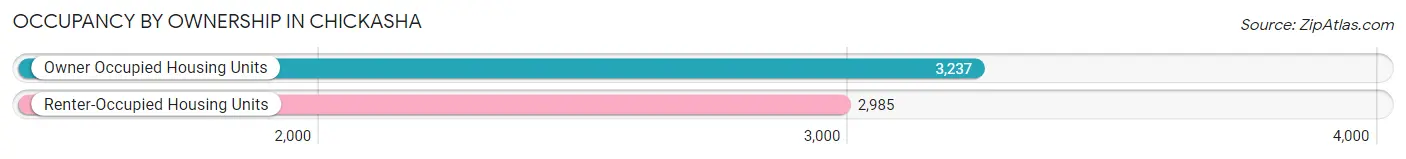
| Occupancy | # Housing Units | % Housing Units |
| Owner Occupied Housing Units | 3,237 | 52.0% |
| Renter-Occupied Housing Units | 2,985 | 48.0% |
| Total Occupied Housing Units | 6,222 | 100.0% |
Occupancy by Household Size in Chickasha
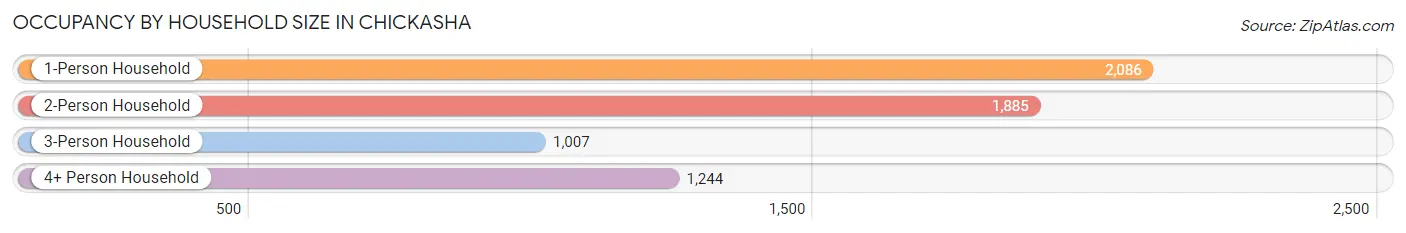
| Household Size | # Housing Units | % Housing Units |
| 1-Person Household | 2,086 | 33.5% |
| 2-Person Household | 1,885 | 30.3% |
| 3-Person Household | 1,007 | 16.2% |
| 4+ Person Household | 1,244 | 20.0% |
| Total Housing Units | 6,222 | 100.0% |
Occupancy by Ownership by Household Size in Chickasha
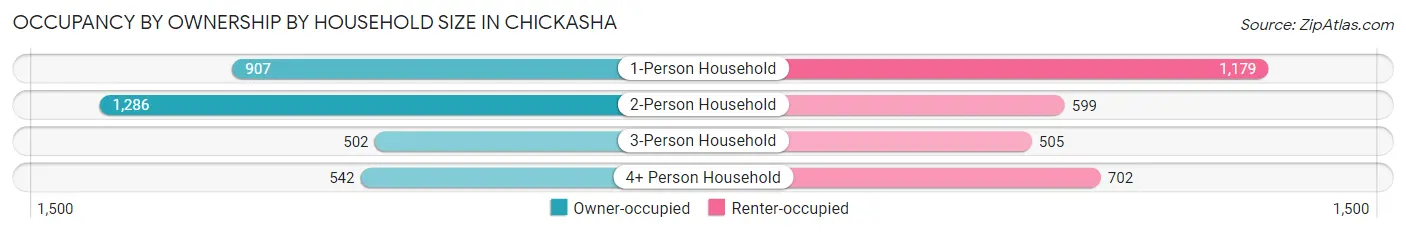
| Household Size | Owner-occupied | Renter-occupied |
| 1-Person Household | 907 (43.5%) | 1,179 (56.5%) |
| 2-Person Household | 1,286 (68.2%) | 599 (31.8%) |
| 3-Person Household | 502 (49.8%) | 505 (50.1%) |
| 4+ Person Household | 542 (43.6%) | 702 (56.4%) |
| Total Housing Units | 3,237 (52.0%) | 2,985 (48.0%) |
Occupancy by Educational Attainment in Chickasha
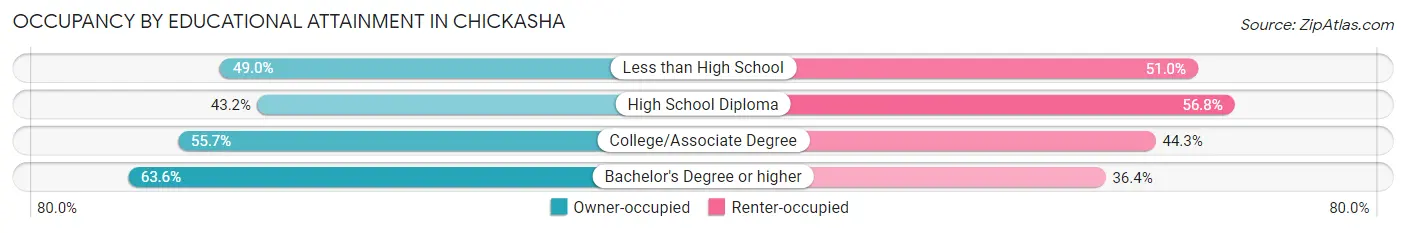
| Household Size | Owner-occupied | Renter-occupied |
| Less than High School | 312 (49.0%) | 325 (51.0%) |
| High School Diploma | 1,032 (43.2%) | 1,359 (56.8%) |
| College/Associate Degree | 978 (55.7%) | 778 (44.3%) |
| Bachelor's Degree or higher | 915 (63.6%) | 523 (36.4%) |
Occupancy by Age of Householder in Chickasha
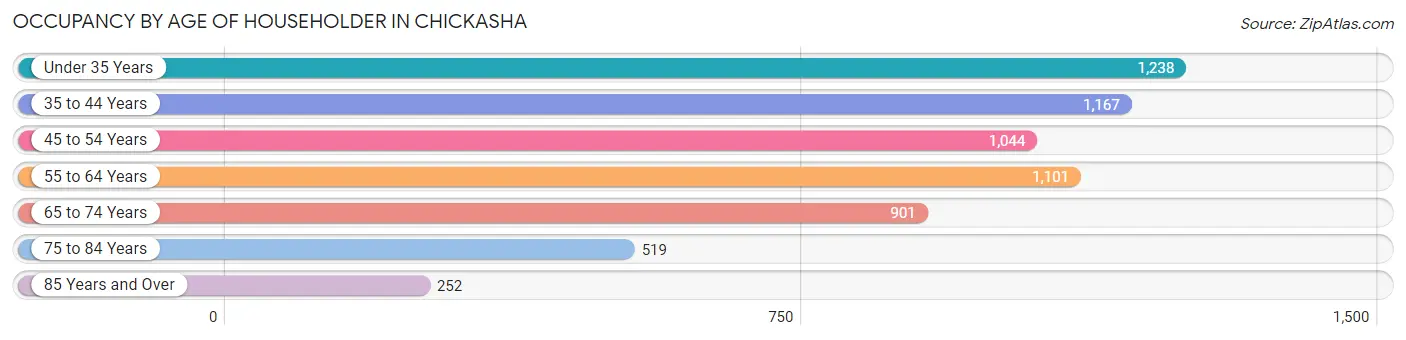
| Age Bracket | # Households | % Households |
| Under 35 Years | 1,238 | 19.9% |
| 35 to 44 Years | 1,167 | 18.8% |
| 45 to 54 Years | 1,044 | 16.8% |
| 55 to 64 Years | 1,101 | 17.7% |
| 65 to 74 Years | 901 | 14.5% |
| 75 to 84 Years | 519 | 8.3% |
| 85 Years and Over | 252 | 4.1% |
| Total | 6,222 | 100.0% |
Housing Finances in Chickasha
Median Income by Occupancy in Chickasha
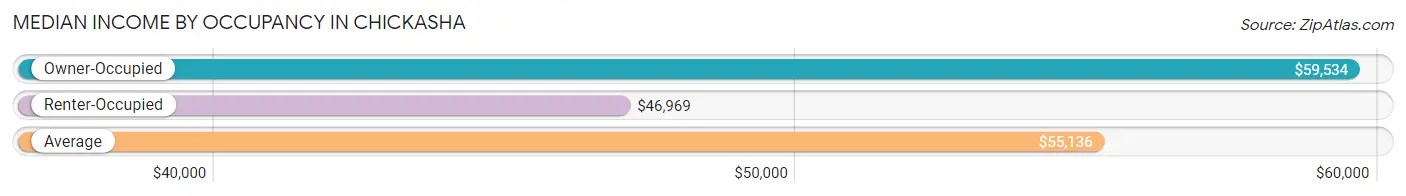
| Occupancy Type | # Households | Median Income |
| Owner-Occupied | 3,237 (52.0%) | $59,534 |
| Renter-Occupied | 2,985 (48.0%) | $46,969 |
| Average | 6,222 (100.0%) | $55,136 |
Occupancy by Householder Income Bracket in Chickasha
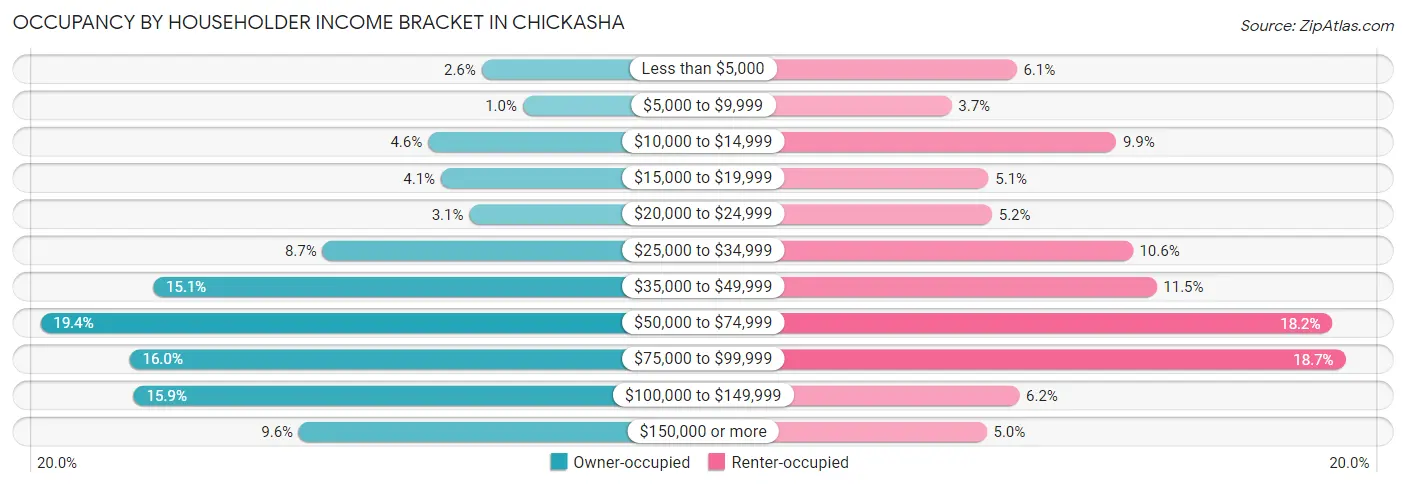
| Income Bracket | Owner-occupied | Renter-occupied |
| Less than $5,000 | 84 (2.6%) | 183 (6.1%) |
| $5,000 to $9,999 | 33 (1.0%) | 109 (3.6%) |
| $10,000 to $14,999 | 150 (4.6%) | 296 (9.9%) |
| $15,000 to $19,999 | 134 (4.1%) | 151 (5.1%) |
| $20,000 to $24,999 | 99 (3.1%) | 155 (5.2%) |
| $25,000 to $34,999 | 280 (8.6%) | 315 (10.5%) |
| $35,000 to $49,999 | 489 (15.1%) | 342 (11.5%) |
| $50,000 to $74,999 | 628 (19.4%) | 542 (18.2%) |
| $75,000 to $99,999 | 518 (16.0%) | 557 (18.7%) |
| $100,000 to $149,999 | 513 (15.9%) | 186 (6.2%) |
| $150,000 or more | 309 (9.6%) | 149 (5.0%) |
| Total | 3,237 (100.0%) | 2,985 (100.0%) |
Monthly Housing Cost Tiers in Chickasha
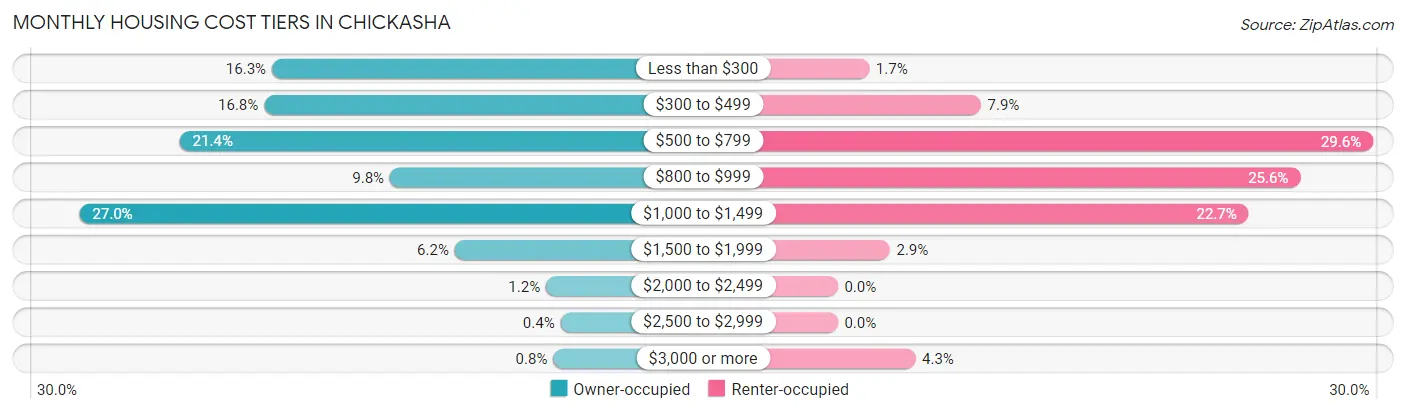
| Monthly Cost | Owner-occupied | Renter-occupied |
| Less than $300 | 529 (16.3%) | 52 (1.7%) |
| $300 to $499 | 543 (16.8%) | 236 (7.9%) |
| $500 to $799 | 694 (21.4%) | 883 (29.6%) |
| $800 to $999 | 318 (9.8%) | 763 (25.6%) |
| $1,000 to $1,499 | 873 (27.0%) | 678 (22.7%) |
| $1,500 to $1,999 | 202 (6.2%) | 86 (2.9%) |
| $2,000 to $2,499 | 39 (1.2%) | 0 (0.0%) |
| $2,500 to $2,999 | 13 (0.4%) | 0 (0.0%) |
| $3,000 or more | 26 (0.8%) | 128 (4.3%) |
| Total | 3,237 (100.0%) | 2,985 (100.0%) |
Physical Housing Characteristics in Chickasha
Housing Structures in Chickasha
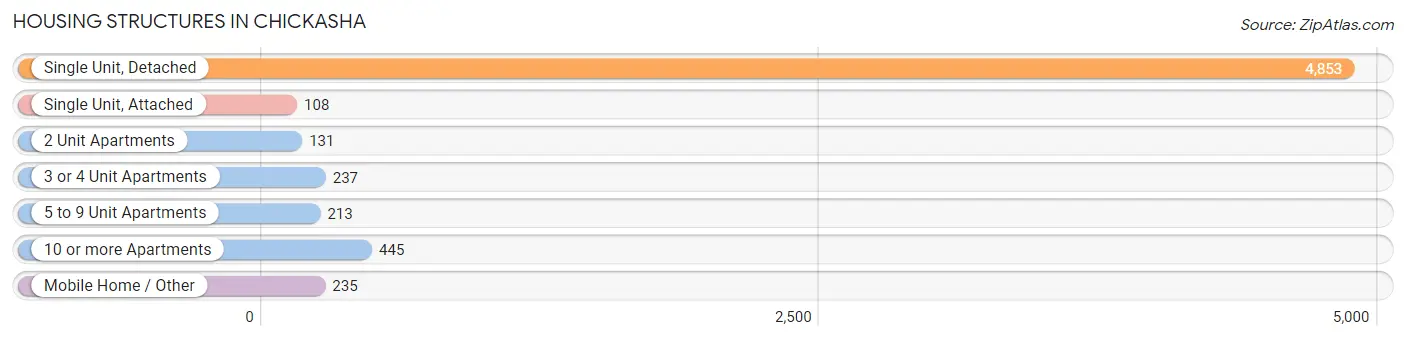
| Structure Type | # Housing Units | % Housing Units |
| Single Unit, Detached | 4,853 | 78.0% |
| Single Unit, Attached | 108 | 1.7% |
| 2 Unit Apartments | 131 | 2.1% |
| 3 or 4 Unit Apartments | 237 | 3.8% |
| 5 to 9 Unit Apartments | 213 | 3.4% |
| 10 or more Apartments | 445 | 7.1% |
| Mobile Home / Other | 235 | 3.8% |
| Total | 6,222 | 100.0% |
Housing Structures by Occupancy in Chickasha
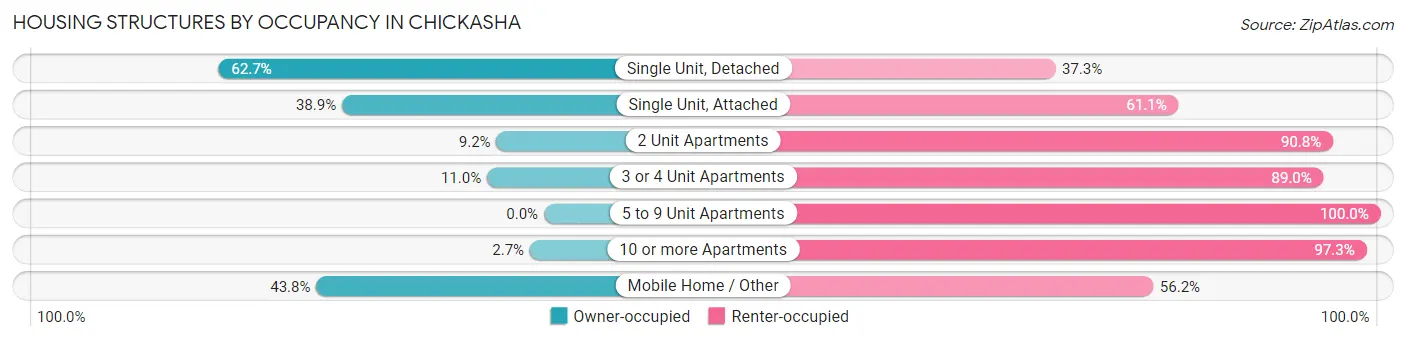
| Structure Type | Owner-occupied | Renter-occupied |
| Single Unit, Detached | 3,042 (62.7%) | 1,811 (37.3%) |
| Single Unit, Attached | 42 (38.9%) | 66 (61.1%) |
| 2 Unit Apartments | 12 (9.2%) | 119 (90.8%) |
| 3 or 4 Unit Apartments | 26 (11.0%) | 211 (89.0%) |
| 5 to 9 Unit Apartments | 0 (0.0%) | 213 (100.0%) |
| 10 or more Apartments | 12 (2.7%) | 433 (97.3%) |
| Mobile Home / Other | 103 (43.8%) | 132 (56.2%) |
| Total | 3,237 (52.0%) | 2,985 (48.0%) |
Housing Structures by Number of Rooms in Chickasha
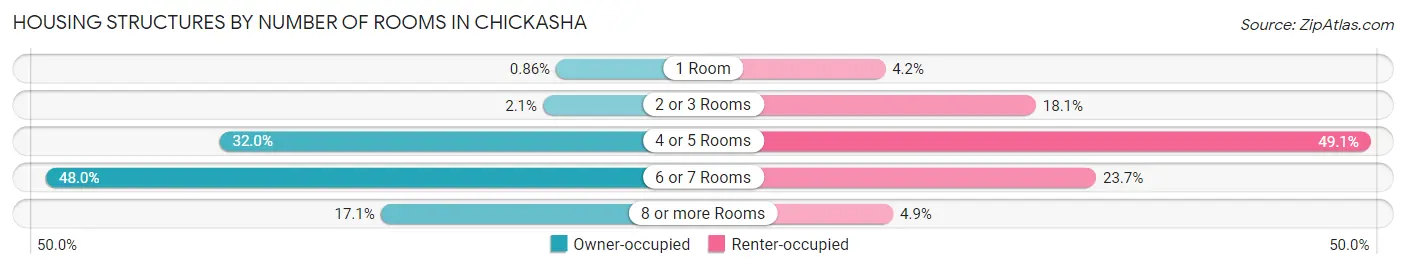
| Number of Rooms | Owner-occupied | Renter-occupied |
| 1 Room | 28 (0.9%) | 125 (4.2%) |
| 2 or 3 Rooms | 67 (2.1%) | 541 (18.1%) |
| 4 or 5 Rooms | 1,035 (32.0%) | 1,465 (49.1%) |
| 6 or 7 Rooms | 1,554 (48.0%) | 707 (23.7%) |
| 8 or more Rooms | 553 (17.1%) | 147 (4.9%) |
| Total | 3,237 (100.0%) | 2,985 (100.0%) |
Housing Structure by Heating Type in Chickasha
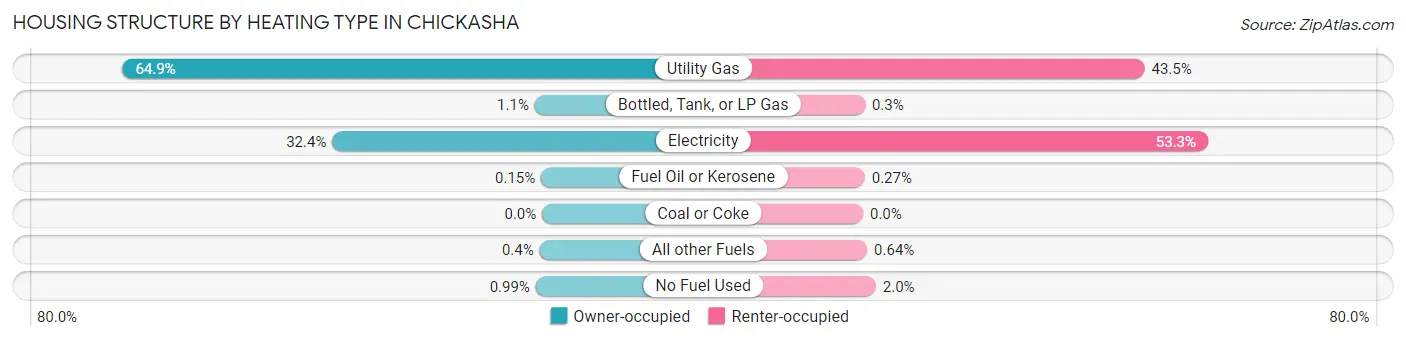
| Heating Type | Owner-occupied | Renter-occupied |
| Utility Gas | 2,100 (64.9%) | 1,299 (43.5%) |
| Bottled, Tank, or LP Gas | 37 (1.1%) | 9 (0.3%) |
| Electricity | 1,050 (32.4%) | 1,591 (53.3%) |
| Fuel Oil or Kerosene | 5 (0.2%) | 8 (0.3%) |
| Coal or Coke | 0 (0.0%) | 0 (0.0%) |
| All other Fuels | 13 (0.4%) | 19 (0.6%) |
| No Fuel Used | 32 (1.0%) | 59 (2.0%) |
| Total | 3,237 (100.0%) | 2,985 (100.0%) |
Household Vehicle Usage in Chickasha
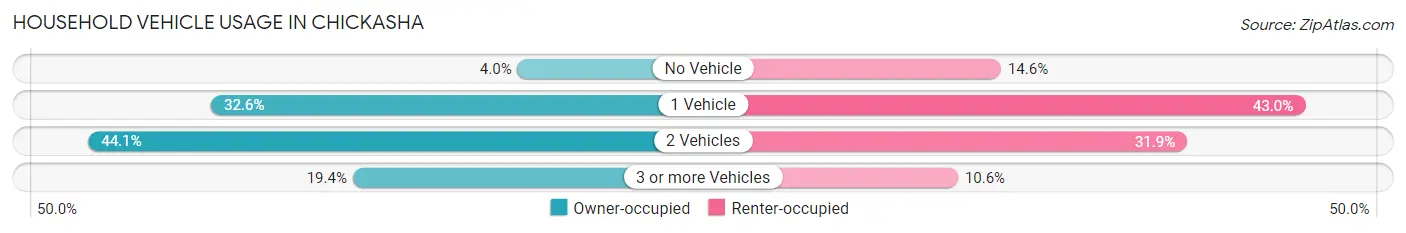
| Vehicles per Household | Owner-occupied | Renter-occupied |
| No Vehicle | 129 (4.0%) | 435 (14.6%) |
| 1 Vehicle | 1,055 (32.6%) | 1,282 (42.9%) |
| 2 Vehicles | 1,426 (44.1%) | 953 (31.9%) |
| 3 or more Vehicles | 627 (19.4%) | 315 (10.5%) |
| Total | 3,237 (100.0%) | 2,985 (100.0%) |
Real Estate & Mortgages in Chickasha
Real Estate and Mortgage Overview in Chickasha
| Characteristic | Without Mortgage | With Mortgage |
| Housing Units | 1,492 | 1,745 |
| Median Property Value | $89,300 | $124,000 |
| Median Household Income | $48,681 | $153 |
| Monthly Housing Costs | $369 | $26 |
| Real Estate Taxes | $620 | $71 |
Property Value by Mortgage Status in Chickasha
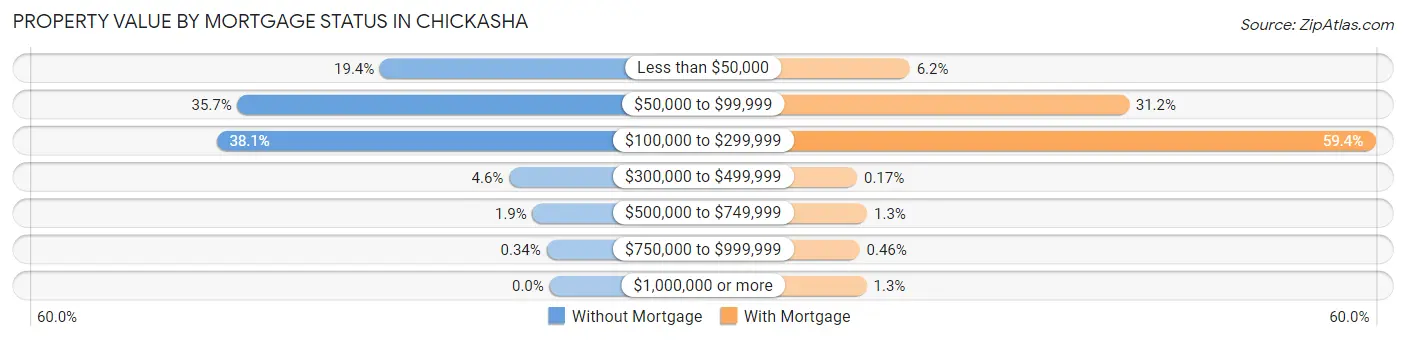
| Property Value | Without Mortgage | With Mortgage |
| Less than $50,000 | 289 (19.4%) | 108 (6.2%) |
| $50,000 to $99,999 | 532 (35.7%) | 545 (31.2%) |
| $100,000 to $299,999 | 568 (38.1%) | 1,036 (59.4%) |
| $300,000 to $499,999 | 69 (4.6%) | 3 (0.2%) |
| $500,000 to $749,999 | 29 (1.9%) | 23 (1.3%) |
| $750,000 to $999,999 | 5 (0.3%) | 8 (0.5%) |
| $1,000,000 or more | 0 (0.0%) | 22 (1.3%) |
| Total | 1,492 (100.0%) | 1,745 (100.0%) |
Household Income by Mortgage Status in Chickasha
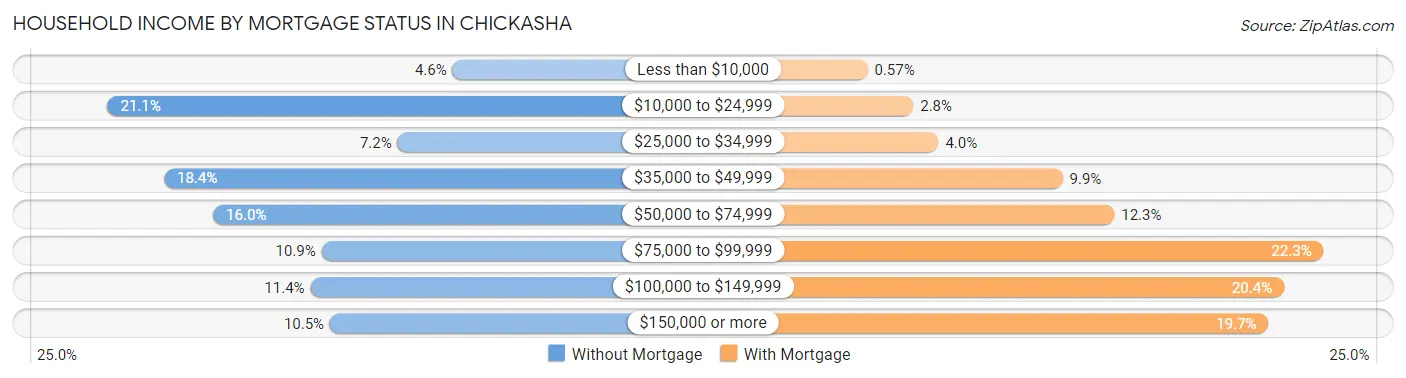
| Household Income | Without Mortgage | With Mortgage |
| Less than $10,000 | 69 (4.6%) | 10 (0.6%) |
| $10,000 to $24,999 | 314 (21.0%) | 48 (2.8%) |
| $25,000 to $34,999 | 108 (7.2%) | 69 (4.0%) |
| $35,000 to $49,999 | 274 (18.4%) | 172 (9.9%) |
| $50,000 to $74,999 | 239 (16.0%) | 215 (12.3%) |
| $75,000 to $99,999 | 162 (10.9%) | 389 (22.3%) |
| $100,000 to $149,999 | 170 (11.4%) | 356 (20.4%) |
| $150,000 or more | 156 (10.5%) | 343 (19.7%) |
| Total | 1,492 (100.0%) | 1,745 (100.0%) |
Property Value to Household Income Ratio in Chickasha
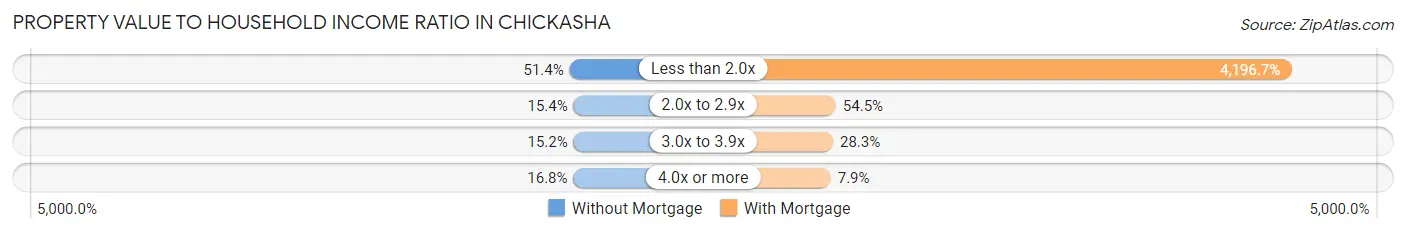
| Value-to-Income Ratio | Without Mortgage | With Mortgage |
| Less than 2.0x | 767 (51.4%) | 73,233 (4,196.7%) |
| 2.0x to 2.9x | 229 (15.3%) | 951 (54.5%) |
| 3.0x to 3.9x | 226 (15.1%) | 493 (28.2%) |
| 4.0x or more | 251 (16.8%) | 137 (7.9%) |
| Total | 1,492 (100.0%) | 1,745 (100.0%) |
Real Estate Taxes by Mortgage Status in Chickasha
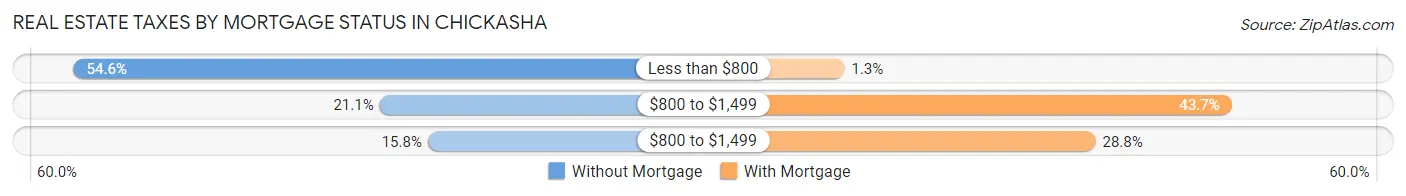
| Property Taxes | Without Mortgage | With Mortgage |
| Less than $800 | 815 (54.6%) | 22 (1.3%) |
| $800 to $1,499 | 315 (21.1%) | 762 (43.7%) |
| $800 to $1,499 | 236 (15.8%) | 502 (28.8%) |
| Total | 1,492 (100.0%) | 1,745 (100.0%) |
Health & Disability in Chickasha
Health Insurance Coverage by Age in Chickasha
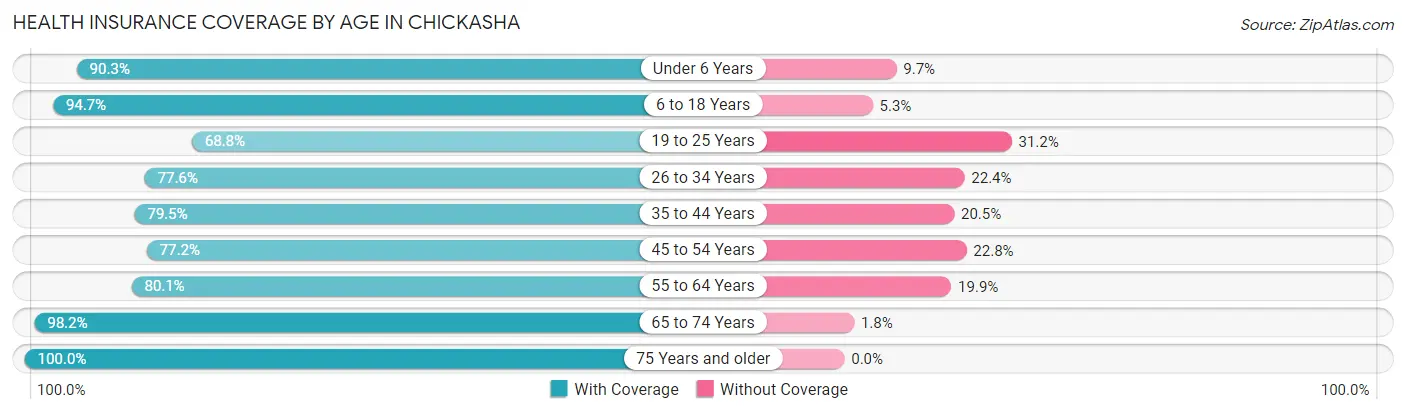
| Age Bracket | With Coverage | Without Coverage |
| Under 6 Years | 772 (90.3%) | 83 (9.7%) |
| 6 to 18 Years | 2,870 (94.7%) | 160 (5.3%) |
| 19 to 25 Years | 1,240 (68.8%) | 562 (31.2%) |
| 26 to 34 Years | 1,515 (77.6%) | 437 (22.4%) |
| 35 to 44 Years | 1,703 (79.5%) | 438 (20.5%) |
| 45 to 54 Years | 1,336 (77.2%) | 394 (22.8%) |
| 55 to 64 Years | 1,583 (80.1%) | 394 (19.9%) |
| 65 to 74 Years | 1,248 (98.2%) | 23 (1.8%) |
| 75 Years and older | 1,030 (100.0%) | 0 (0.0%) |
| Total | 13,297 (84.2%) | 2,491 (15.8%) |
Health Insurance Coverage by Citizenship Status in Chickasha
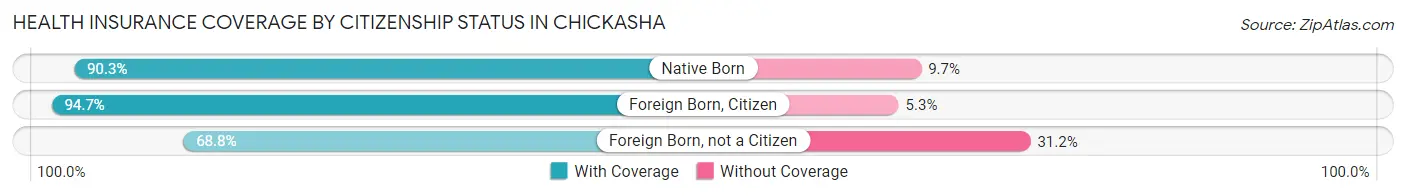
| Citizenship Status | With Coverage | Without Coverage |
| Native Born | 772 (90.3%) | 83 (9.7%) |
| Foreign Born, Citizen | 2,870 (94.7%) | 160 (5.3%) |
| Foreign Born, not a Citizen | 1,240 (68.8%) | 562 (31.2%) |
Health Insurance Coverage by Household Income in Chickasha
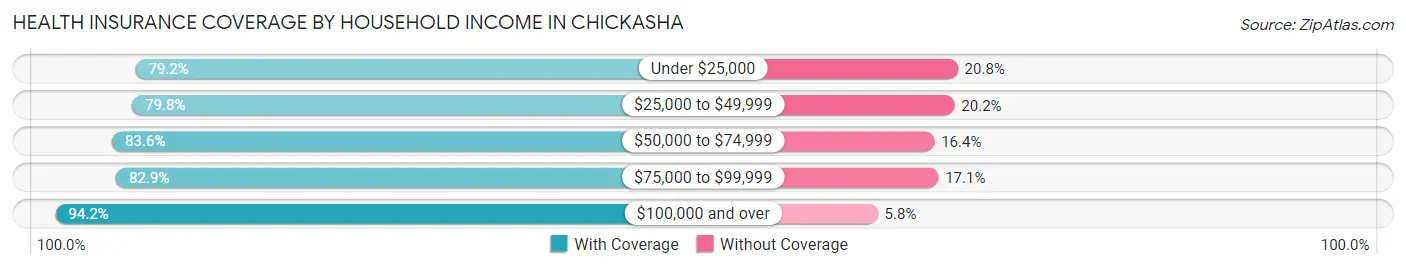
| Household Income | With Coverage | Without Coverage |
| Under $25,000 | 1,861 (79.2%) | 488 (20.8%) |
| $25,000 to $49,999 | 2,851 (79.8%) | 720 (20.2%) |
| $50,000 to $74,999 | 2,394 (83.6%) | 469 (16.4%) |
| $75,000 to $99,999 | 2,520 (82.9%) | 521 (17.1%) |
| $100,000 and over | 3,392 (94.2%) | 208 (5.8%) |
Public vs Private Health Insurance Coverage by Age in Chickasha
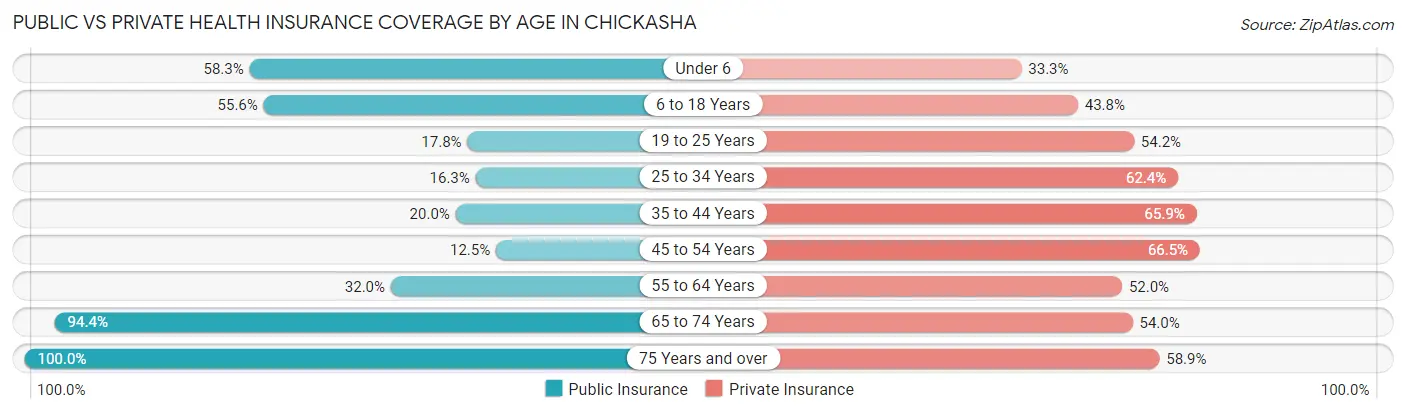
| Age Bracket | Public Insurance | Private Insurance |
| Under 6 | 498 (58.3%) | 285 (33.3%) |
| 6 to 18 Years | 1,686 (55.6%) | 1,327 (43.8%) |
| 19 to 25 Years | 321 (17.8%) | 977 (54.2%) |
| 25 to 34 Years | 318 (16.3%) | 1,218 (62.4%) |
| 35 to 44 Years | 428 (20.0%) | 1,410 (65.9%) |
| 45 to 54 Years | 216 (12.5%) | 1,150 (66.5%) |
| 55 to 64 Years | 633 (32.0%) | 1,028 (52.0%) |
| 65 to 74 Years | 1,200 (94.4%) | 686 (54.0%) |
| 75 Years and over | 1,030 (100.0%) | 607 (58.9%) |
| Total | 6,330 (40.1%) | 8,688 (55.0%) |
Disability Status by Sex by Age in Chickasha
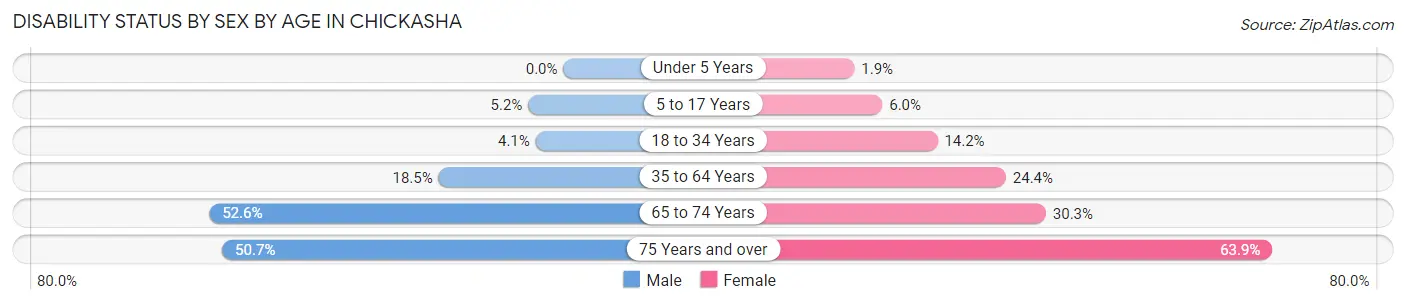
| Age Bracket | Male | Female |
| Under 5 Years | 0 (0.0%) | 5 (1.9%) |
| 5 to 17 Years | 75 (5.2%) | 82 (6.0%) |
| 18 to 34 Years | 83 (4.1%) | 295 (14.2%) |
| 35 to 64 Years | 513 (18.5%) | 750 (24.4%) |
| 65 to 74 Years | 356 (52.6%) | 180 (30.3%) |
| 75 Years and over | 154 (50.7%) | 464 (63.9%) |
Disability Class by Sex by Age in Chickasha
Disability Class: Hearing Difficulty
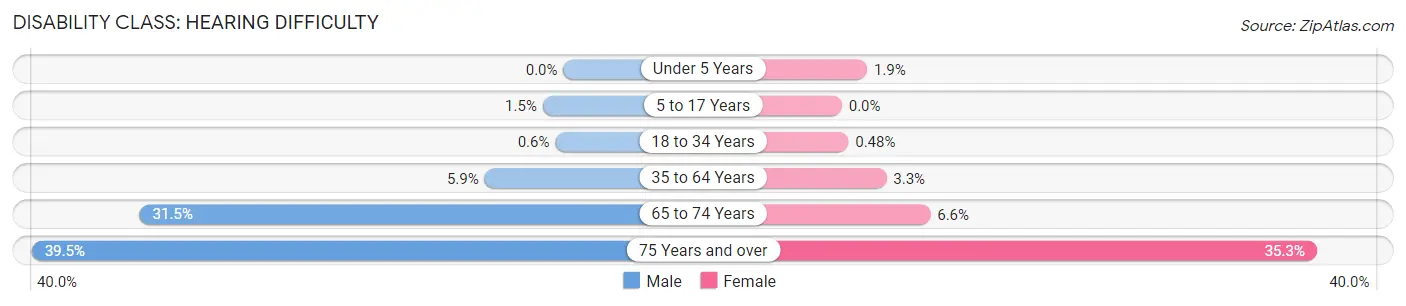
| Age Bracket | Male | Female |
| Under 5 Years | 0 (0.0%) | 5 (1.9%) |
| 5 to 17 Years | 22 (1.5%) | 0 (0.0%) |
| 18 to 34 Years | 12 (0.6%) | 10 (0.5%) |
| 35 to 64 Years | 162 (5.9%) | 102 (3.3%) |
| 65 to 74 Years | 213 (31.5%) | 39 (6.6%) |
| 75 Years and over | 120 (39.5%) | 256 (35.3%) |
Disability Class: Vision Difficulty
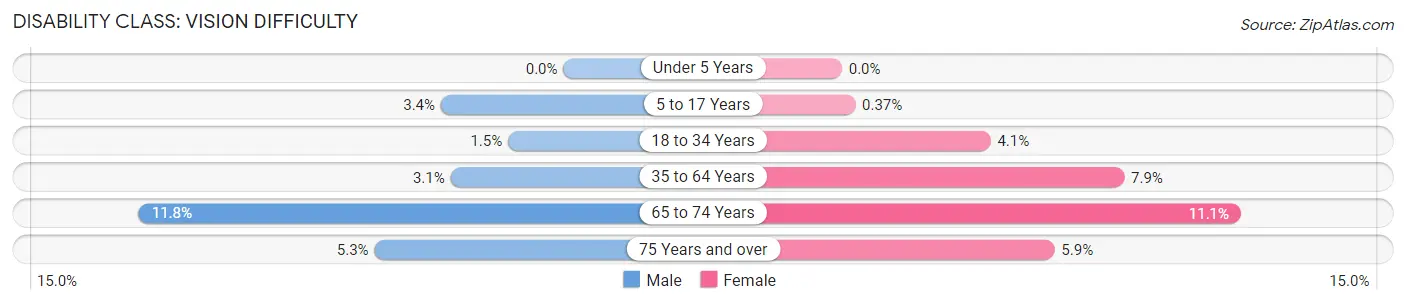
| Age Bracket | Male | Female |
| Under 5 Years | 0 (0.0%) | 0 (0.0%) |
| 5 to 17 Years | 49 (3.4%) | 5 (0.4%) |
| 18 to 34 Years | 31 (1.5%) | 86 (4.1%) |
| 35 to 64 Years | 87 (3.1%) | 242 (7.9%) |
| 65 to 74 Years | 80 (11.8%) | 66 (11.1%) |
| 75 Years and over | 16 (5.3%) | 43 (5.9%) |
Disability Class: Cognitive Difficulty
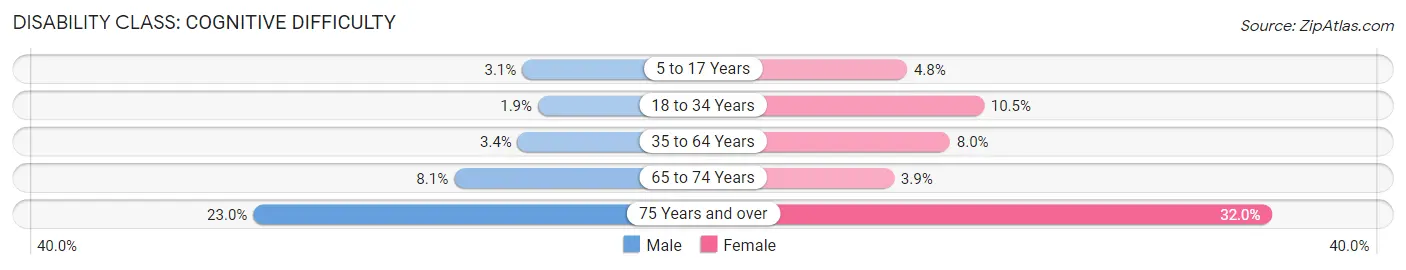
| Age Bracket | Male | Female |
| 5 to 17 Years | 44 (3.1%) | 66 (4.8%) |
| 18 to 34 Years | 38 (1.9%) | 219 (10.5%) |
| 35 to 64 Years | 94 (3.4%) | 247 (8.0%) |
| 65 to 74 Years | 55 (8.1%) | 23 (3.9%) |
| 75 Years and over | 70 (23.0%) | 232 (32.0%) |
Disability Class: Ambulatory Difficulty
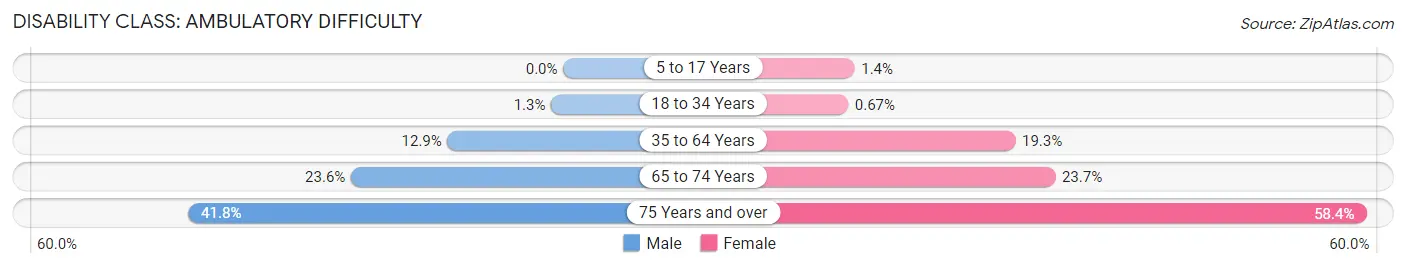
| Age Bracket | Male | Female |
| 5 to 17 Years | 0 (0.0%) | 19 (1.4%) |
| 18 to 34 Years | 27 (1.3%) | 14 (0.7%) |
| 35 to 64 Years | 357 (12.9%) | 594 (19.3%) |
| 65 to 74 Years | 160 (23.6%) | 141 (23.7%) |
| 75 Years and over | 127 (41.8%) | 424 (58.4%) |
Disability Class: Self-Care Difficulty
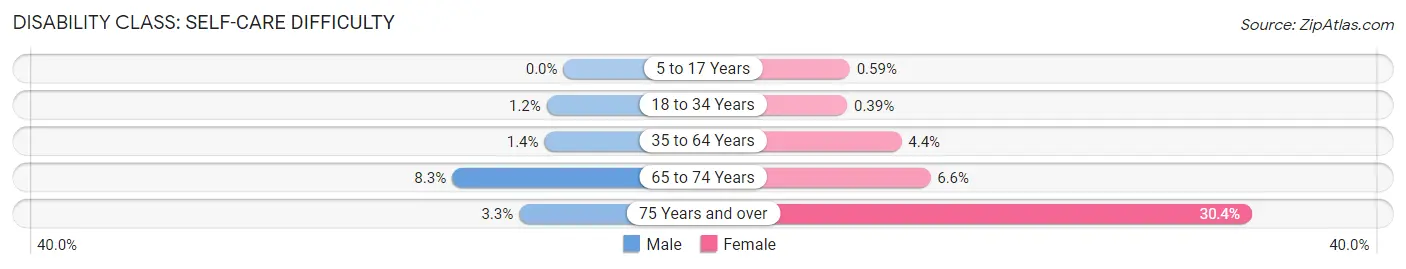
| Age Bracket | Male | Female |
| 5 to 17 Years | 0 (0.0%) | 8 (0.6%) |
| 18 to 34 Years | 25 (1.2%) | 8 (0.4%) |
| 35 to 64 Years | 39 (1.4%) | 136 (4.4%) |
| 65 to 74 Years | 56 (8.3%) | 39 (6.6%) |
| 75 Years and over | 10 (3.3%) | 221 (30.4%) |
Technology Access in Chickasha
Computing Device Access in Chickasha
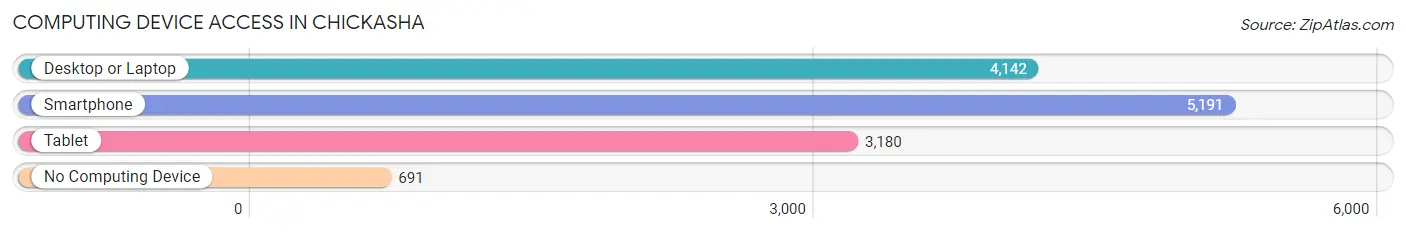
| Device Type | # Households | % Households |
| Desktop or Laptop | 4,142 | 66.6% |
| Smartphone | 5,191 | 83.4% |
| Tablet | 3,180 | 51.1% |
| No Computing Device | 691 | 11.1% |
| Total | 6,222 | 100.0% |
Internet Access in Chickasha
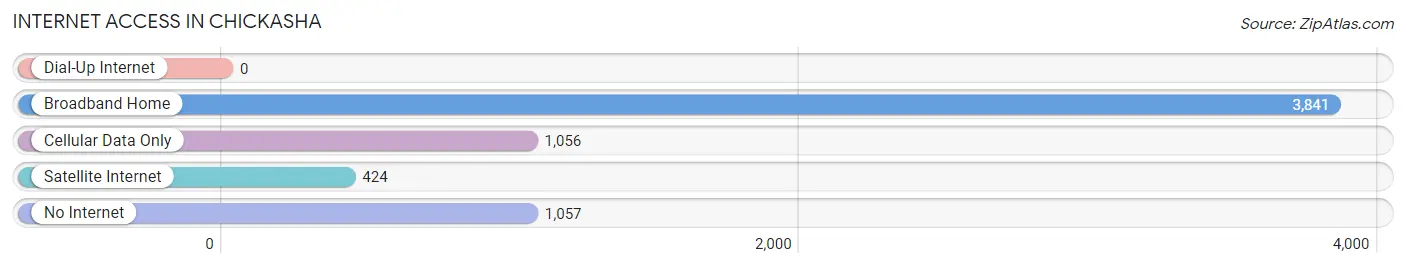
| Internet Type | # Households | % Households |
| Dial-Up Internet | 0 | 0.0% |
| Broadband Home | 3,841 | 61.7% |
| Cellular Data Only | 1,056 | 17.0% |
| Satellite Internet | 424 | 6.8% |
| No Internet | 1,057 | 17.0% |
| Total | 6,222 | 100.0% |
Chickasha Summary
Chickasha is a city located in Grady County, Oklahoma. It is situated in the central part of the state, about 40 miles southwest of Oklahoma City. The city is the county seat of Grady County and is home to a population of 16,036 people, according to the 2010 census.
History
Chickasha was founded in 1892 by a group of settlers from nearby Rush Springs. The town was named after the Chickasaw Nation, which had been relocated to the area in the 1830s. The town was incorporated in 1902 and quickly grew to become a major agricultural center in the region. The town was also home to several oil and gas companies, which helped to fuel its growth.
Geography
Chickasha is located in the central part of Oklahoma, about 40 miles southwest of Oklahoma City. The city is situated in the Red Bed Plains region of the state, which is characterized by flat terrain and sandy soils. The city is bordered by the Washita River to the north and the South Canadian River to the south. The city has a total area of 11.3 square miles, of which 11.2 square miles is land and 0.1 square miles is water.
Economy
Chickasha’s economy is largely based on agriculture and manufacturing. The city is home to several large agricultural companies, including Cargill, Tyson Foods, and J.R. Simplot. The city is also home to several manufacturing companies, including the Grady County Manufacturing Company, which produces a variety of products, including automotive parts, furniture, and medical supplies.
The city is also home to several retail stores, including Walmart, Target, and Lowe’s. The city is also home to several restaurants, including McDonald’s, Burger King, and Sonic Drive-In.
Demographics
According to the 2010 census, the population of Chickasha was 16,036. The racial makeup of the city was 79.2% White, 14.2% African American, 0.7% Native American, 0.7% Asian, 0.1% Pacific Islander, and 4.1% from other races. The median household income was $35,945, and the median family income was $45,945.
Conclusion
Chickasha is a city located in Grady County, Oklahoma. It is situated in the central part of the state, about 40 miles southwest of Oklahoma City. The city was founded in 1892 and has since grown to become a major agricultural and manufacturing center in the region. The city has a population of 16,036 people, according to the 2010 census, and is home to several large agricultural and manufacturing companies. The city also has several retail stores and restaurants. The median household income was $35,945, and the median family income was $45,945.
Common Questions
What is Per Capita Income in Chickasha?
Per Capita income in Chickasha is $31,688.
What is the Median Family Income in Chickasha?
Median Family Income in Chickasha is $68,871.
What is the Median Household income in Chickasha?
Median Household Income in Chickasha is $55,136.
What is Income or Wage Gap in Chickasha?
Income or Wage Gap in Chickasha is 51.8%.
Women in Chickasha earn 48.2 cents for every dollar earned by a man.
What is Family Income Deficit in Chickasha?
Family Income Deficit in Chickasha is $11,667.
Families that are below poverty line in Chickasha earn $11,667 less on average than the poverty threshold level.
What is Inequality or Gini Index in Chickasha?
Inequality or Gini Index in Chickasha is 0.48.
What is the Total Population of Chickasha?
Total Population of Chickasha is 16,231.
What is the Total Male Population of Chickasha?
Total Male Population of Chickasha is 7,962.
What is the Total Female Population of Chickasha?
Total Female Population of Chickasha is 8,269.
What is the Ratio of Males per 100 Females in Chickasha?
There are 96.29 Males per 100 Females in Chickasha.
What is the Ratio of Females per 100 Males in Chickasha?
There are 103.86 Females per 100 Males in Chickasha.
What is the Median Population Age in Chickasha?
Median Population Age in Chickasha is 36.4 Years.
What is the Average Family Size in Chickasha
Average Family Size in Chickasha is 3.2 People.
What is the Average Household Size in Chickasha
Average Household Size in Chickasha is 2.5 People.
How Large is the Labor Force in Chickasha?
There are 7,544 People in the Labor Forcein in Chickasha.
What is the Percentage of People in the Labor Force in Chickasha?
57.7% of People are in the Labor Force in Chickasha.
What is the Unemployment Rate in Chickasha?
Unemployment Rate in Chickasha is 5.7%.