Collinsville, OK Map & Demographics
Collinsville Map
Collinsville Overview
$36,090
PER CAPITA INCOME
$108,707
AVG FAMILY INCOME
$76,866
AVG HOUSEHOLD INCOME
41.5%
WAGE / INCOME GAP [ % ]
58.5¢/ $1
WAGE / INCOME GAP [ $ ]
$7,906
FAMILY INCOME DEFICIT
0.38
INEQUALITY / GINI INDEX
8,073
TOTAL POPULATION
4,207
MALE POPULATION
3,866
FEMALE POPULATION
108.82
MALES / 100 FEMALES
91.89
FEMALES / 100 MALES
37.4
MEDIAN AGE
3.1
AVG FAMILY SIZE
2.6
AVG HOUSEHOLD SIZE
4,389
LABOR FORCE [ PEOPLE ]
69.2%
PERCENT IN LABOR FORCE
8.2%
UNEMPLOYMENT RATE
Collinsville Zip Codes
Collinsville Area Codes
Income in Collinsville
Income Overview in Collinsville
Per Capita Income in Collinsville is $36,090, while median incomes of families and households are $108,707 and $76,866 respectively.
| Characteristic | Number | Measure |
| Per Capita Income | 8,073 | $36,090 |
| Median Family Income | 2,094 | $108,707 |
| Mean Family Income | 2,094 | $106,381 |
| Median Household Income | 3,095 | $76,866 |
| Mean Household Income | 3,095 | $91,117 |
| Income Deficit | 2,094 | $7,906 |
| Wage / Income Gap (%) | 8,073 | 41.45% |
| Wage / Income Gap ($) | 8,073 | 58.55¢ per $1 |
| Gini / Inequality Index | 8,073 | 0.38 |
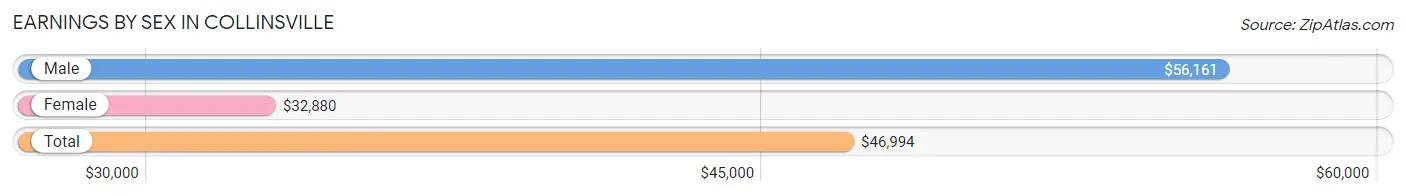
Earnings by Sex in Collinsville
Average Earnings in Collinsville are $46,994, $56,161 for men and $32,880 for women, a difference of 41.4%.
| Sex | Number | Average Earnings |
| Male | 2,491 (55.8%) | $56,161 |
| Female | 1,972 (44.2%) | $32,880 |
| Total | 4,463 (100.0%) | $46,994 |
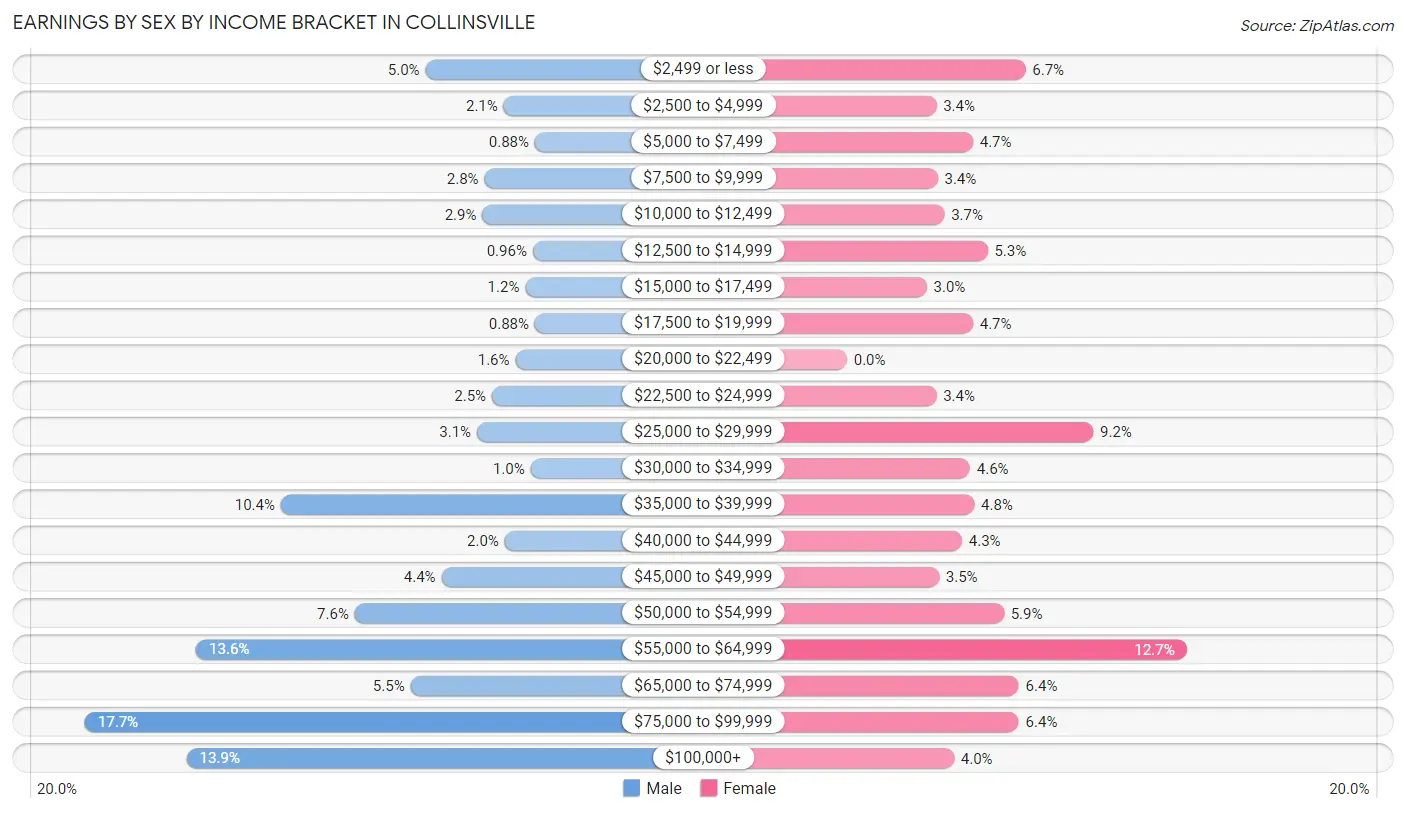
Earnings by Sex by Income Bracket in Collinsville
The most common earnings brackets in Collinsville are $75,000 to $99,999 for men (442 | 17.7%) and $55,000 to $64,999 for women (251 | 12.7%).
| Income | Male | Female |
| $2,499 or less | 124 (5.0%) | 132 (6.7%) |
| $2,500 to $4,999 | 51 (2.1%) | 66 (3.4%) |
| $5,000 to $7,499 | 22 (0.9%) | 93 (4.7%) |
| $7,500 to $9,999 | 69 (2.8%) | 67 (3.4%) |
| $10,000 to $12,499 | 71 (2.9%) | 72 (3.6%) |
| $12,500 to $14,999 | 24 (1.0%) | 104 (5.3%) |
| $15,000 to $17,499 | 31 (1.2%) | 59 (3.0%) |
| $17,500 to $19,999 | 22 (0.9%) | 93 (4.7%) |
| $20,000 to $22,499 | 40 (1.6%) | 0 (0.0%) |
| $22,500 to $24,999 | 62 (2.5%) | 66 (3.4%) |
| $25,000 to $29,999 | 76 (3.0%) | 182 (9.2%) |
| $30,000 to $34,999 | 26 (1.0%) | 91 (4.6%) |
| $35,000 to $39,999 | 259 (10.4%) | 94 (4.8%) |
| $40,000 to $44,999 | 50 (2.0%) | 85 (4.3%) |
| $45,000 to $49,999 | 109 (4.4%) | 68 (3.5%) |
| $50,000 to $54,999 | 190 (7.6%) | 116 (5.9%) |
| $55,000 to $64,999 | 338 (13.6%) | 251 (12.7%) |
| $65,000 to $74,999 | 138 (5.5%) | 127 (6.4%) |
| $75,000 to $99,999 | 442 (17.7%) | 127 (6.4%) |
| $100,000+ | 347 (13.9%) | 79 (4.0%) |
| Total | 2,491 (100.0%) | 1,972 (100.0%) |
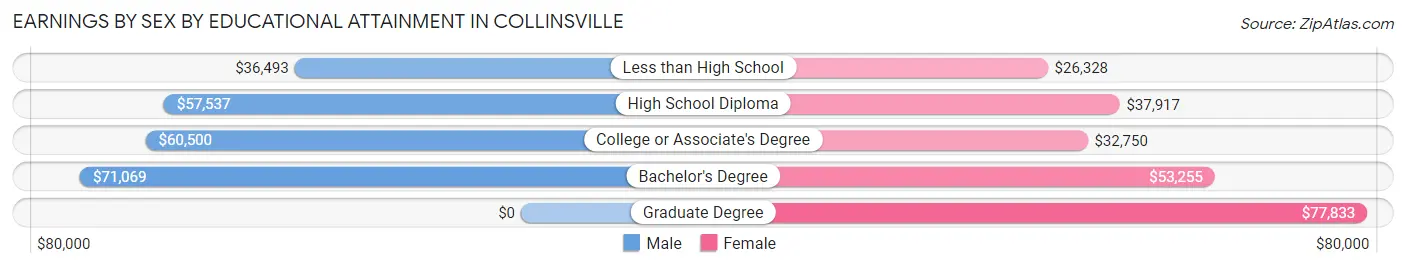
Earnings by Sex by Educational Attainment in Collinsville
Average earnings in Collinsville are $63,321 for men and $40,741 for women, a difference of 35.7%. Men with an educational attainment of bachelor's degree enjoy the highest average annual earnings of $71,069, while those with less than high school education earn the least with $36,493. Women with an educational attainment of graduate degree earn the most with the average annual earnings of $77,833, while those with less than high school education have the smallest earnings of $26,328.
| Educational Attainment | Male Income | Female Income |
| Less than High School | $36,493 | $26,328 |
| High School Diploma | $57,537 | $37,917 |
| College or Associate's Degree | $60,500 | $32,750 |
| Bachelor's Degree | $71,069 | $53,255 |
| Graduate Degree | - | - |
| Total | $63,321 | $40,741 |
Family Income in Collinsville
Family Income Brackets in Collinsville
According to the Collinsville family income data, there are 678 families falling into the $100,000 to $149,999 income range, which is the most common income bracket and makes up 32.4% of all families. Conversely, the less than $10,000 income bracket is the least frequent group with only 38 families (1.8%) belonging to this category.
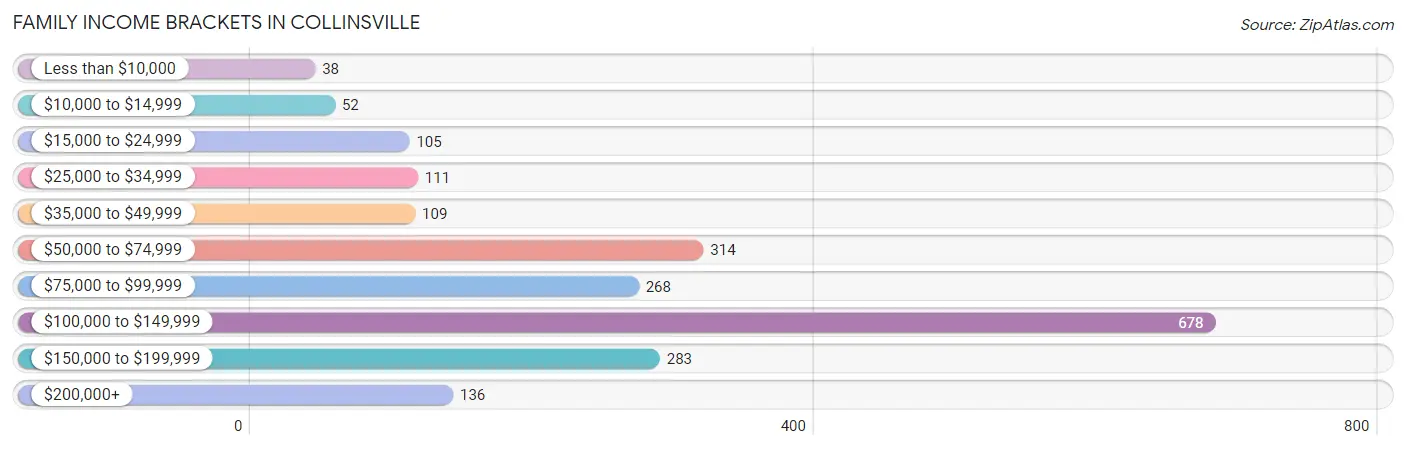
| Income Bracket | # Families | % Families |
| Less than $10,000 | 38 | 1.8% |
| $10,000 to $14,999 | 52 | 2.5% |
| $15,000 to $24,999 | 105 | 5.0% |
| $25,000 to $34,999 | 111 | 5.3% |
| $35,000 to $49,999 | 109 | 5.2% |
| $50,000 to $74,999 | 314 | 15.0% |
| $75,000 to $99,999 | 268 | 12.8% |
| $100,000 to $149,999 | 678 | 32.4% |
| $150,000 to $199,999 | 283 | 13.5% |
| $200,000+ | 136 | 6.5% |
Family Income by Famaliy Size in Collinsville
4-person families (462 | 22.1%) account for the highest median family income in Collinsville with $131,339 per family, while 2-person families (917 | 43.8%) have the highest median income of $38,617 per family member.
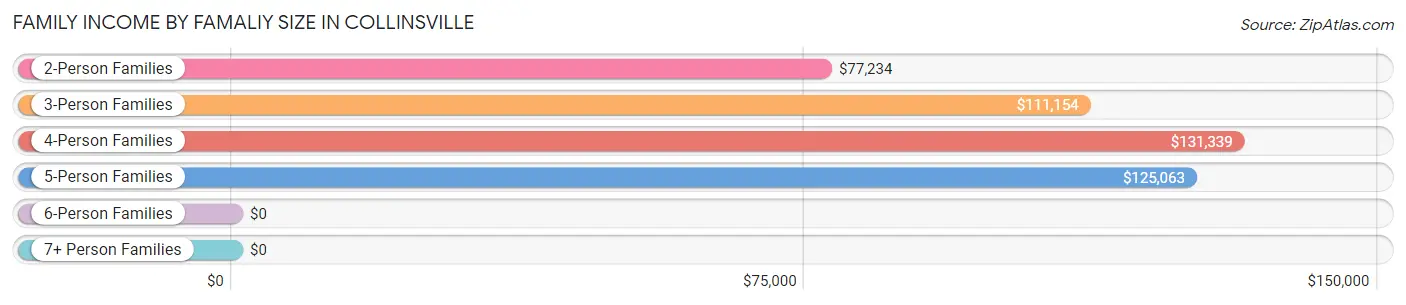
| Income Bracket | # Families | Median Income |
| 2-Person Families | 917 (43.8%) | $77,234 |
| 3-Person Families | 504 (24.1%) | $111,154 |
| 4-Person Families | 462 (22.1%) | $131,339 |
| 5-Person Families | 101 (4.8%) | $125,063 |
| 6-Person Families | 88 (4.2%) | $0 |
| 7+ Person Families | 22 (1.1%) | $0 |
| Total | 2,094 (100.0%) | $108,707 |
Family Income by Number of Earners in Collinsville
The median family income in Collinsville is $108,707, with families comprising 3+ earners (306) having the highest median family income of $139,575, while families with no earners (264) have the lowest median family income of $58,333, accounting for 14.6% and 12.6% of families, respectively.
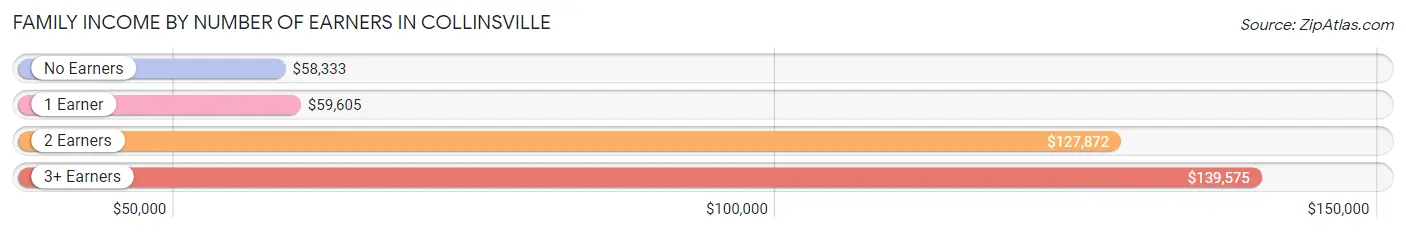
| Number of Earners | # Families | Median Income |
| No Earners | 264 (12.6%) | $58,333 |
| 1 Earner | 584 (27.9%) | $59,605 |
| 2 Earners | 940 (44.9%) | $127,872 |
| 3+ Earners | 306 (14.6%) | $139,575 |
| Total | 2,094 (100.0%) | $108,707 |
Household Income in Collinsville
Household Income Brackets in Collinsville
With 737 households falling in the category, the $100,000 to $149,999 income range is the most frequent in Collinsville, accounting for 23.8% of all households. In contrast, only 56 households (1.8%) fall into the less than $10,000 income bracket, making it the least populous group.
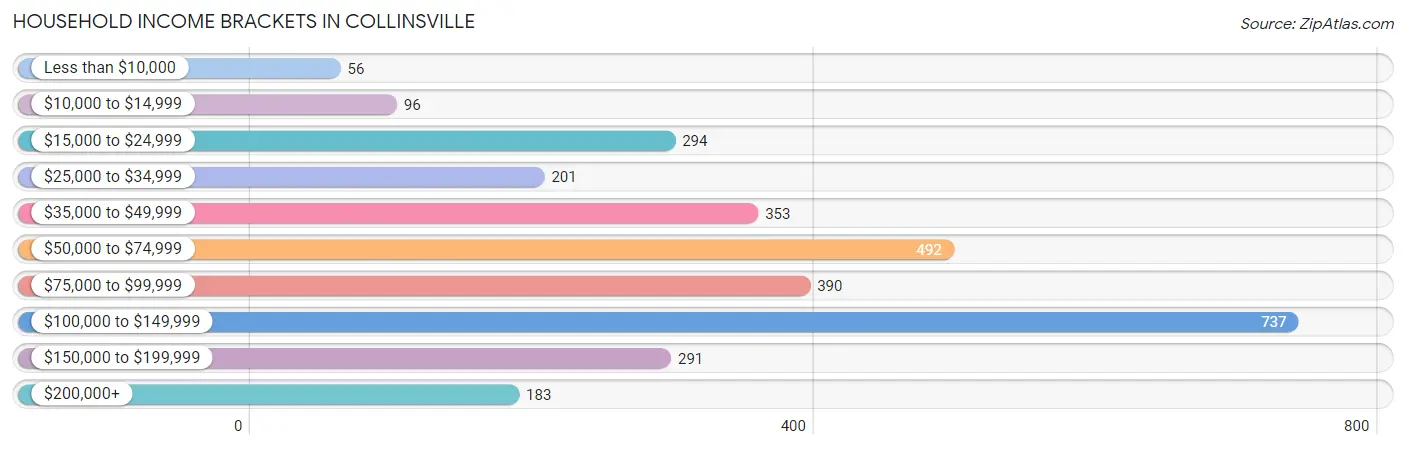
| Income Bracket | # Households | % Households |
| Less than $10,000 | 56 | 1.8% |
| $10,000 to $14,999 | 96 | 3.1% |
| $15,000 to $24,999 | 294 | 9.5% |
| $25,000 to $34,999 | 201 | 6.5% |
| $35,000 to $49,999 | 353 | 11.4% |
| $50,000 to $74,999 | 492 | 15.9% |
| $75,000 to $99,999 | 390 | 12.6% |
| $100,000 to $149,999 | 737 | 23.8% |
| $150,000 to $199,999 | 291 | 9.4% |
| $200,000+ | 183 | 5.9% |
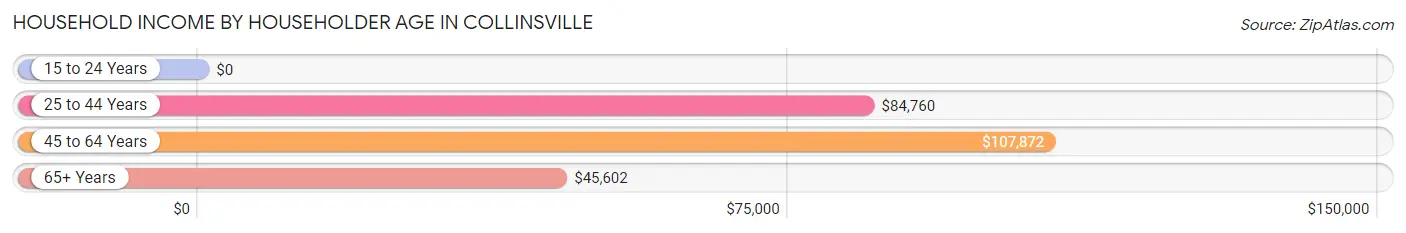
Household Income by Householder Age in Collinsville
The median household income in Collinsville is $76,866, with the highest median household income of $107,872 found in the 45 to 64 years age bracket for the primary householder. A total of 1,102 households (35.6%) fall into this category. Meanwhile, the 15 to 24 years age bracket for the primary householder has the lowest median household income of $0, with 121 households (3.9%) in this group.
| Income Bracket | # Households | Median Income |
| 15 to 24 Years | 121 (3.9%) | $0 |
| 25 to 44 Years | 1,135 (36.7%) | $84,760 |
| 45 to 64 Years | 1,102 (35.6%) | $107,872 |
| 65+ Years | 737 (23.8%) | $45,602 |
| Total | 3,095 (100.0%) | $76,866 |
Poverty in Collinsville
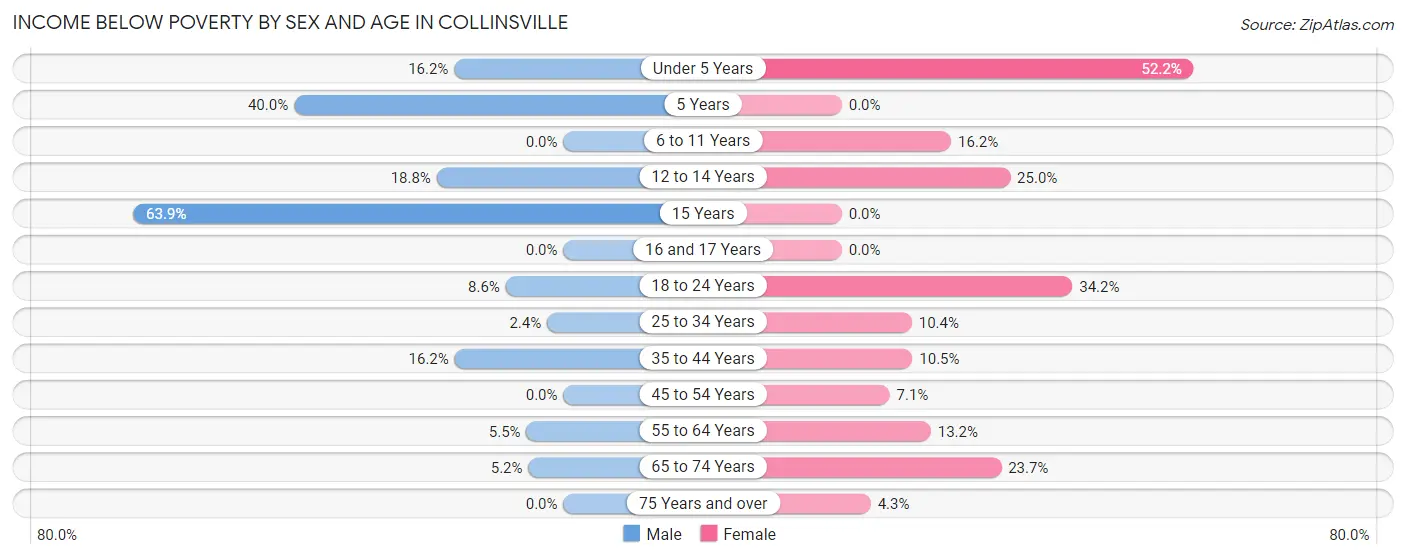
Income Below Poverty by Sex and Age in Collinsville
With 7.7% poverty level for males and 16.8% for females among the residents of Collinsville, 15 year old males and under 5 year old females are the most vulnerable to poverty, with 23 males (63.9%) and 128 females (52.2%) in their respective age groups living below the poverty level.
| Age Bracket | Male | Female |
| Under 5 Years | 41 (16.2%) | 128 (52.2%) |
| 5 Years | 30 (40.0%) | 0 (0.0%) |
| 6 to 11 Years | 0 (0.0%) | 49 (16.2%) |
| 12 to 14 Years | 41 (18.8%) | 50 (25.0%) |
| 15 Years | 23 (63.9%) | 0 (0.0%) |
| 16 and 17 Years | 0 (0.0%) | 0 (0.0%) |
| 18 to 24 Years | 40 (8.6%) | 114 (34.2%) |
| 25 to 34 Years | 15 (2.4%) | 52 (10.4%) |
| 35 to 44 Years | 83 (16.2%) | 55 (10.5%) |
| 45 to 54 Years | 0 (0.0%) | 32 (7.1%) |
| 55 to 64 Years | 27 (5.5%) | 60 (13.2%) |
| 65 to 74 Years | 17 (5.2%) | 89 (23.7%) |
| 75 Years and over | 0 (0.0%) | 11 (4.3%) |
| Total | 317 (7.7%) | 640 (16.8%) |
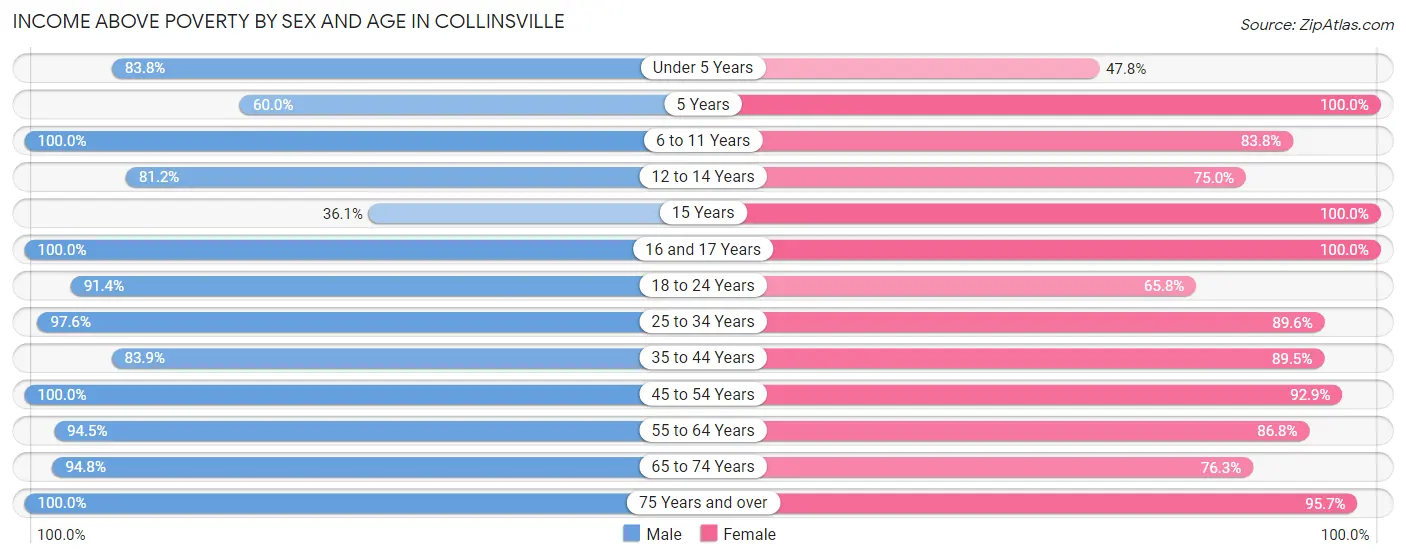
Income Above Poverty by Sex and Age in Collinsville
According to the poverty statistics in Collinsville, males aged 6 to 11 years and females aged 5 years are the age groups that are most secure financially, with 100.0% of males and 100.0% of females in these age groups living above the poverty line.
| Age Bracket | Male | Female |
| Under 5 Years | 212 (83.8%) | 117 (47.8%) |
| 5 Years | 45 (60.0%) | 56 (100.0%) |
| 6 to 11 Years | 251 (100.0%) | 253 (83.8%) |
| 12 to 14 Years | 177 (81.2%) | 150 (75.0%) |
| 15 Years | 13 (36.1%) | 23 (100.0%) |
| 16 and 17 Years | 93 (100.0%) | 98 (100.0%) |
| 18 to 24 Years | 427 (91.4%) | 219 (65.8%) |
| 25 to 34 Years | 606 (97.6%) | 448 (89.6%) |
| 35 to 44 Years | 431 (83.9%) | 470 (89.5%) |
| 45 to 54 Years | 594 (100.0%) | 419 (92.9%) |
| 55 to 64 Years | 466 (94.5%) | 394 (86.8%) |
| 65 to 74 Years | 310 (94.8%) | 287 (76.3%) |
| 75 Years and over | 173 (100.0%) | 245 (95.7%) |
| Total | 3,798 (92.3%) | 3,179 (83.2%) |
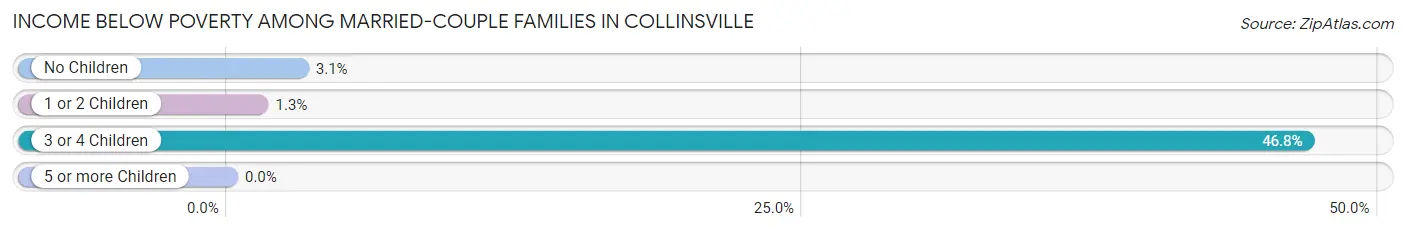
Income Below Poverty Among Married-Couple Families in Collinsville
The poverty statistics for married-couple families in Collinsville show that 4.5% or 71 of the total 1,591 families live below the poverty line. Families with 3 or 4 children have the highest poverty rate of 46.8%, comprising of 37 families. On the other hand, families with 5 or more children have the lowest poverty rate of 0.0%, which includes 0 families.
| Children | Above Poverty | Below Poverty |
| No Children | 787 (96.9%) | 25 (3.1%) |
| 1 or 2 Children | 669 (98.7%) | 9 (1.3%) |
| 3 or 4 Children | 42 (53.2%) | 37 (46.8%) |
| 5 or more Children | 22 (100.0%) | 0 (0.0%) |
| Total | 1,520 (95.5%) | 71 (4.5%) |
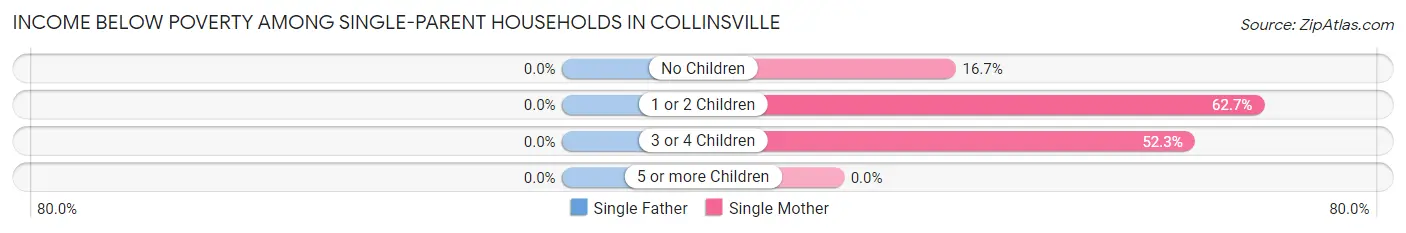
Income Below Poverty Among Single-Parent Households in Collinsville
| Children | Single Father | Single Mother |
| No Children | 0 (0.0%) | 18 (16.7%) |
| 1 or 2 Children | 0 (0.0%) | 104 (62.6%) |
| 3 or 4 Children | 0 (0.0%) | 23 (52.3%) |
| 5 or more Children | 0 (0.0%) | 0 (0.0%) |
| Total | 0 (0.0%) | 145 (45.6%) |
Income Below Poverty Among Married-Couple vs Single-Parent Households in Collinsville
The poverty data for Collinsville shows that 71 of the married-couple family households (4.5%) and 145 of the single-parent households (28.8%) are living below the poverty level. Within the married-couple family households, those with 3 or 4 children have the highest poverty rate, with 37 households (46.8%) falling below the poverty line. Among the single-parent households, those with 3 or 4 children have the highest poverty rate, with 23 household (43.4%) living below poverty.
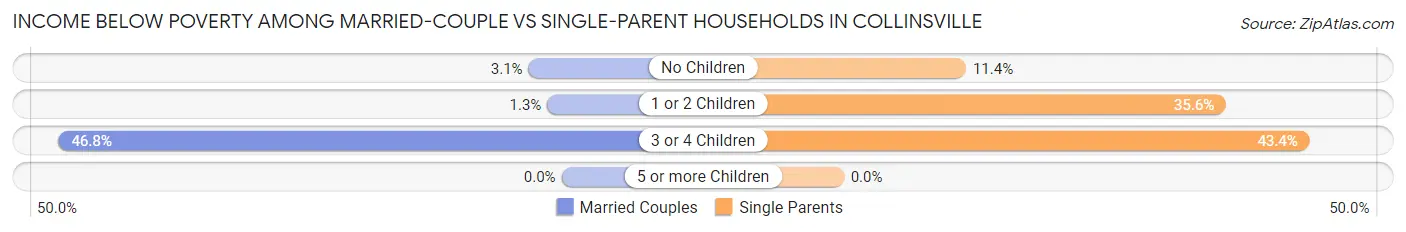
| Children | Married-Couple Families | Single-Parent Households |
| No Children | 25 (3.1%) | 18 (11.4%) |
| 1 or 2 Children | 9 (1.3%) | 104 (35.6%) |
| 3 or 4 Children | 37 (46.8%) | 23 (43.4%) |
| 5 or more Children | 0 (0.0%) | 0 (0.0%) |
| Total | 71 (4.5%) | 145 (28.8%) |
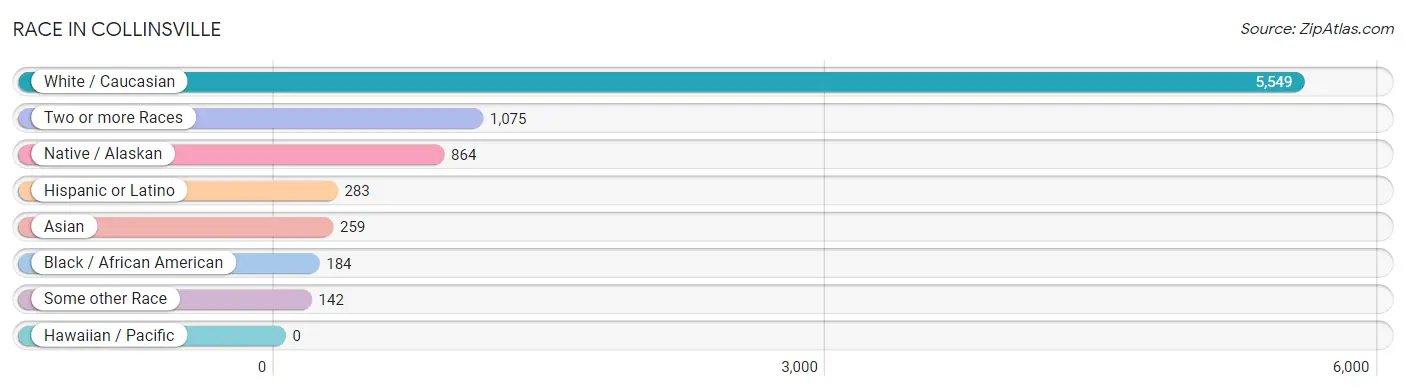
Race in Collinsville
The most populous races in Collinsville are White / Caucasian (5,549 | 68.7%), Two or more Races (1,075 | 13.3%), and Native / Alaskan (864 | 10.7%).
| Race | # Population | % Population |
| Asian | 259 | 3.2% |
| Black / African American | 184 | 2.3% |
| Hawaiian / Pacific | 0 | 0.0% |
| Hispanic or Latino | 283 | 3.5% |
| Native / Alaskan | 864 | 10.7% |
| White / Caucasian | 5,549 | 68.7% |
| Two or more Races | 1,075 | 13.3% |
| Some other Race | 142 | 1.8% |
| Total | 8,073 | 100.0% |
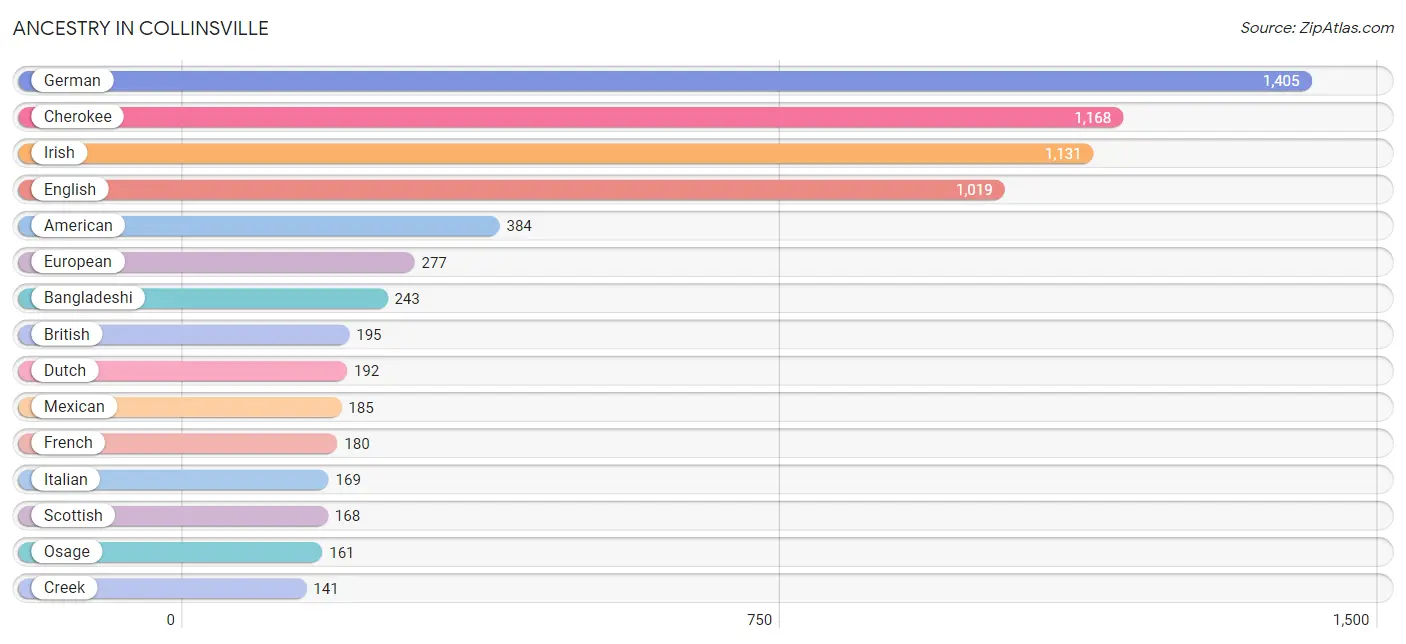
Ancestry in Collinsville
The most populous ancestries reported in Collinsville are German (1,405 | 17.4%), Cherokee (1,168 | 14.5%), Irish (1,131 | 14.0%), English (1,019 | 12.6%), and American (384 | 4.8%), together accounting for 63.3% of all Collinsville residents.
| Ancestry | # Population | % Population |
| American | 384 | 4.8% |
| Apache | 30 | 0.4% |
| Austrian | 10 | 0.1% |
| Bangladeshi | 243 | 3.0% |
| Bhutanese | 7 | 0.1% |
| British | 195 | 2.4% |
| Burmese | 9 | 0.1% |
| Central American | 47 | 0.6% |
| Cherokee | 1,168 | 14.5% |
| Chickasaw | 91 | 1.1% |
| Choctaw | 137 | 1.7% |
| Creek | 141 | 1.8% |
| Crow | 34 | 0.4% |
| Czech | 11 | 0.1% |
| Dutch | 192 | 2.4% |
| English | 1,019 | 12.6% |
| European | 277 | 3.4% |
| French | 180 | 2.2% |
| French Canadian | 1 | 0.0% |
| German | 1,405 | 17.4% |
| Greek | 14 | 0.2% |
| Guatemalan | 13 | 0.2% |
| Irish | 1,131 | 14.0% |
| Iroquois | 61 | 0.8% |
| Italian | 169 | 2.1% |
| Mexican | 185 | 2.3% |
| Norwegian | 36 | 0.4% |
| Osage | 161 | 2.0% |
| Polish | 71 | 0.9% |
| Portuguese | 49 | 0.6% |
| Potawatomi | 23 | 0.3% |
| Russian | 11 | 0.1% |
| Salvadoran | 34 | 0.4% |
| Scandinavian | 37 | 0.5% |
| Scotch-Irish | 98 | 1.2% |
| Scottish | 168 | 2.1% |
| Serbian | 10 | 0.1% |
| Spanish | 51 | 0.6% |
| Swedish | 131 | 1.6% |
| Welsh | 107 | 1.3% |
| Yugoslavian | 10 | 0.1% | View All 41 Rows |
Immigrants in Collinsville
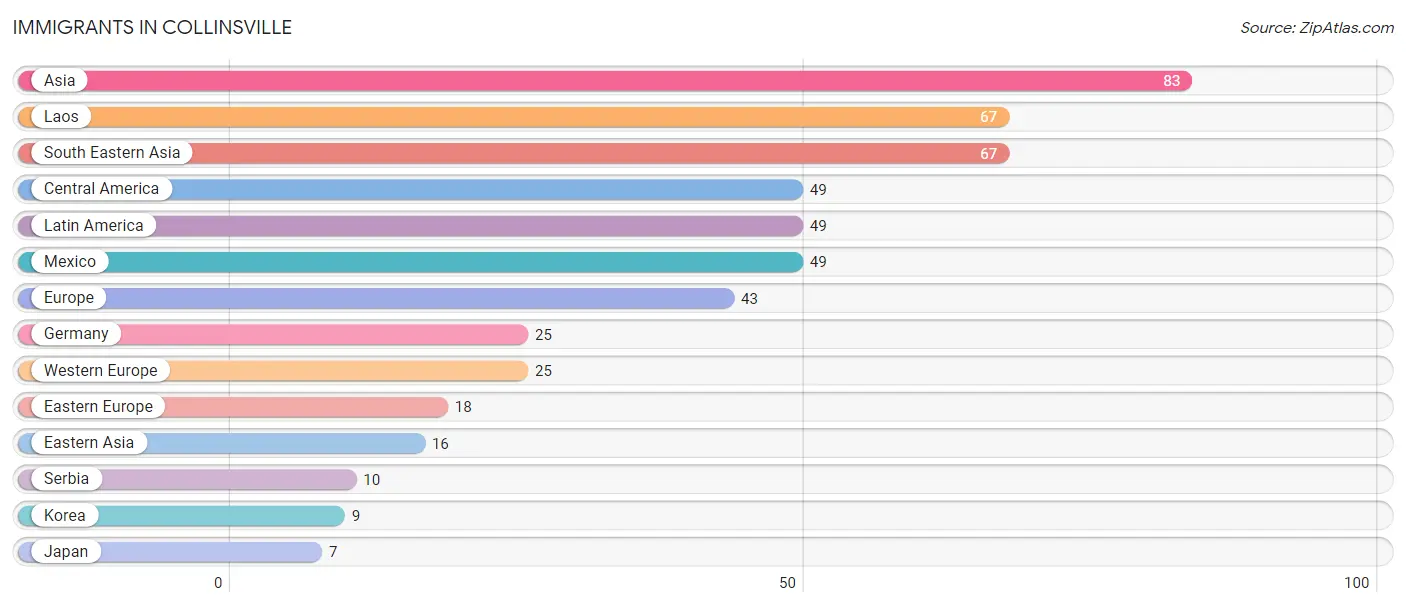
The most numerous immigrant groups reported in Collinsville came from Asia (83 | 1.0%), Laos (67 | 0.8%), South Eastern Asia (67 | 0.8%), Central America (49 | 0.6%), and Latin America (49 | 0.6%), together accounting for 3.9% of all Collinsville residents.
| Immigration Origin | # Population | % Population |
| Asia | 83 | 1.0% |
| Central America | 49 | 0.6% |
| Eastern Asia | 16 | 0.2% |
| Eastern Europe | 18 | 0.2% |
| Europe | 43 | 0.5% |
| Germany | 25 | 0.3% |
| Japan | 7 | 0.1% |
| Korea | 9 | 0.1% |
| Laos | 67 | 0.8% |
| Latin America | 49 | 0.6% |
| Mexico | 49 | 0.6% |
| Serbia | 10 | 0.1% |
| South Eastern Asia | 67 | 0.8% |
| Western Europe | 25 | 0.3% | View All 14 Rows |
Sex and Age in Collinsville
Sex and Age in Collinsville
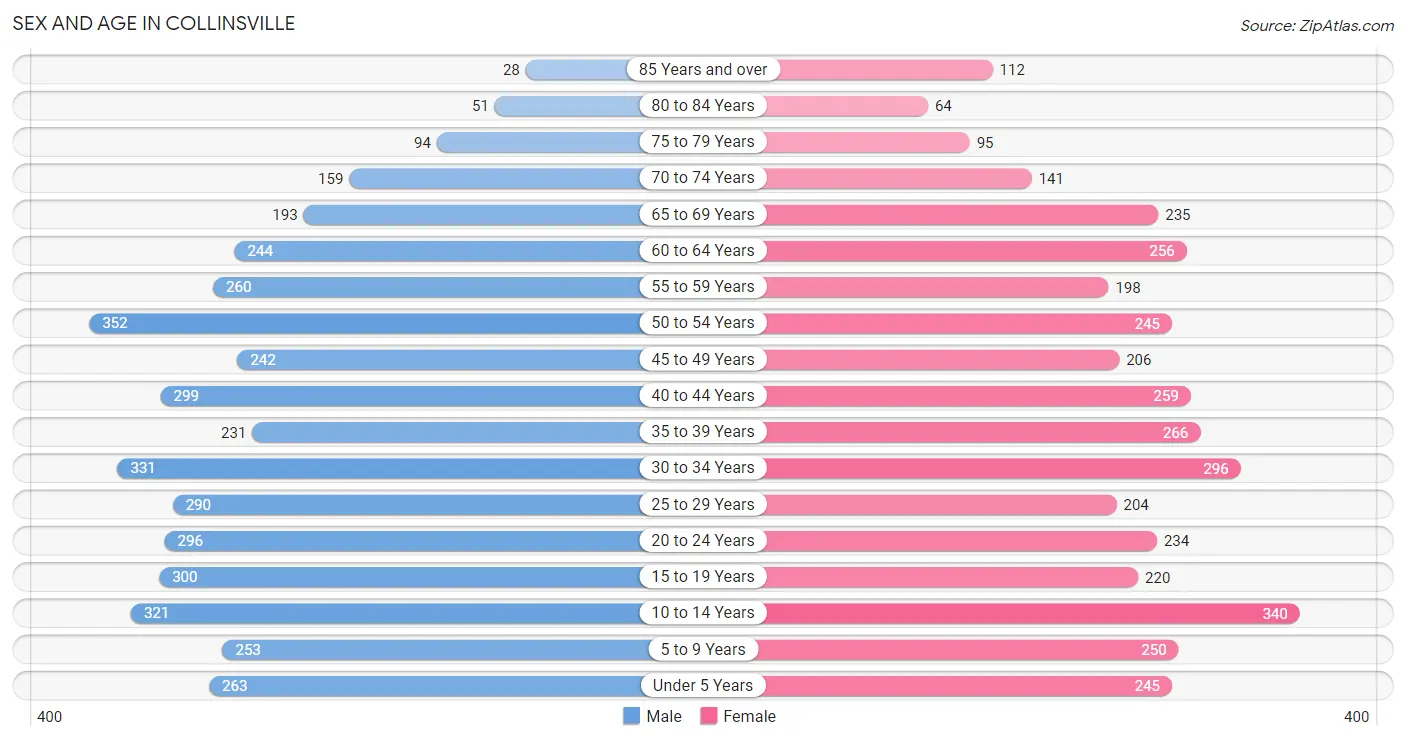
The most populous age groups in Collinsville are 50 to 54 Years (352 | 8.4%) for men and 10 to 14 Years (340 | 8.8%) for women.
| Age Bracket | Male | Female |
| Under 5 Years | 263 (6.2%) | 245 (6.3%) |
| 5 to 9 Years | 253 (6.0%) | 250 (6.5%) |
| 10 to 14 Years | 321 (7.6%) | 340 (8.8%) |
| 15 to 19 Years | 300 (7.1%) | 220 (5.7%) |
| 20 to 24 Years | 296 (7.0%) | 234 (6.0%) |
| 25 to 29 Years | 290 (6.9%) | 204 (5.3%) |
| 30 to 34 Years | 331 (7.9%) | 296 (7.7%) |
| 35 to 39 Years | 231 (5.5%) | 266 (6.9%) |
| 40 to 44 Years | 299 (7.1%) | 259 (6.7%) |
| 45 to 49 Years | 242 (5.8%) | 206 (5.3%) |
| 50 to 54 Years | 352 (8.4%) | 245 (6.3%) |
| 55 to 59 Years | 260 (6.2%) | 198 (5.1%) |
| 60 to 64 Years | 244 (5.8%) | 256 (6.6%) |
| 65 to 69 Years | 193 (4.6%) | 235 (6.1%) |
| 70 to 74 Years | 159 (3.8%) | 141 (3.6%) |
| 75 to 79 Years | 94 (2.2%) | 95 (2.5%) |
| 80 to 84 Years | 51 (1.2%) | 64 (1.7%) |
| 85 Years and over | 28 (0.7%) | 112 (2.9%) |
| Total | 4,207 (100.0%) | 3,866 (100.0%) |
Families and Households in Collinsville
Median Family Size in Collinsville
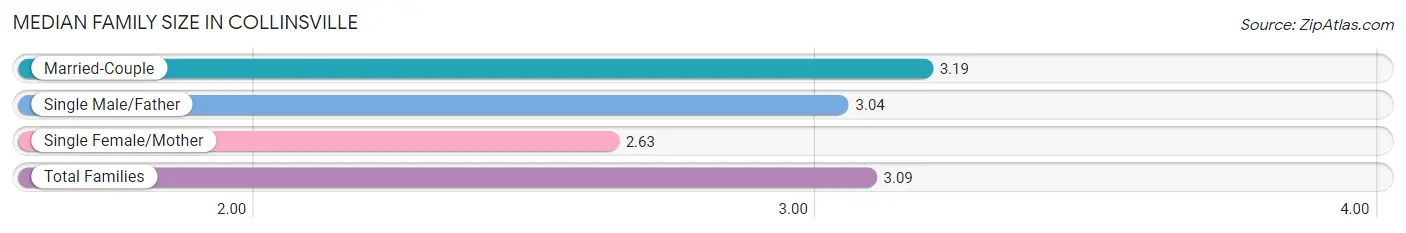
The median family size in Collinsville is 3.09 persons per family, with married-couple families (1,591 | 76.0%) accounting for the largest median family size of 3.19 persons per family. On the other hand, single female/mother families (318 | 15.2%) represent the smallest median family size with 2.63 persons per family.
| Family Type | # Families | Family Size |
| Married-Couple | 1,591 (76.0%) | 3.19 |
| Single Male/Father | 185 (8.8%) | 3.04 |
| Single Female/Mother | 318 (15.2%) | 2.63 |
| Total Families | 2,094 (100.0%) | 3.09 |
Median Household Size in Collinsville
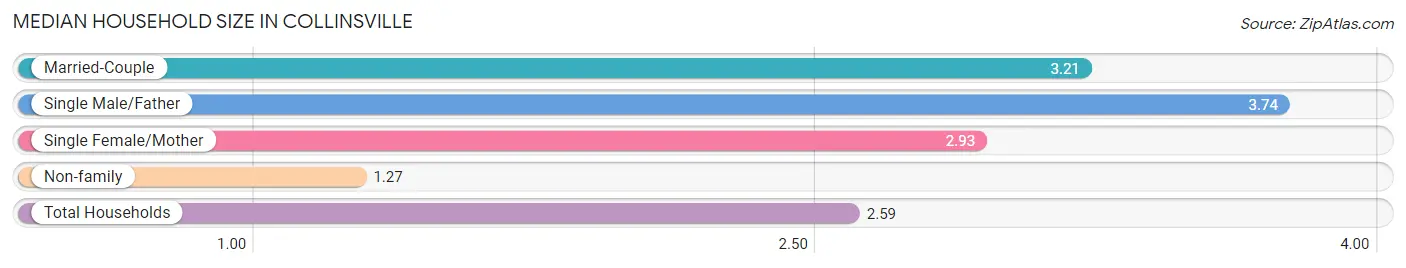
The median household size in Collinsville is 2.59 persons per household, with single male/father households (185 | 6.0%) accounting for the largest median household size of 3.74 persons per household. non-family households (1,001 | 32.3%) represent the smallest median household size with 1.27 persons per household.
| Household Type | # Households | Household Size |
| Married-Couple | 1,591 (51.4%) | 3.21 |
| Single Male/Father | 185 (6.0%) | 3.74 |
| Single Female/Mother | 318 (10.3%) | 2.93 |
| Non-family | 1,001 (32.3%) | 1.27 |
| Total Households | 3,095 (100.0%) | 2.59 |
Household Size by Marriage Status in Collinsville
Out of a total of 3,095 households in Collinsville, 2,094 (67.7%) are family households, while 1,001 (32.3%) are nonfamily households. The most numerous type of family households are 2-person households, comprising 811, and the most common type of nonfamily households are 1-person households, comprising 817.
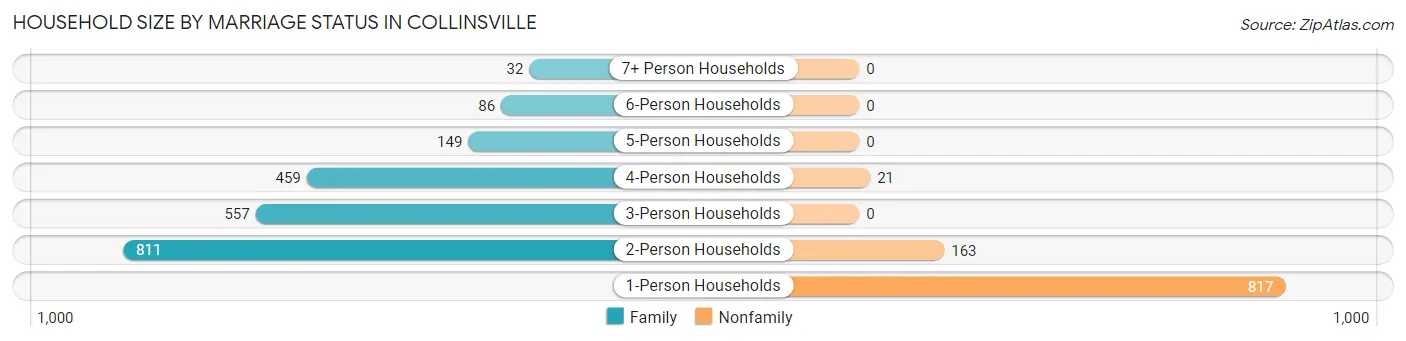
| Household Size | Family Households | Nonfamily Households |
| 1-Person Households | - | 817 (26.4%) |
| 2-Person Households | 811 (26.2%) | 163 (5.3%) |
| 3-Person Households | 557 (18.0%) | 0 (0.0%) |
| 4-Person Households | 459 (14.8%) | 21 (0.7%) |
| 5-Person Households | 149 (4.8%) | 0 (0.0%) |
| 6-Person Households | 86 (2.8%) | 0 (0.0%) |
| 7+ Person Households | 32 (1.0%) | 0 (0.0%) |
| Total | 2,094 (67.7%) | 1,001 (32.3%) |
Female Fertility in Collinsville
Fertility by Age in Collinsville
Average fertility rate in Collinsville is 61.0 births per 1,000 women. Women in the age bracket of 20 to 34 years have the highest fertility rate with 95.0 births per 1,000 women. Women in the age bracket of 20 to 34 years acount for 66.7% of all women with births.
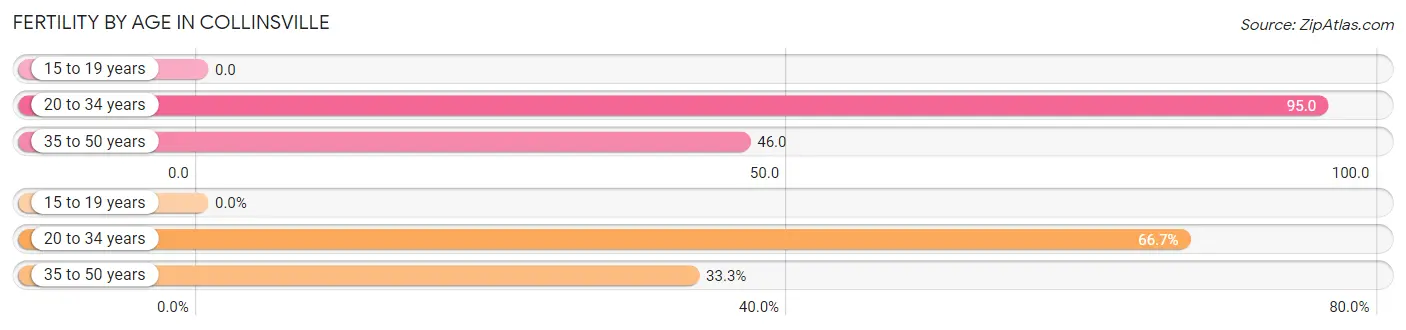
| Age Bracket | Women with Births | Births / 1,000 Women |
| 15 to 19 years | 0 (0.0%) | 0.0 |
| 20 to 34 years | 70 (66.7%) | 95.0 |
| 35 to 50 years | 35 (33.3%) | 46.0 |
| Total | 105 (100.0%) | 61.0 |
Fertility by Age by Marriage Status in Collinsville
65.7% of women with births (105) in Collinsville are married. The highest percentage of unmarried women with births falls into 35 to 50 years age bracket with 42.9% of them unmarried at the time of birth, while the lowest percentage of unmarried women with births belong to 20 to 34 years age bracket with 30.0% of them unmarried.
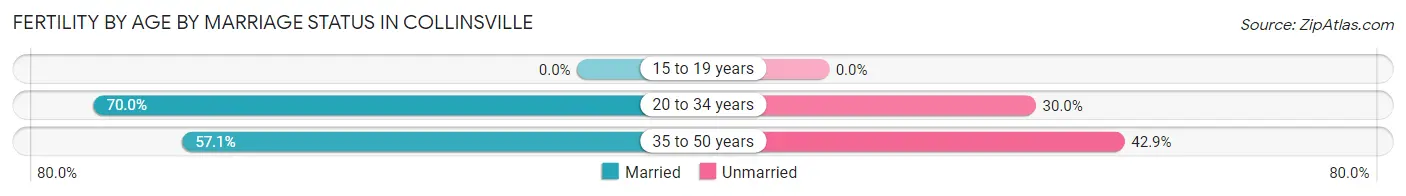
| Age Bracket | Married | Unmarried |
| 15 to 19 years | 0 (0.0%) | 0 (0.0%) |
| 20 to 34 years | 49 (70.0%) | 21 (30.0%) |
| 35 to 50 years | 20 (57.1%) | 15 (42.9%) |
| Total | 69 (65.7%) | 36 (34.3%) |
Fertility by Education in Collinsville
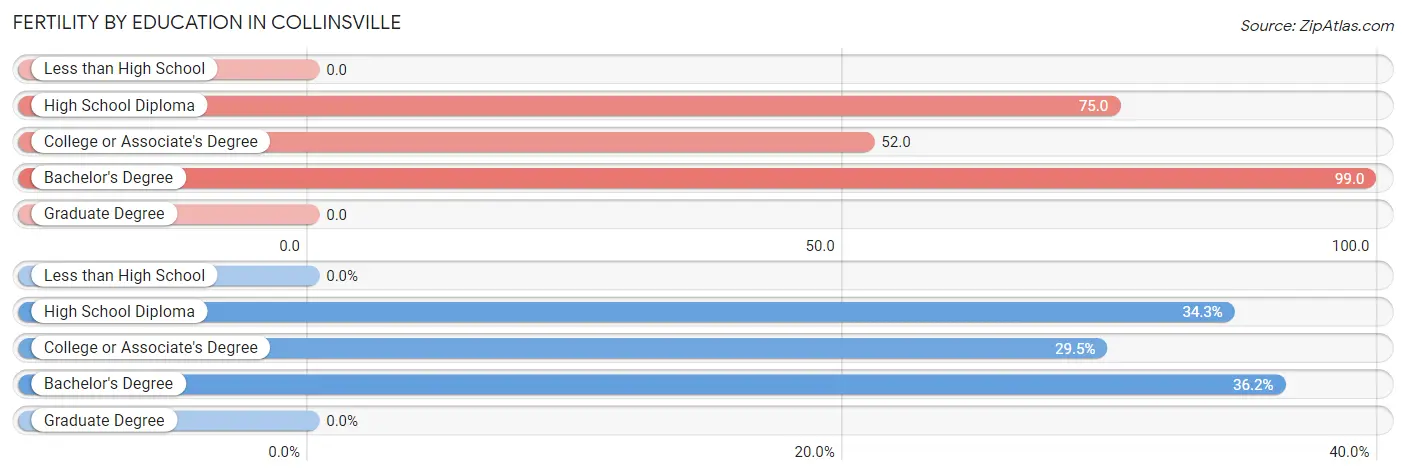
| Educational Attainment | Women with Births | Births / 1,000 Women |
| Less than High School | 0 (0.0%) | 0.0 |
| High School Diploma | 36 (34.3%) | 75.0 |
| College or Associate's Degree | 31 (29.5%) | 52.0 |
| Bachelor's Degree | 38 (36.2%) | 99.0 |
| Graduate Degree | 0 (0.0%) | 0.0 |
| Total | 105 (100.0%) | 61.0 |
Fertility by Education by Marriage Status in Collinsville
34.3% of women with births in Collinsville are unmarried. Women with the educational attainment of college or associate's degree are most likely to be married with 100.0% of them married at childbirth, while women with the educational attainment of high school diploma are least likely to be married with 100.0% of them unmarried at childbirth.
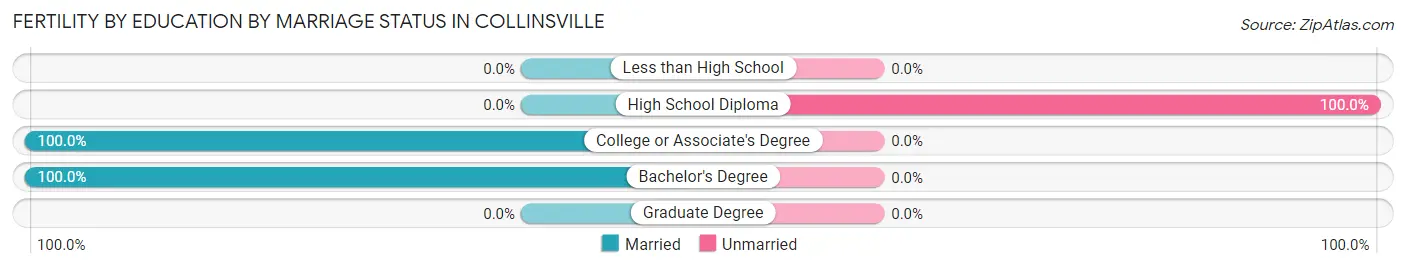
| Educational Attainment | Married | Unmarried |
| Less than High School | 0 (0.0%) | 0 (0.0%) |
| High School Diploma | 0 (0.0%) | 36 (100.0%) |
| College or Associate's Degree | 31 (100.0%) | 0 (0.0%) |
| Bachelor's Degree | 38 (100.0%) | 0 (0.0%) |
| Graduate Degree | 0 (0.0%) | 0 (0.0%) |
| Total | 69 (65.7%) | 36 (34.3%) |
Employment Characteristics in Collinsville
Employment by Class of Employer in Collinsville
Among the 3,887 employed individuals in Collinsville, private company employees (2,859 | 73.6%), not-for-profit organizations (253 | 6.5%), and self-employed (not incorporated) (250 | 6.4%) make up the most common classes of employment.
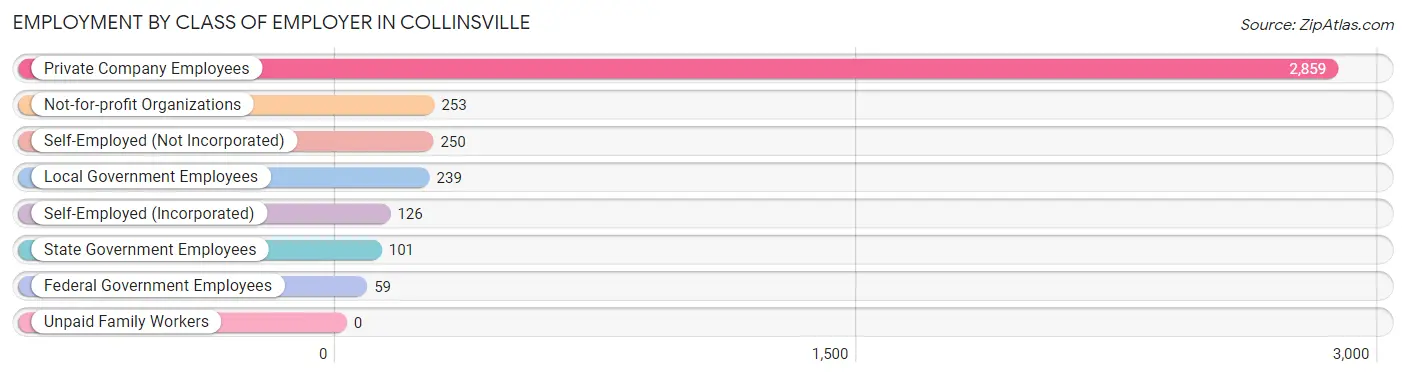
| Employer Class | # Employees | % Employees |
| Private Company Employees | 2,859 | 73.6% |
| Self-Employed (Incorporated) | 126 | 3.2% |
| Self-Employed (Not Incorporated) | 250 | 6.4% |
| Not-for-profit Organizations | 253 | 6.5% |
| Local Government Employees | 239 | 6.1% |
| State Government Employees | 101 | 2.6% |
| Federal Government Employees | 59 | 1.5% |
| Unpaid Family Workers | 0 | 0.0% |
| Total | 3,887 | 100.0% |
Employment Status by Age in Collinsville
According to the labor force statistics for Collinsville, out of the total population over 16 years of age (6,342), 69.2% or 4,389 individuals are in the labor force, with 8.2% or 360 of them unemployed. The age group with the highest labor force participation rate is 25 to 29 years, with 96.4% or 476 individuals in the labor force. Within the labor force, the 20 to 24 years age range has the highest percentage of unemployed individuals, with 23.9% or 104 of them being unemployed.
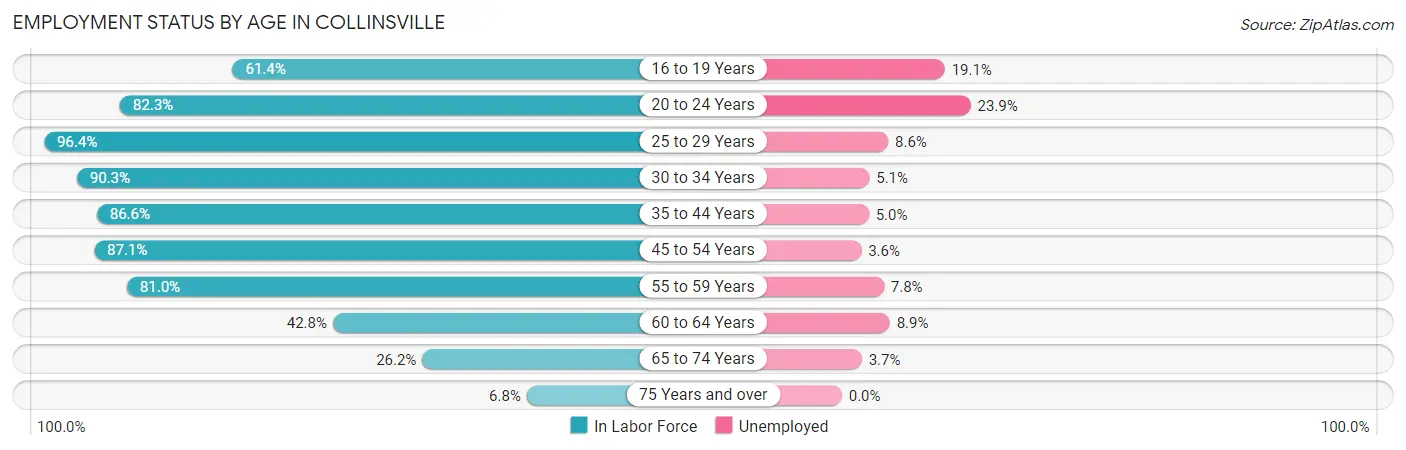
| Age Bracket | In Labor Force | Unemployed |
| 16 to 19 Years | 283 (61.4%) | 54 (19.1%) |
| 20 to 24 Years | 436 (82.3%) | 104 (23.9%) |
| 25 to 29 Years | 476 (96.4%) | 41 (8.6%) |
| 30 to 34 Years | 566 (90.3%) | 29 (5.1%) |
| 35 to 44 Years | 914 (86.6%) | 46 (5.0%) |
| 45 to 54 Years | 910 (87.1%) | 33 (3.6%) |
| 55 to 59 Years | 371 (81.0%) | 29 (7.8%) |
| 60 to 64 Years | 214 (42.8%) | 19 (8.9%) |
| 65 to 74 Years | 191 (26.2%) | 7 (3.7%) |
| 75 Years and over | 30 (6.8%) | 0 (0.0%) |
| Total | 4,389 (69.2%) | 360 (8.2%) |
Employment Status by Educational Attainment in Collinsville
According to labor force statistics for Collinsville, 82.6% of individuals (3,452) out of the total population between 25 and 64 years of age (4,179) are in the labor force, with 5.7% or 197 of them being unemployed. The group with the highest labor force participation rate are those with the educational attainment of college / associate degree, with 86.3% or 1,452 individuals in the labor force. Within the labor force, individuals with college / associate degree education have the highest percentage of unemployment, with 9.9% or 144 of them being unemployed.
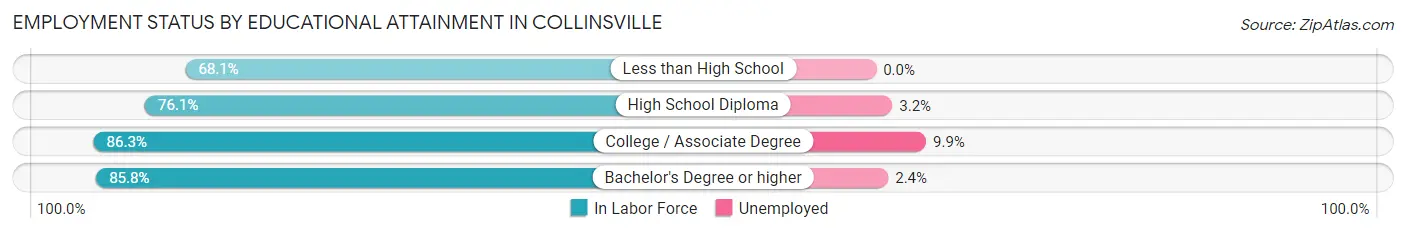
| Educational Attainment | In Labor Force | Unemployed |
| Less than High School | 124 (68.1%) | 0 (0.0%) |
| High School Diploma | 869 (76.1%) | 37 (3.2%) |
| College / Associate Degree | 1,452 (86.3%) | 167 (9.9%) |
| Bachelor's Degree or higher | 1,006 (85.8%) | 28 (2.4%) |
| Total | 3,452 (82.6%) | 238 (5.7%) |
Employment Occupations by Sex in Collinsville
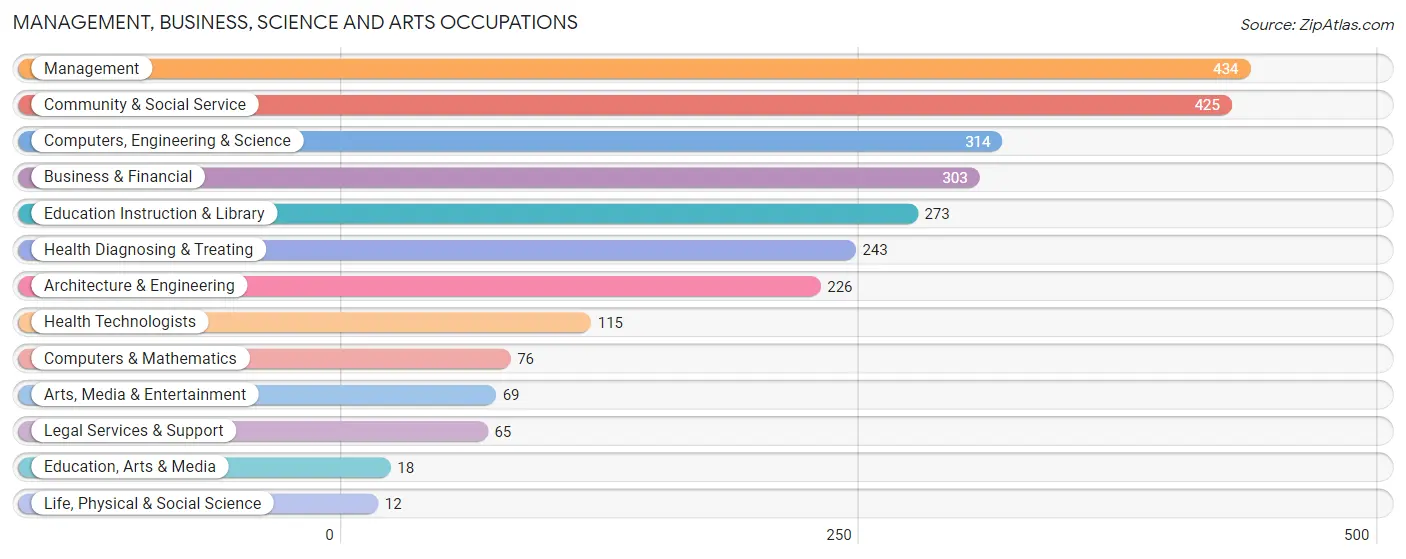
Management, Business, Science and Arts Occupations
The most common Management, Business, Science and Arts occupations in Collinsville are Management (434 | 10.8%), Community & Social Service (425 | 10.6%), Computers, Engineering & Science (314 | 7.8%), Business & Financial (303 | 7.5%), and Education Instruction & Library (273 | 6.8%).
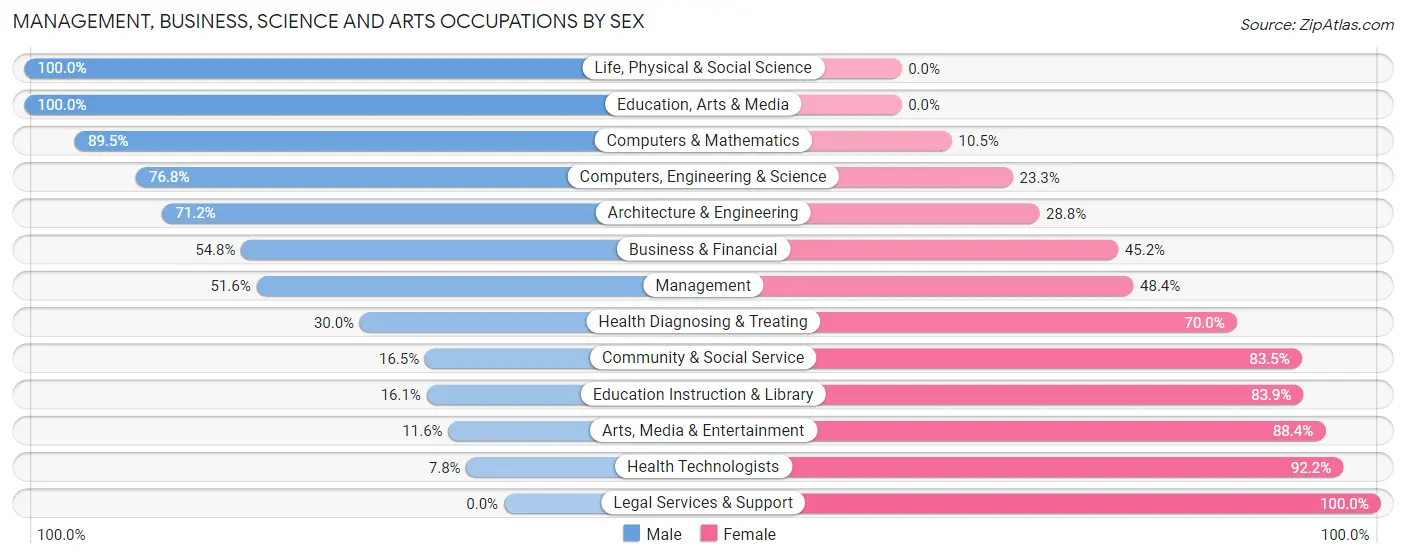
Management, Business, Science and Arts Occupations by Sex
Within the Management, Business, Science and Arts occupations in Collinsville, the most male-oriented occupations are Life, Physical & Social Science (100.0%), Education, Arts & Media (100.0%), and Computers & Mathematics (89.5%), while the most female-oriented occupations are Legal Services & Support (100.0%), Health Technologists (92.2%), and Arts, Media & Entertainment (88.4%).
| Occupation | Male | Female |
| Management | 224 (51.6%) | 210 (48.4%) |
| Business & Financial | 166 (54.8%) | 137 (45.2%) |
| Computers, Engineering & Science | 241 (76.7%) | 73 (23.3%) |
| Computers & Mathematics | 68 (89.5%) | 8 (10.5%) |
| Architecture & Engineering | 161 (71.2%) | 65 (28.8%) |
| Life, Physical & Social Science | 12 (100.0%) | 0 (0.0%) |
| Community & Social Service | 70 (16.5%) | 355 (83.5%) |
| Education, Arts & Media | 18 (100.0%) | 0 (0.0%) |
| Legal Services & Support | 0 (0.0%) | 65 (100.0%) |
| Education Instruction & Library | 44 (16.1%) | 229 (83.9%) |
| Arts, Media & Entertainment | 8 (11.6%) | 61 (88.4%) |
| Health Diagnosing & Treating | 73 (30.0%) | 170 (70.0%) |
| Health Technologists | 9 (7.8%) | 106 (92.2%) |
| Total (Category) | 774 (45.0%) | 945 (55.0%) |
| Total (Overall) | 2,333 (58.1%) | 1,686 (41.9%) |
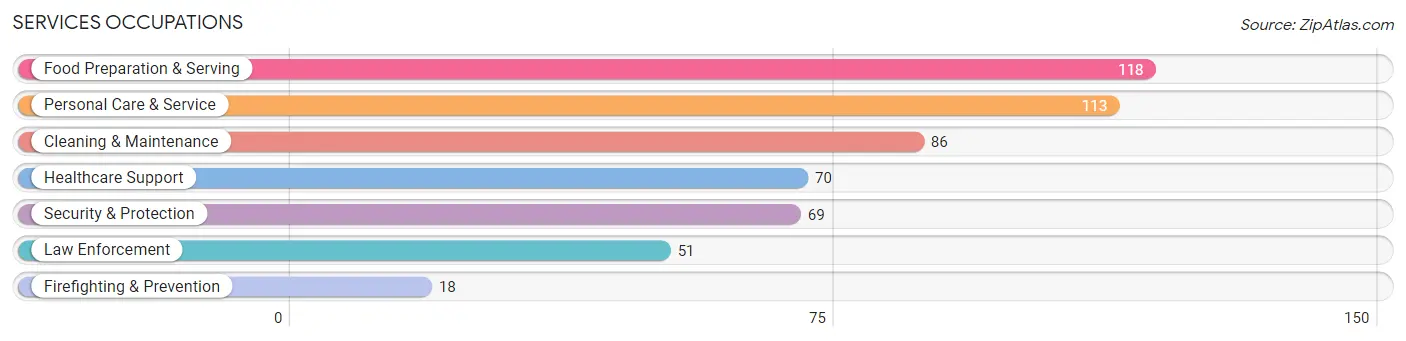
Services Occupations
The most common Services occupations in Collinsville are Food Preparation & Serving (118 | 2.9%), Personal Care & Service (113 | 2.8%), Cleaning & Maintenance (86 | 2.1%), Healthcare Support (70 | 1.7%), and Security & Protection (69 | 1.7%).
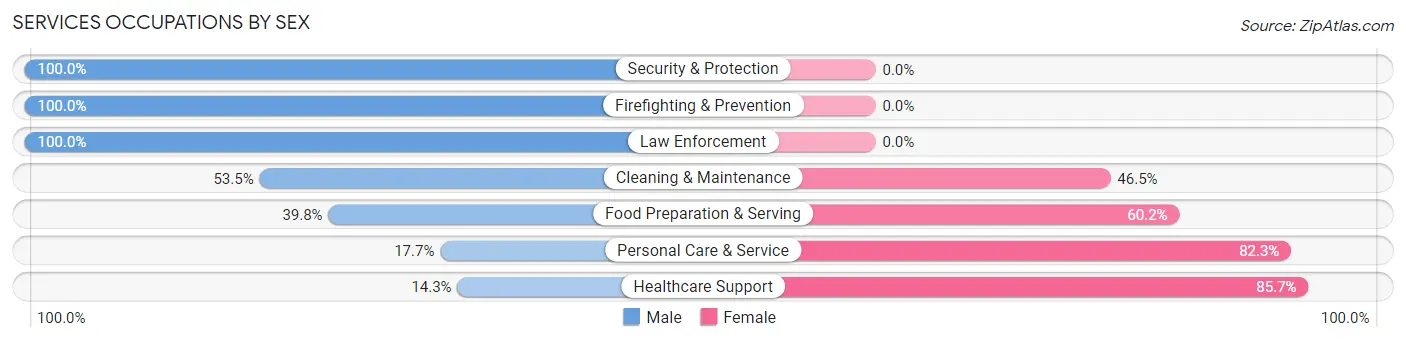
Services Occupations by Sex
Within the Services occupations in Collinsville, the most male-oriented occupations are Security & Protection (100.0%), Firefighting & Prevention (100.0%), and Law Enforcement (100.0%), while the most female-oriented occupations are Healthcare Support (85.7%), Personal Care & Service (82.3%), and Food Preparation & Serving (60.2%).
| Occupation | Male | Female |
| Healthcare Support | 10 (14.3%) | 60 (85.7%) |
| Security & Protection | 69 (100.0%) | 0 (0.0%) |
| Firefighting & Prevention | 18 (100.0%) | 0 (0.0%) |
| Law Enforcement | 51 (100.0%) | 0 (0.0%) |
| Food Preparation & Serving | 47 (39.8%) | 71 (60.2%) |
| Cleaning & Maintenance | 46 (53.5%) | 40 (46.5%) |
| Personal Care & Service | 20 (17.7%) | 93 (82.3%) |
| Total (Category) | 192 (42.1%) | 264 (57.9%) |
| Total (Overall) | 2,333 (58.1%) | 1,686 (41.9%) |
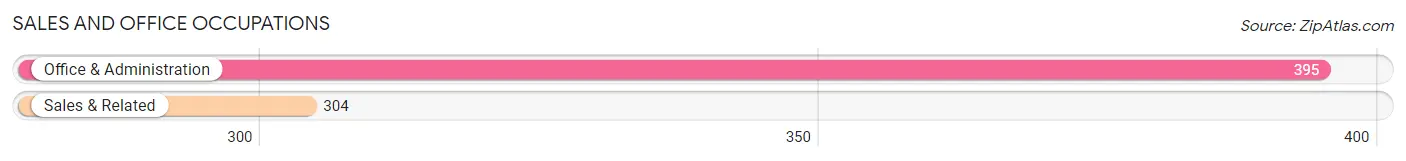
Sales and Office Occupations
The most common Sales and Office occupations in Collinsville are Office & Administration (395 | 9.8%), and Sales & Related (304 | 7.6%).
Sales and Office Occupations by Sex
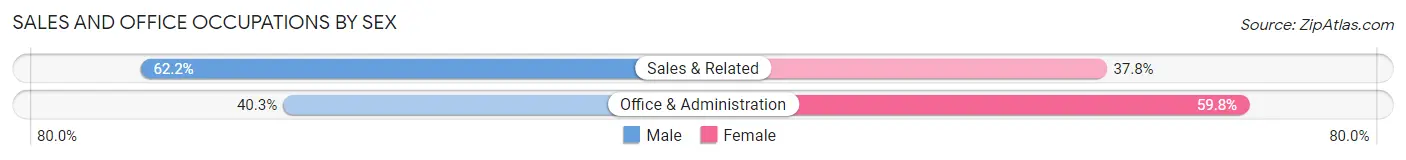
| Occupation | Male | Female |
| Sales & Related | 189 (62.2%) | 115 (37.8%) |
| Office & Administration | 159 (40.3%) | 236 (59.8%) |
| Total (Category) | 348 (49.8%) | 351 (50.2%) |
| Total (Overall) | 2,333 (58.1%) | 1,686 (41.9%) |
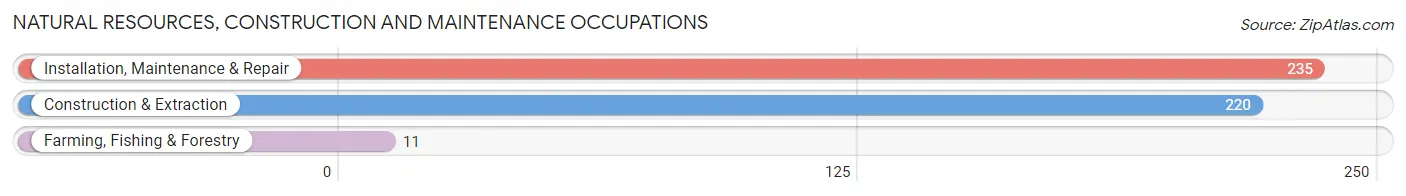
Natural Resources, Construction and Maintenance Occupations
The most common Natural Resources, Construction and Maintenance occupations in Collinsville are Installation, Maintenance & Repair (235 | 5.9%), Construction & Extraction (220 | 5.5%), and Farming, Fishing & Forestry (11 | 0.3%).
Natural Resources, Construction and Maintenance Occupations by Sex
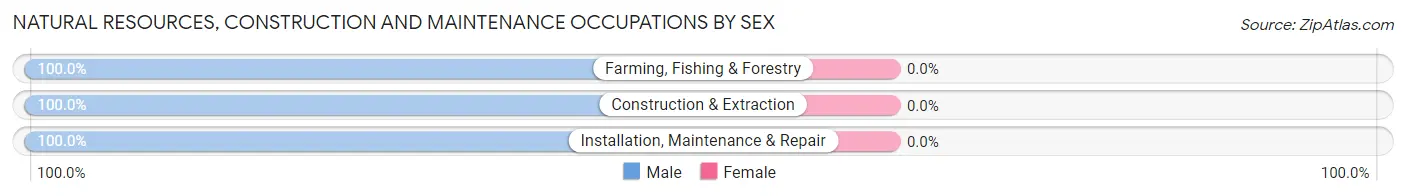
| Occupation | Male | Female |
| Farming, Fishing & Forestry | 11 (100.0%) | 0 (0.0%) |
| Construction & Extraction | 220 (100.0%) | 0 (0.0%) |
| Installation, Maintenance & Repair | 235 (100.0%) | 0 (0.0%) |
| Total (Category) | 466 (100.0%) | 0 (0.0%) |
| Total (Overall) | 2,333 (58.1%) | 1,686 (41.9%) |
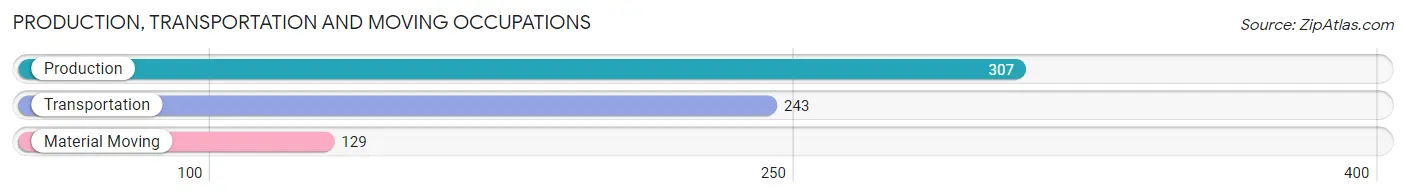
Production, Transportation and Moving Occupations
The most common Production, Transportation and Moving occupations in Collinsville are Production (307 | 7.6%), Transportation (243 | 6.0%), and Material Moving (129 | 3.2%).
Production, Transportation and Moving Occupations by Sex
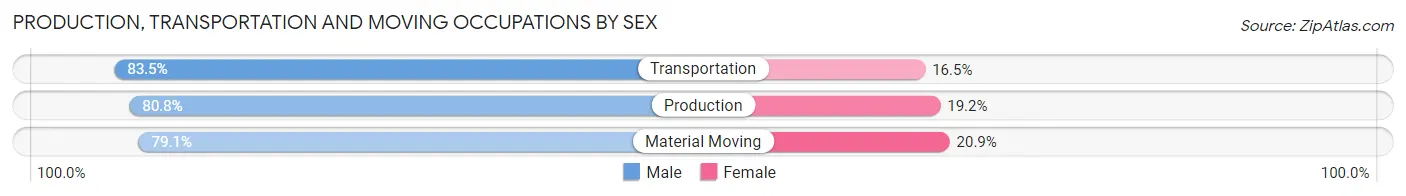
| Occupation | Male | Female |
| Production | 248 (80.8%) | 59 (19.2%) |
| Transportation | 203 (83.5%) | 40 (16.5%) |
| Material Moving | 102 (79.1%) | 27 (20.9%) |
| Total (Category) | 553 (81.4%) | 126 (18.6%) |
| Total (Overall) | 2,333 (58.1%) | 1,686 (41.9%) |
Employment Industries by Sex in Collinsville
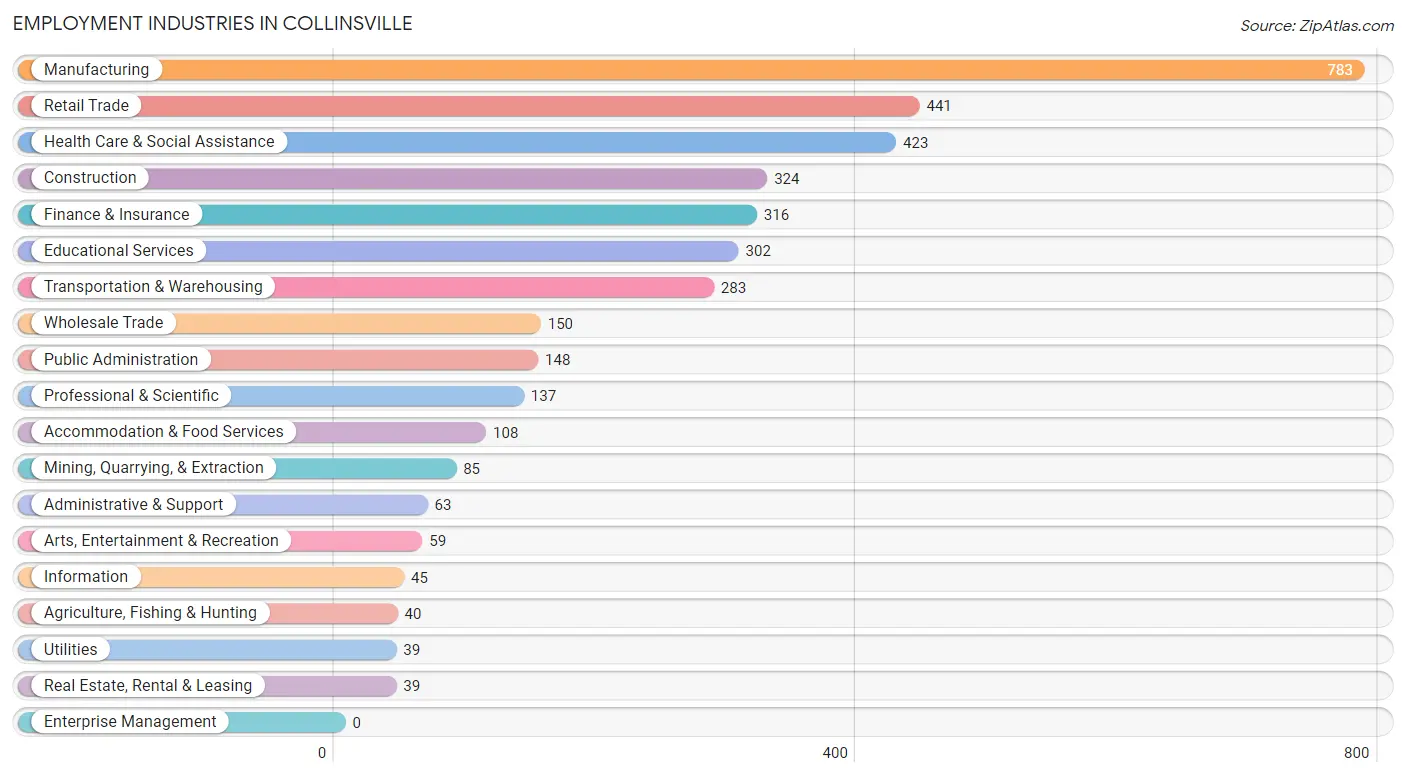
Employment Industries in Collinsville
The major employment industries in Collinsville include Manufacturing (783 | 19.5%), Retail Trade (441 | 11.0%), Health Care & Social Assistance (423 | 10.5%), Construction (324 | 8.1%), and Finance & Insurance (316 | 7.9%).
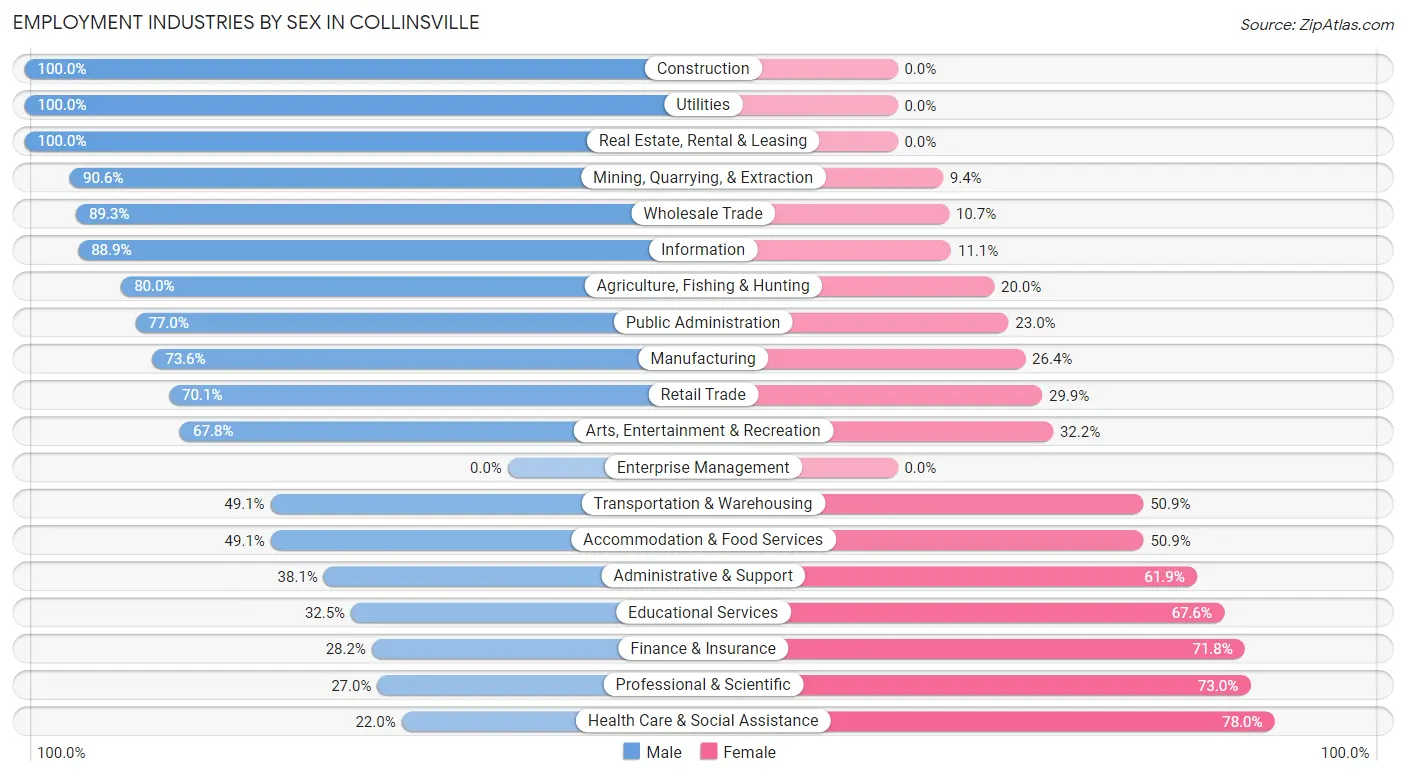
Employment Industries by Sex in Collinsville
The Collinsville industries that see more men than women are Construction (100.0%), Utilities (100.0%), and Real Estate, Rental & Leasing (100.0%), whereas the industries that tend to have a higher number of women are Health Care & Social Assistance (78.0%), Professional & Scientific (73.0%), and Finance & Insurance (71.8%).
| Industry | Male | Female |
| Agriculture, Fishing & Hunting | 32 (80.0%) | 8 (20.0%) |
| Mining, Quarrying, & Extraction | 77 (90.6%) | 8 (9.4%) |
| Construction | 324 (100.0%) | 0 (0.0%) |
| Manufacturing | 576 (73.6%) | 207 (26.4%) |
| Wholesale Trade | 134 (89.3%) | 16 (10.7%) |
| Retail Trade | 309 (70.1%) | 132 (29.9%) |
| Transportation & Warehousing | 139 (49.1%) | 144 (50.9%) |
| Utilities | 39 (100.0%) | 0 (0.0%) |
| Information | 40 (88.9%) | 5 (11.1%) |
| Finance & Insurance | 89 (28.2%) | 227 (71.8%) |
| Real Estate, Rental & Leasing | 39 (100.0%) | 0 (0.0%) |
| Professional & Scientific | 37 (27.0%) | 100 (73.0%) |
| Enterprise Management | 0 (0.0%) | 0 (0.0%) |
| Administrative & Support | 24 (38.1%) | 39 (61.9%) |
| Educational Services | 98 (32.5%) | 204 (67.5%) |
| Health Care & Social Assistance | 93 (22.0%) | 330 (78.0%) |
| Arts, Entertainment & Recreation | 40 (67.8%) | 19 (32.2%) |
| Accommodation & Food Services | 53 (49.1%) | 55 (50.9%) |
| Public Administration | 114 (77.0%) | 34 (23.0%) |
| Total | 2,333 (58.1%) | 1,686 (41.9%) |
Education in Collinsville
School Enrollment in Collinsville
The most common levels of schooling among the 2,041 students in Collinsville are high school (506 | 24.8%), middle school (436 | 21.4%), and college / undergraduate (429 | 21.0%).
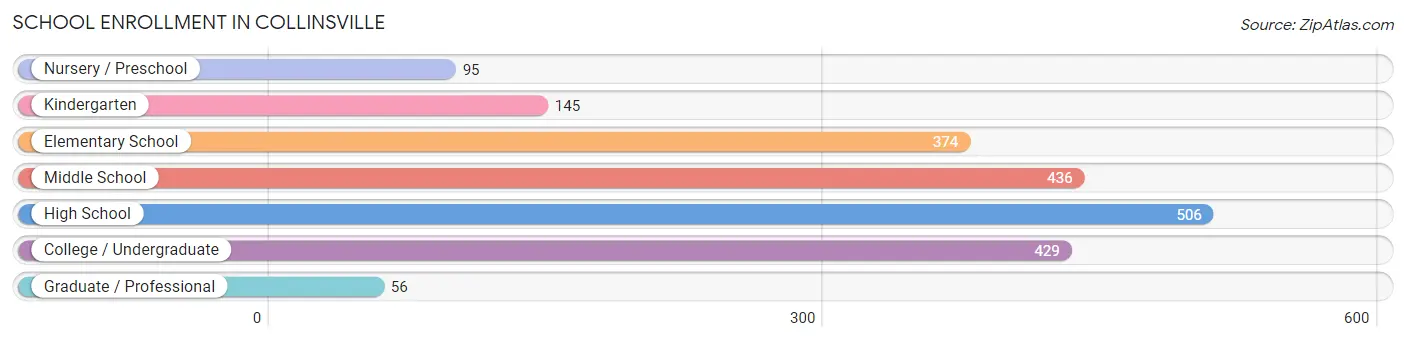
| School Level | # Students | % Students |
| Nursery / Preschool | 95 | 4.6% |
| Kindergarten | 145 | 7.1% |
| Elementary School | 374 | 18.3% |
| Middle School | 436 | 21.4% |
| High School | 506 | 24.8% |
| College / Undergraduate | 429 | 21.0% |
| Graduate / Professional | 56 | 2.7% |
| Total | 2,041 | 100.0% |
School Enrollment by Age by Funding Source in Collinsville
Out of a total of 2,041 students who are enrolled in schools in Collinsville, 194 (9.5%) attend a private institution, while the remaining 1,847 (90.5%) are enrolled in public schools. The age group of 25 to 34 year olds has the highest likelihood of being enrolled in private schools, with 41 (36.9% in the age bracket) enrolled. Conversely, the age group of 18 to 19 year olds has the lowest likelihood of being enrolled in a private school, with 229 (100.0% in the age bracket) attending a public institution.
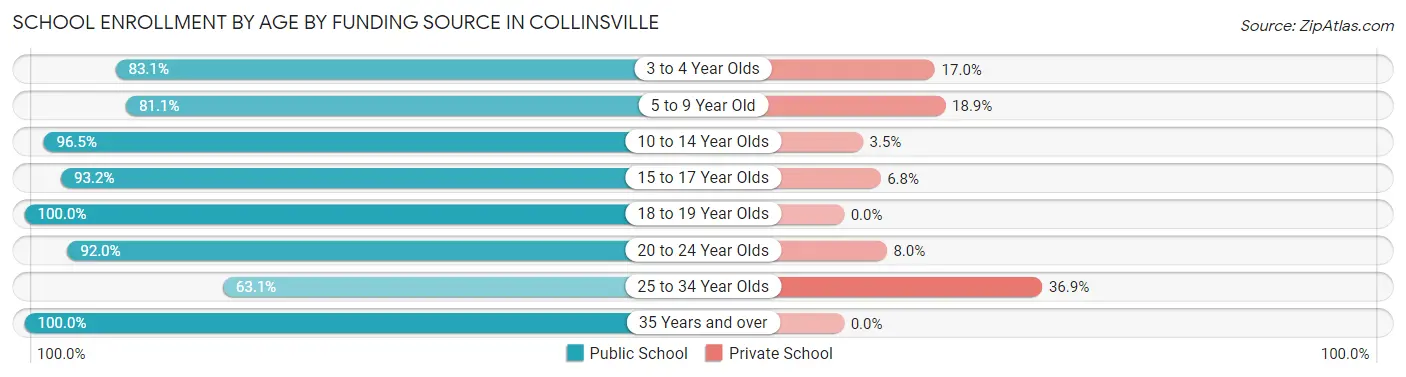
| Age Bracket | Public School | Private School |
| 3 to 4 Year Olds | 49 (83.1%) | 10 (17.0%) |
| 5 to 9 Year Old | 395 (81.1%) | 92 (18.9%) |
| 10 to 14 Year Olds | 628 (96.5%) | 23 (3.5%) |
| 15 to 17 Year Olds | 233 (93.2%) | 17 (6.8%) |
| 18 to 19 Year Olds | 229 (100.0%) | 0 (0.0%) |
| 20 to 24 Year Olds | 127 (92.0%) | 11 (8.0%) |
| 25 to 34 Year Olds | 70 (63.1%) | 41 (36.9%) |
| 35 Years and over | 116 (100.0%) | 0 (0.0%) |
| Total | 1,847 (90.5%) | 194 (9.5%) |
Educational Attainment by Field of Study in Collinsville
Business (307 | 22.0%), education (280 | 20.1%), social sciences (103 | 7.4%), arts & humanities (102 | 7.3%), and visual & performing arts (99 | 7.1%) are the most common fields of study among 1,396 individuals in Collinsville who have obtained a bachelor's degree or higher.
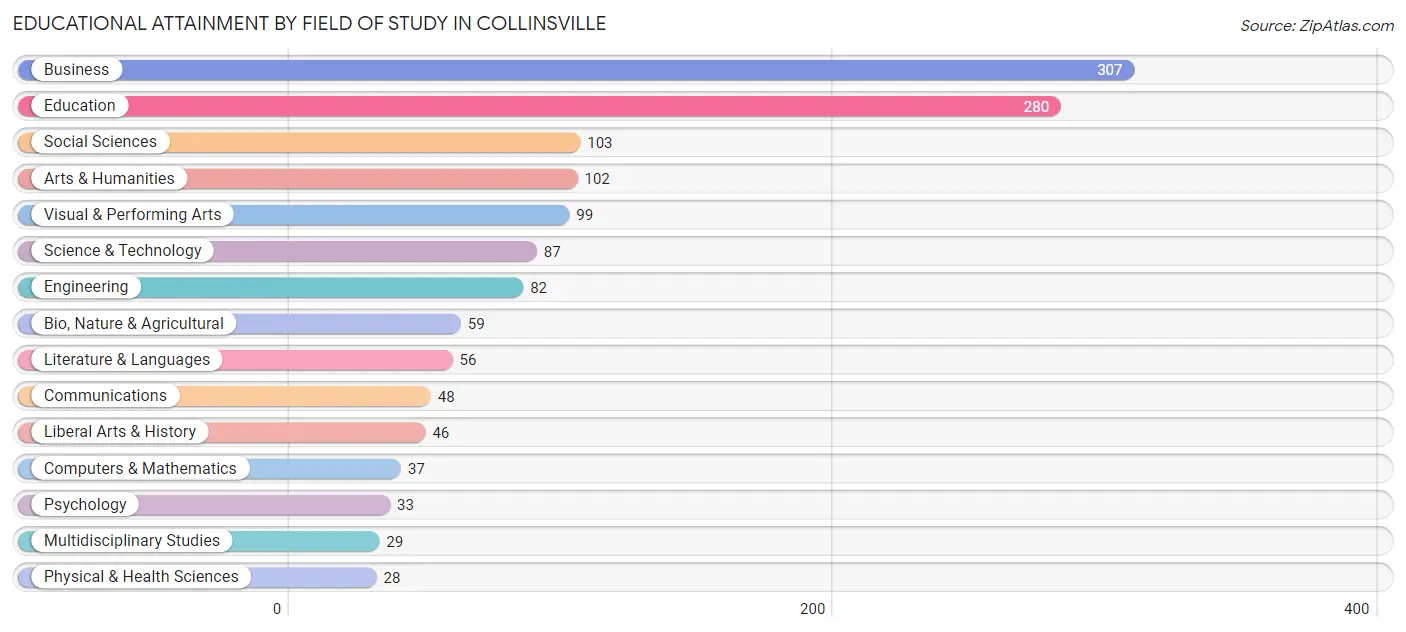
| Field of Study | # Graduates | % Graduates |
| Computers & Mathematics | 37 | 2.6% |
| Bio, Nature & Agricultural | 59 | 4.2% |
| Physical & Health Sciences | 28 | 2.0% |
| Psychology | 33 | 2.4% |
| Social Sciences | 103 | 7.4% |
| Engineering | 82 | 5.9% |
| Multidisciplinary Studies | 29 | 2.1% |
| Science & Technology | 87 | 6.2% |
| Business | 307 | 22.0% |
| Education | 280 | 20.1% |
| Literature & Languages | 56 | 4.0% |
| Liberal Arts & History | 46 | 3.3% |
| Visual & Performing Arts | 99 | 7.1% |
| Communications | 48 | 3.4% |
| Arts & Humanities | 102 | 7.3% |
| Total | 1,396 | 100.0% |
Transportation & Commute in Collinsville
Vehicle Availability by Sex in Collinsville
The most prevalent vehicle ownership categories in Collinsville are males with 2 vehicles (969, accounting for 43.4%) and females with 2 vehicles (736, making up 58.6%).
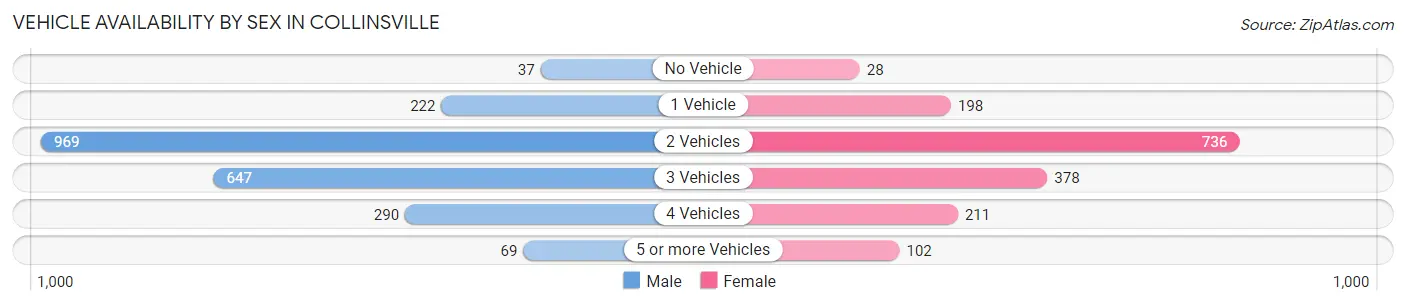
| Vehicles Available | Male | Female |
| No Vehicle | 37 (1.7%) | 28 (1.7%) |
| 1 Vehicle | 222 (9.9%) | 198 (12.0%) |
| 2 Vehicles | 969 (43.4%) | 736 (44.5%) |
| 3 Vehicles | 647 (29.0%) | 378 (22.9%) |
| 4 Vehicles | 290 (13.0%) | 211 (12.8%) |
| 5 or more Vehicles | 69 (3.1%) | 102 (6.2%) |
| Total | 2,234 (100.0%) | 1,653 (100.0%) |
Commute Time in Collinsville
The most frequently occuring commute durations in Collinsville are 30 to 34 minutes (744 commuters, 20.1%), 20 to 24 minutes (690 commuters, 18.7%), and 25 to 29 minutes (496 commuters, 13.4%).
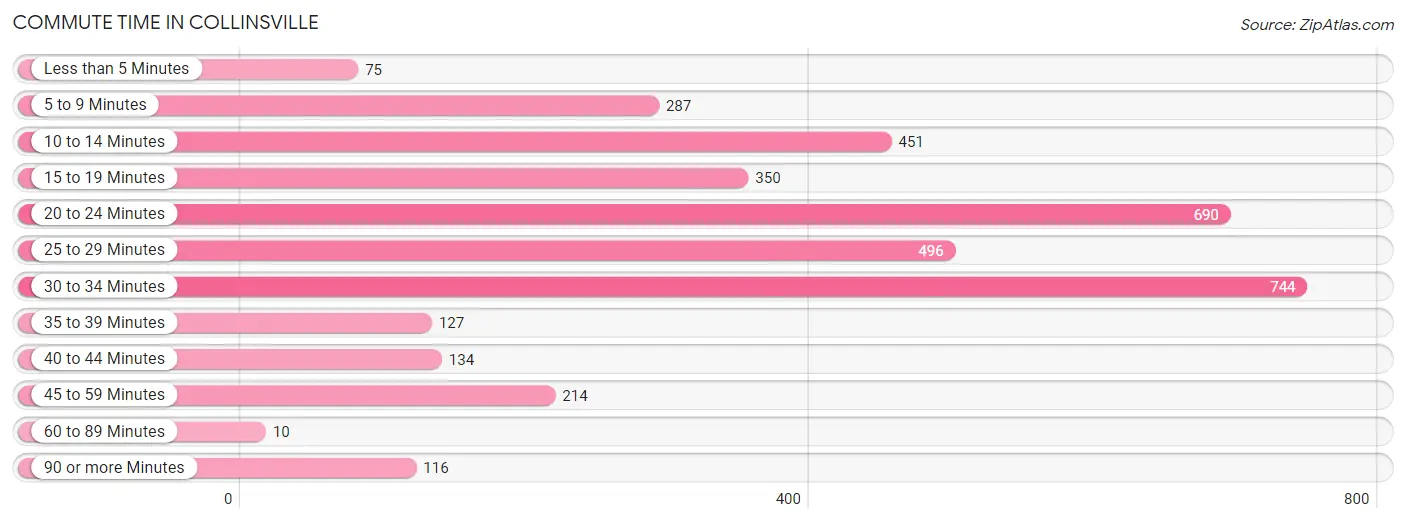
| Commute Time | # Commuters | % Commuters |
| Less than 5 Minutes | 75 | 2.0% |
| 5 to 9 Minutes | 287 | 7.8% |
| 10 to 14 Minutes | 451 | 12.2% |
| 15 to 19 Minutes | 350 | 9.5% |
| 20 to 24 Minutes | 690 | 18.7% |
| 25 to 29 Minutes | 496 | 13.4% |
| 30 to 34 Minutes | 744 | 20.1% |
| 35 to 39 Minutes | 127 | 3.4% |
| 40 to 44 Minutes | 134 | 3.6% |
| 45 to 59 Minutes | 214 | 5.8% |
| 60 to 89 Minutes | 10 | 0.3% |
| 90 or more Minutes | 116 | 3.1% |
Commute Time by Sex in Collinsville
The most common commute times in Collinsville are 30 to 34 minutes (528 commuters, 24.5%) for males and 10 to 14 minutes (264 commuters, 17.2%) for females.
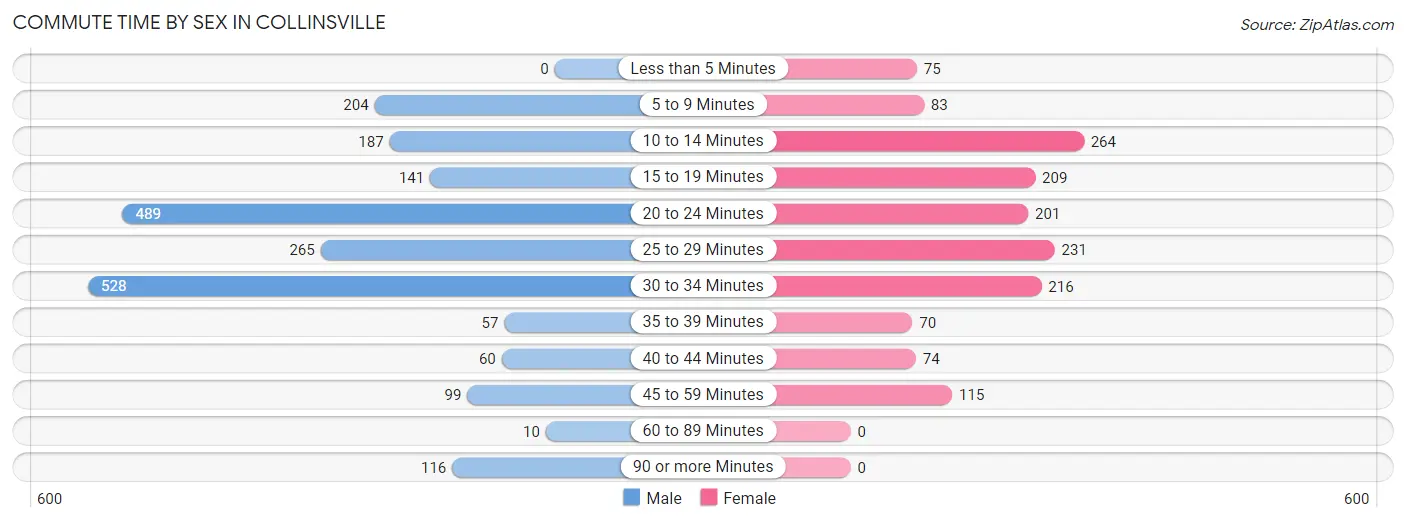
| Commute Time | Male | Female |
| Less than 5 Minutes | 0 (0.0%) | 75 (4.9%) |
| 5 to 9 Minutes | 204 (9.5%) | 83 (5.4%) |
| 10 to 14 Minutes | 187 (8.7%) | 264 (17.2%) |
| 15 to 19 Minutes | 141 (6.5%) | 209 (13.6%) |
| 20 to 24 Minutes | 489 (22.7%) | 201 (13.1%) |
| 25 to 29 Minutes | 265 (12.3%) | 231 (15.0%) |
| 30 to 34 Minutes | 528 (24.5%) | 216 (14.0%) |
| 35 to 39 Minutes | 57 (2.6%) | 70 (4.5%) |
| 40 to 44 Minutes | 60 (2.8%) | 74 (4.8%) |
| 45 to 59 Minutes | 99 (4.6%) | 115 (7.5%) |
| 60 to 89 Minutes | 10 (0.5%) | 0 (0.0%) |
| 90 or more Minutes | 116 (5.4%) | 0 (0.0%) |
Time of Departure to Work by Sex in Collinsville
The most frequent times of departure to work in Collinsville are 7:00 AM to 7:29 AM (480, 22.3%) for males and 7:00 AM to 7:29 AM (305, 19.8%) for females.
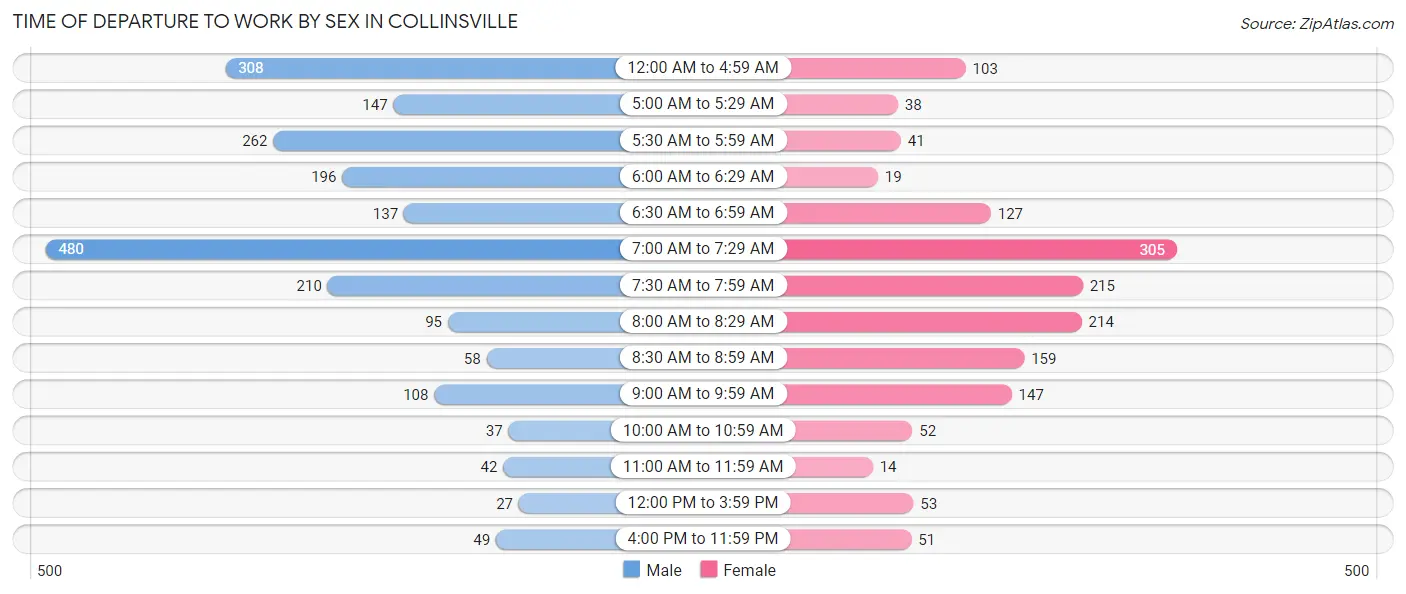
| Time of Departure | Male | Female |
| 12:00 AM to 4:59 AM | 308 (14.3%) | 103 (6.7%) |
| 5:00 AM to 5:29 AM | 147 (6.8%) | 38 (2.5%) |
| 5:30 AM to 5:59 AM | 262 (12.1%) | 41 (2.7%) |
| 6:00 AM to 6:29 AM | 196 (9.1%) | 19 (1.2%) |
| 6:30 AM to 6:59 AM | 137 (6.4%) | 127 (8.3%) |
| 7:00 AM to 7:29 AM | 480 (22.3%) | 305 (19.8%) |
| 7:30 AM to 7:59 AM | 210 (9.7%) | 215 (14.0%) |
| 8:00 AM to 8:29 AM | 95 (4.4%) | 214 (13.9%) |
| 8:30 AM to 8:59 AM | 58 (2.7%) | 159 (10.3%) |
| 9:00 AM to 9:59 AM | 108 (5.0%) | 147 (9.6%) |
| 10:00 AM to 10:59 AM | 37 (1.7%) | 52 (3.4%) |
| 11:00 AM to 11:59 AM | 42 (1.9%) | 14 (0.9%) |
| 12:00 PM to 3:59 PM | 27 (1.3%) | 53 (3.5%) |
| 4:00 PM to 11:59 PM | 49 (2.3%) | 51 (3.3%) |
| Total | 2,156 (100.0%) | 1,538 (100.0%) |
Housing Occupancy in Collinsville
Occupancy by Ownership in Collinsville
Of the total 3,095 dwellings in Collinsville, owner-occupied units account for 2,286 (73.9%), while renter-occupied units make up 809 (26.1%).
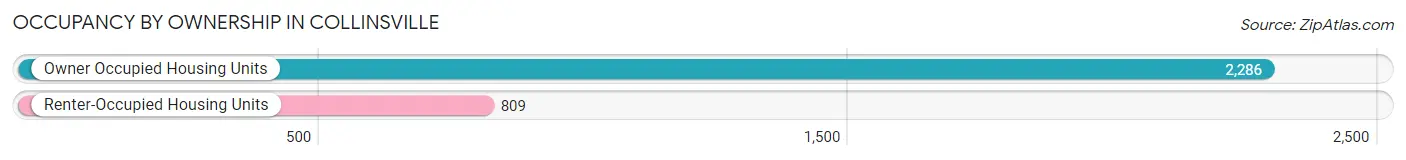
| Occupancy | # Housing Units | % Housing Units |
| Owner Occupied Housing Units | 2,286 | 73.9% |
| Renter-Occupied Housing Units | 809 | 26.1% |
| Total Occupied Housing Units | 3,095 | 100.0% |
Occupancy by Household Size in Collinsville
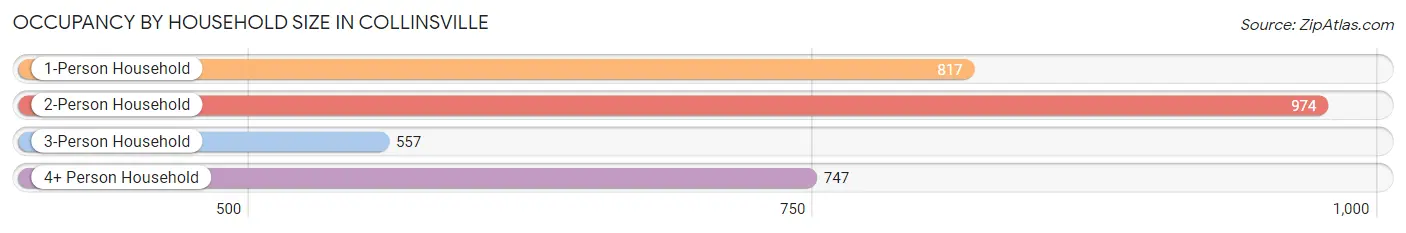
| Household Size | # Housing Units | % Housing Units |
| 1-Person Household | 817 | 26.4% |
| 2-Person Household | 974 | 31.5% |
| 3-Person Household | 557 | 18.0% |
| 4+ Person Household | 747 | 24.1% |
| Total Housing Units | 3,095 | 100.0% |
Occupancy by Ownership by Household Size in Collinsville
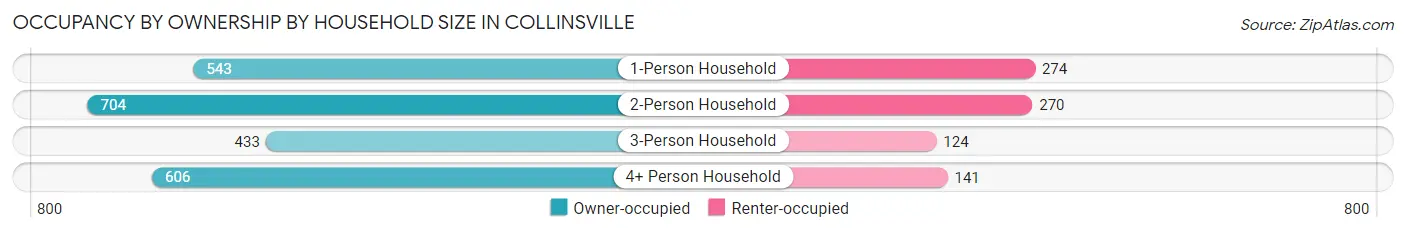
| Household Size | Owner-occupied | Renter-occupied |
| 1-Person Household | 543 (66.5%) | 274 (33.5%) |
| 2-Person Household | 704 (72.3%) | 270 (27.7%) |
| 3-Person Household | 433 (77.7%) | 124 (22.3%) |
| 4+ Person Household | 606 (81.1%) | 141 (18.9%) |
| Total Housing Units | 2,286 (73.9%) | 809 (26.1%) |
Occupancy by Educational Attainment in Collinsville
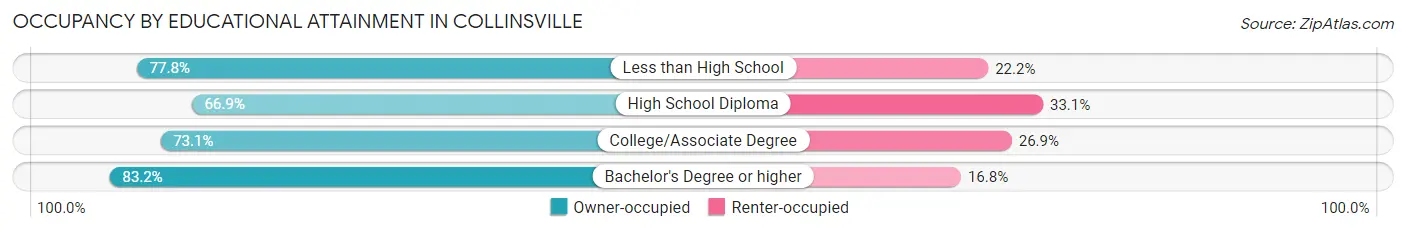
| Household Size | Owner-occupied | Renter-occupied |
| Less than High School | 133 (77.8%) | 38 (22.2%) |
| High School Diploma | 643 (66.9%) | 318 (33.1%) |
| College/Associate Degree | 892 (73.1%) | 328 (26.9%) |
| Bachelor's Degree or higher | 618 (83.2%) | 125 (16.8%) |
Occupancy by Age of Householder in Collinsville
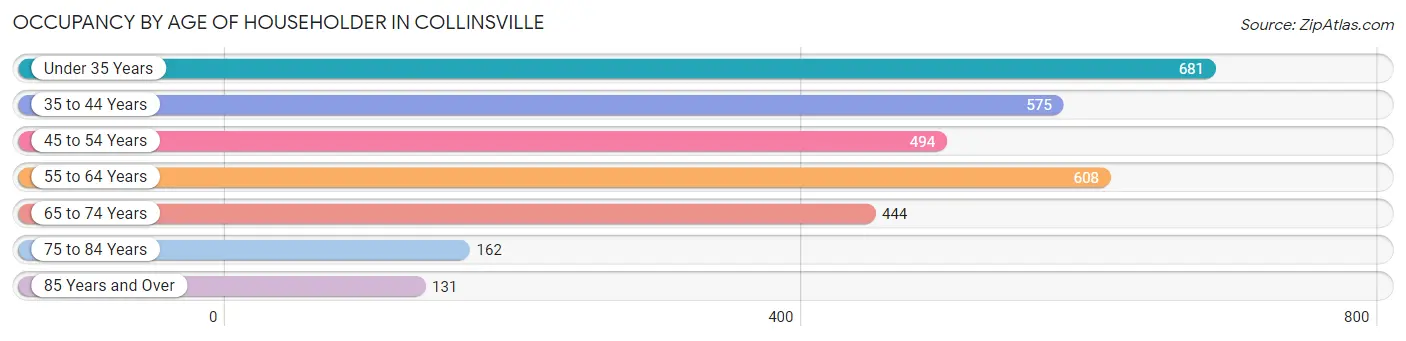
| Age Bracket | # Households | % Households |
| Under 35 Years | 681 | 22.0% |
| 35 to 44 Years | 575 | 18.6% |
| 45 to 54 Years | 494 | 16.0% |
| 55 to 64 Years | 608 | 19.6% |
| 65 to 74 Years | 444 | 14.3% |
| 75 to 84 Years | 162 | 5.2% |
| 85 Years and Over | 131 | 4.2% |
| Total | 3,095 | 100.0% |
Housing Finances in Collinsville
Median Income by Occupancy in Collinsville
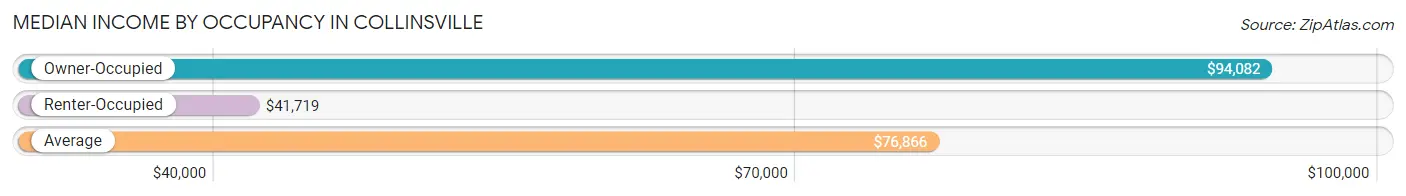
| Occupancy Type | # Households | Median Income |
| Owner-Occupied | 2,286 (73.9%) | $94,082 |
| Renter-Occupied | 809 (26.1%) | $41,719 |
| Average | 3,095 (100.0%) | $76,866 |
Occupancy by Householder Income Bracket in Collinsville
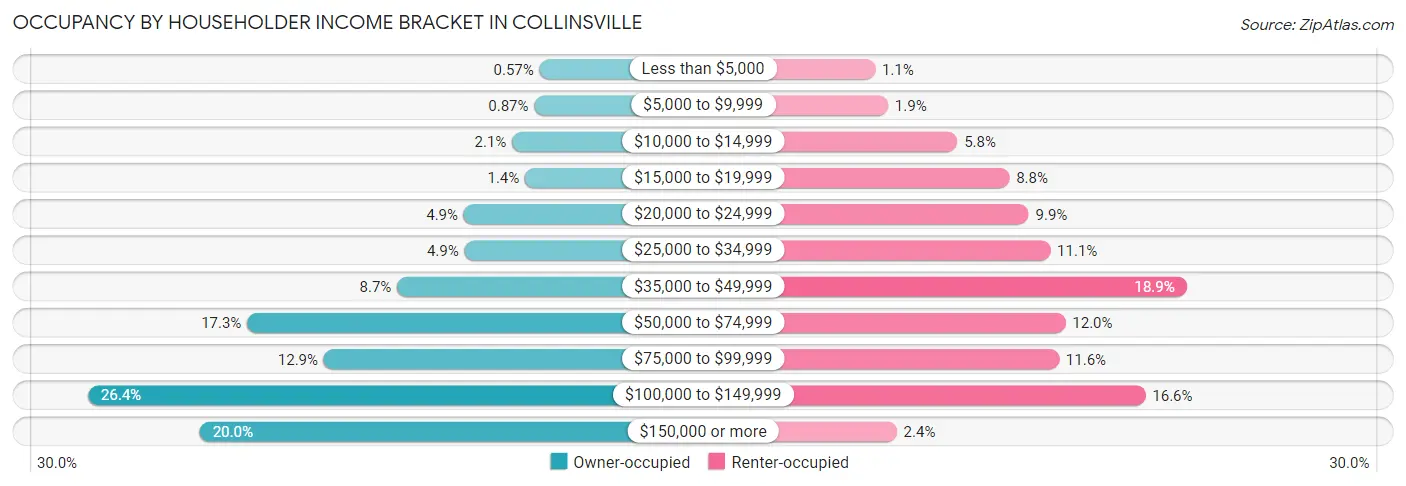
| Income Bracket | Owner-occupied | Renter-occupied |
| Less than $5,000 | 13 (0.6%) | 9 (1.1%) |
| $5,000 to $9,999 | 20 (0.9%) | 15 (1.8%) |
| $10,000 to $14,999 | 49 (2.1%) | 47 (5.8%) |
| $15,000 to $19,999 | 32 (1.4%) | 71 (8.8%) |
| $20,000 to $24,999 | 112 (4.9%) | 80 (9.9%) |
| $25,000 to $34,999 | 111 (4.9%) | 90 (11.1%) |
| $35,000 to $49,999 | 199 (8.7%) | 153 (18.9%) |
| $50,000 to $74,999 | 395 (17.3%) | 97 (12.0%) |
| $75,000 to $99,999 | 295 (12.9%) | 94 (11.6%) |
| $100,000 to $149,999 | 603 (26.4%) | 134 (16.6%) |
| $150,000 or more | 457 (20.0%) | 19 (2.4%) |
| Total | 2,286 (100.0%) | 809 (100.0%) |
Monthly Housing Cost Tiers in Collinsville
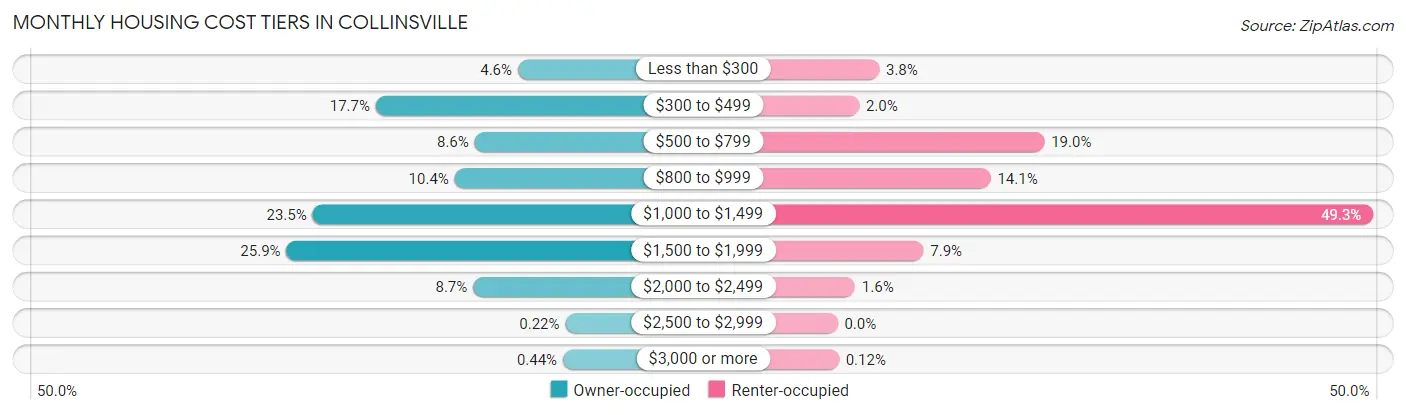
| Monthly Cost | Owner-occupied | Renter-occupied |
| Less than $300 | 105 (4.6%) | 31 (3.8%) |
| $300 to $499 | 404 (17.7%) | 16 (2.0%) |
| $500 to $799 | 196 (8.6%) | 154 (19.0%) |
| $800 to $999 | 238 (10.4%) | 114 (14.1%) |
| $1,000 to $1,499 | 537 (23.5%) | 399 (49.3%) |
| $1,500 to $1,999 | 592 (25.9%) | 64 (7.9%) |
| $2,000 to $2,499 | 199 (8.7%) | 13 (1.6%) |
| $2,500 to $2,999 | 5 (0.2%) | 0 (0.0%) |
| $3,000 or more | 10 (0.4%) | 1 (0.1%) |
| Total | 2,286 (100.0%) | 809 (100.0%) |
Physical Housing Characteristics in Collinsville
Housing Structures in Collinsville
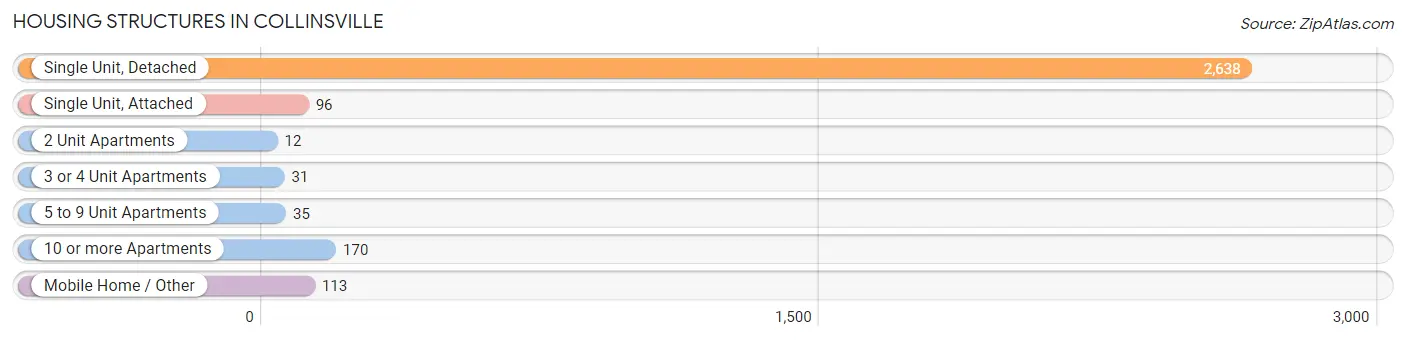
| Structure Type | # Housing Units | % Housing Units |
| Single Unit, Detached | 2,638 | 85.2% |
| Single Unit, Attached | 96 | 3.1% |
| 2 Unit Apartments | 12 | 0.4% |
| 3 or 4 Unit Apartments | 31 | 1.0% |
| 5 to 9 Unit Apartments | 35 | 1.1% |
| 10 or more Apartments | 170 | 5.5% |
| Mobile Home / Other | 113 | 3.6% |
| Total | 3,095 | 100.0% |
Housing Structures by Occupancy in Collinsville
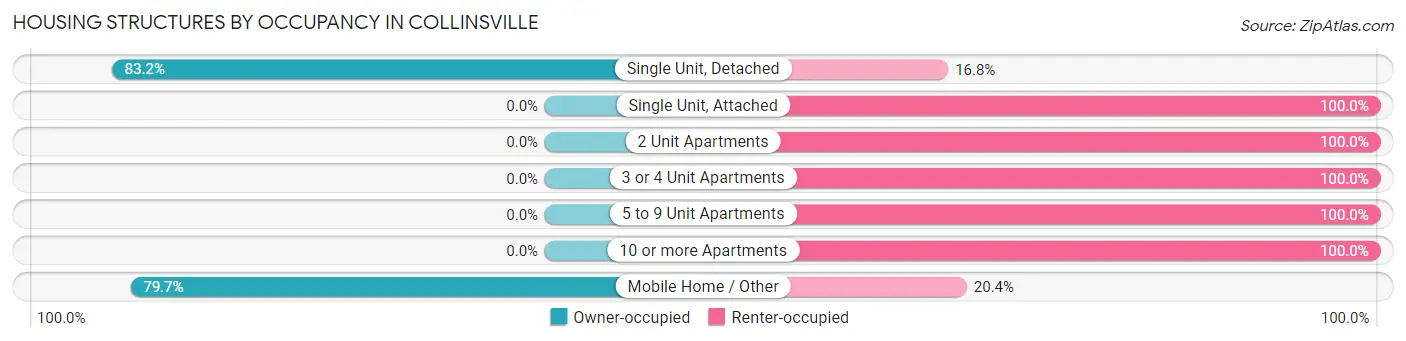
| Structure Type | Owner-occupied | Renter-occupied |
| Single Unit, Detached | 2,196 (83.2%) | 442 (16.8%) |
| Single Unit, Attached | 0 (0.0%) | 96 (100.0%) |
| 2 Unit Apartments | 0 (0.0%) | 12 (100.0%) |
| 3 or 4 Unit Apartments | 0 (0.0%) | 31 (100.0%) |
| 5 to 9 Unit Apartments | 0 (0.0%) | 35 (100.0%) |
| 10 or more Apartments | 0 (0.0%) | 170 (100.0%) |
| Mobile Home / Other | 90 (79.6%) | 23 (20.3%) |
| Total | 2,286 (73.9%) | 809 (26.1%) |
Housing Structures by Number of Rooms in Collinsville
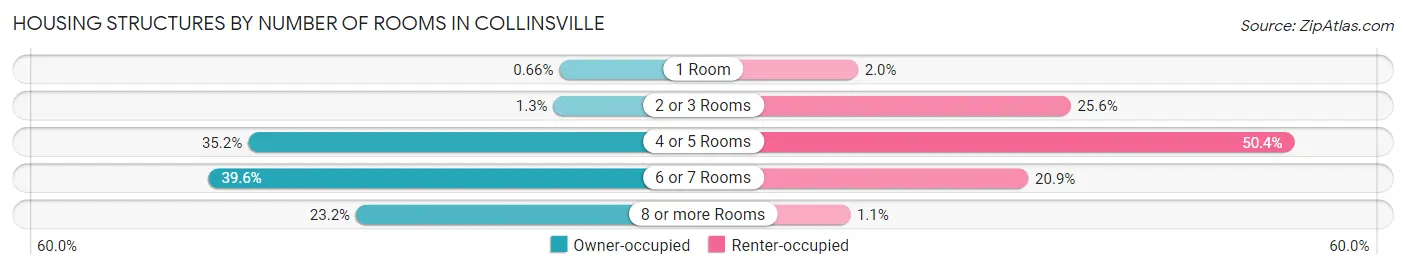
| Number of Rooms | Owner-occupied | Renter-occupied |
| 1 Room | 15 (0.7%) | 16 (2.0%) |
| 2 or 3 Rooms | 30 (1.3%) | 207 (25.6%) |
| 4 or 5 Rooms | 805 (35.2%) | 408 (50.4%) |
| 6 or 7 Rooms | 905 (39.6%) | 169 (20.9%) |
| 8 or more Rooms | 531 (23.2%) | 9 (1.1%) |
| Total | 2,286 (100.0%) | 809 (100.0%) |
Housing Structure by Heating Type in Collinsville
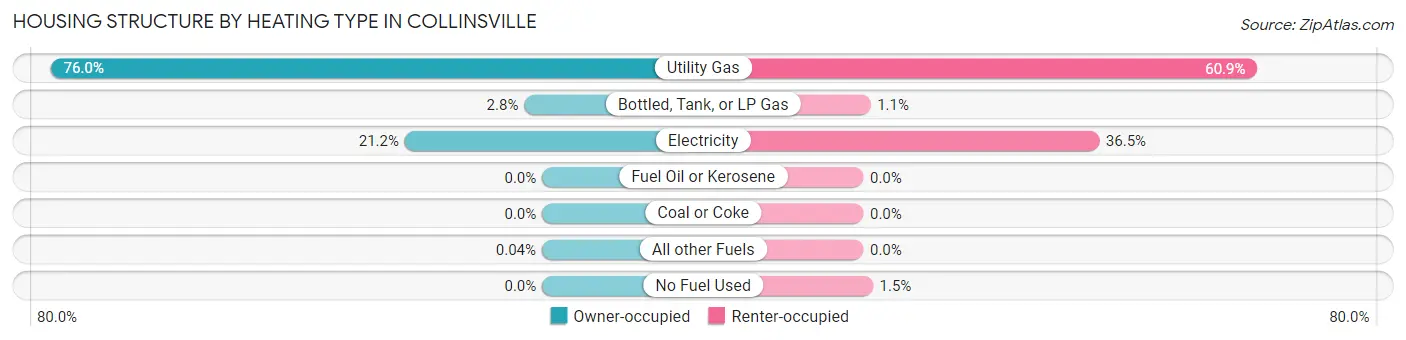
| Heating Type | Owner-occupied | Renter-occupied |
| Utility Gas | 1,737 (76.0%) | 493 (60.9%) |
| Bottled, Tank, or LP Gas | 63 (2.8%) | 9 (1.1%) |
| Electricity | 485 (21.2%) | 295 (36.5%) |
| Fuel Oil or Kerosene | 0 (0.0%) | 0 (0.0%) |
| Coal or Coke | 0 (0.0%) | 0 (0.0%) |
| All other Fuels | 1 (0.0%) | 0 (0.0%) |
| No Fuel Used | 0 (0.0%) | 12 (1.5%) |
| Total | 2,286 (100.0%) | 809 (100.0%) |
Household Vehicle Usage in Collinsville
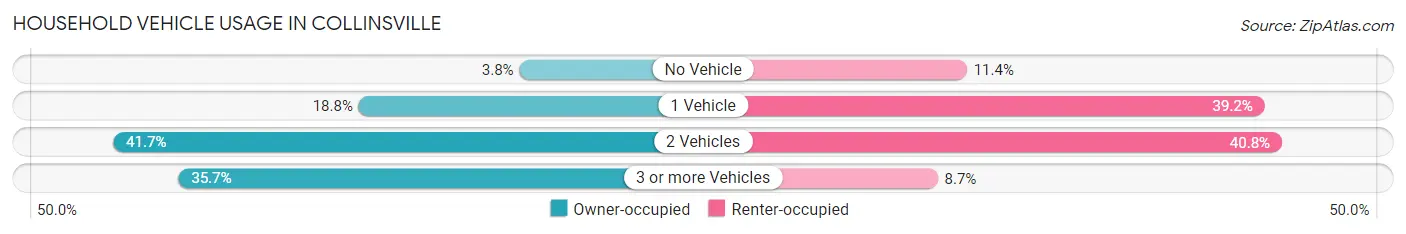
| Vehicles per Household | Owner-occupied | Renter-occupied |
| No Vehicle | 87 (3.8%) | 92 (11.4%) |
| 1 Vehicle | 430 (18.8%) | 317 (39.2%) |
| 2 Vehicles | 954 (41.7%) | 330 (40.8%) |
| 3 or more Vehicles | 815 (35.6%) | 70 (8.6%) |
| Total | 2,286 (100.0%) | 809 (100.0%) |
Real Estate & Mortgages in Collinsville
Real Estate and Mortgage Overview in Collinsville
| Characteristic | Without Mortgage | With Mortgage |
| Housing Units | 689 | 1,597 |
| Median Property Value | $175,100 | $195,700 |
| Median Household Income | $43,380 | $383 |
| Monthly Housing Costs | $394 | $10 |
| Real Estate Taxes | $1,165 | $28 |
Property Value by Mortgage Status in Collinsville
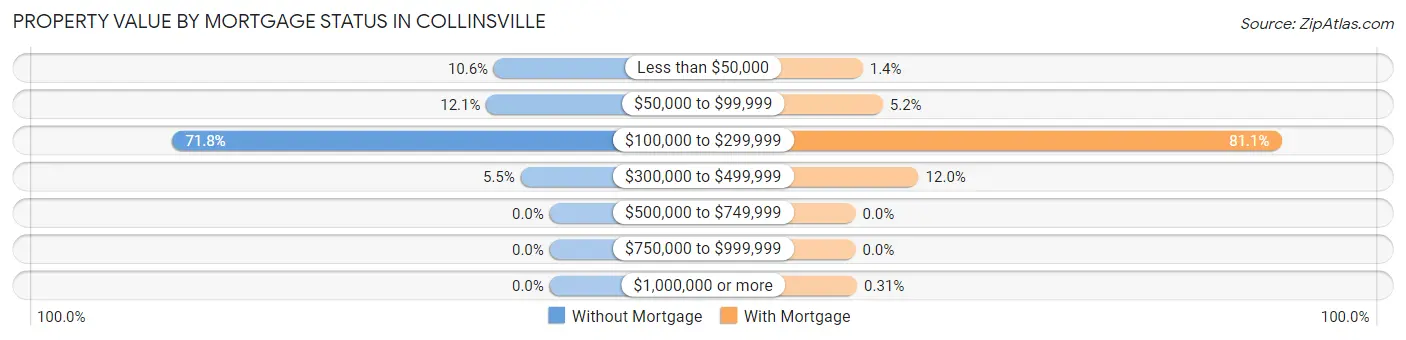
| Property Value | Without Mortgage | With Mortgage |
| Less than $50,000 | 73 (10.6%) | 22 (1.4%) |
| $50,000 to $99,999 | 83 (12.0%) | 83 (5.2%) |
| $100,000 to $299,999 | 495 (71.8%) | 1,295 (81.1%) |
| $300,000 to $499,999 | 38 (5.5%) | 192 (12.0%) |
| $500,000 to $749,999 | 0 (0.0%) | 0 (0.0%) |
| $750,000 to $999,999 | 0 (0.0%) | 0 (0.0%) |
| $1,000,000 or more | 0 (0.0%) | 5 (0.3%) |
| Total | 689 (100.0%) | 1,597 (100.0%) |
Household Income by Mortgage Status in Collinsville
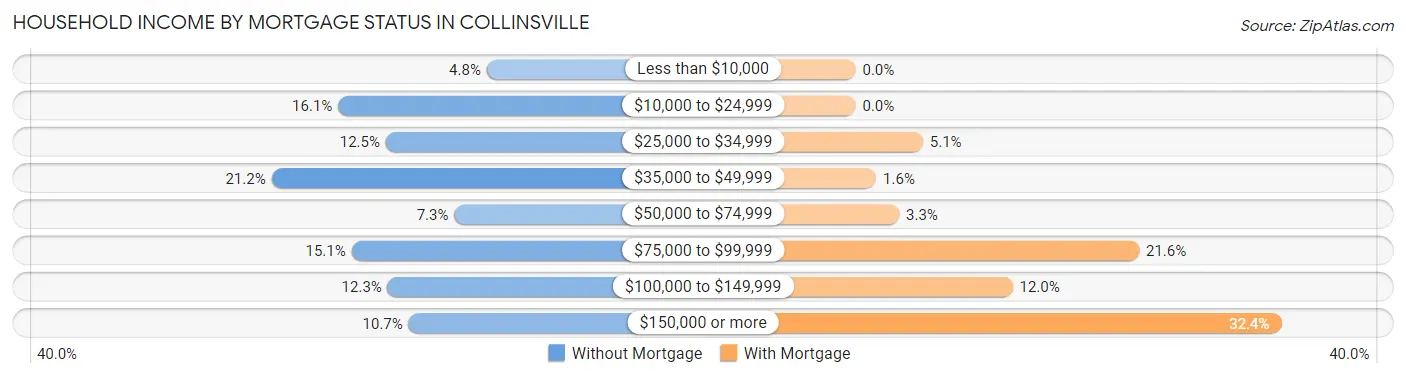
| Household Income | Without Mortgage | With Mortgage |
| Less than $10,000 | 33 (4.8%) | 0 (0.0%) |
| $10,000 to $24,999 | 111 (16.1%) | 0 (0.0%) |
| $25,000 to $34,999 | 86 (12.5%) | 82 (5.1%) |
| $35,000 to $49,999 | 146 (21.2%) | 25 (1.6%) |
| $50,000 to $74,999 | 50 (7.3%) | 53 (3.3%) |
| $75,000 to $99,999 | 104 (15.1%) | 345 (21.6%) |
| $100,000 to $149,999 | 85 (12.3%) | 191 (12.0%) |
| $150,000 or more | 74 (10.7%) | 518 (32.4%) |
| Total | 689 (100.0%) | 1,597 (100.0%) |
Property Value to Household Income Ratio in Collinsville
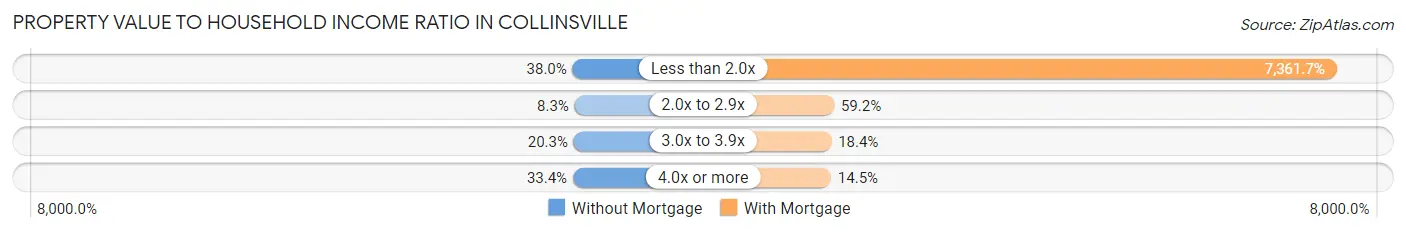
| Value-to-Income Ratio | Without Mortgage | With Mortgage |
| Less than 2.0x | 262 (38.0%) | 117,567 (7,361.7%) |
| 2.0x to 2.9x | 57 (8.3%) | 946 (59.2%) |
| 3.0x to 3.9x | 140 (20.3%) | 294 (18.4%) |
| 4.0x or more | 230 (33.4%) | 232 (14.5%) |
| Total | 689 (100.0%) | 1,597 (100.0%) |
Real Estate Taxes by Mortgage Status in Collinsville
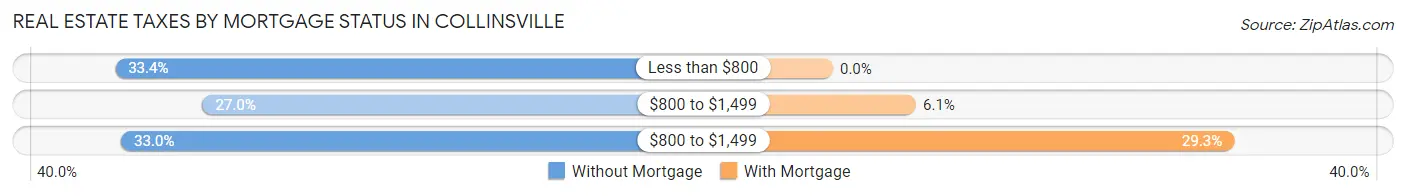
| Property Taxes | Without Mortgage | With Mortgage |
| Less than $800 | 230 (33.4%) | 0 (0.0%) |
| $800 to $1,499 | 186 (27.0%) | 97 (6.1%) |
| $800 to $1,499 | 227 (33.0%) | 468 (29.3%) |
| Total | 689 (100.0%) | 1,597 (100.0%) |
Health & Disability in Collinsville
Health Insurance Coverage by Age in Collinsville
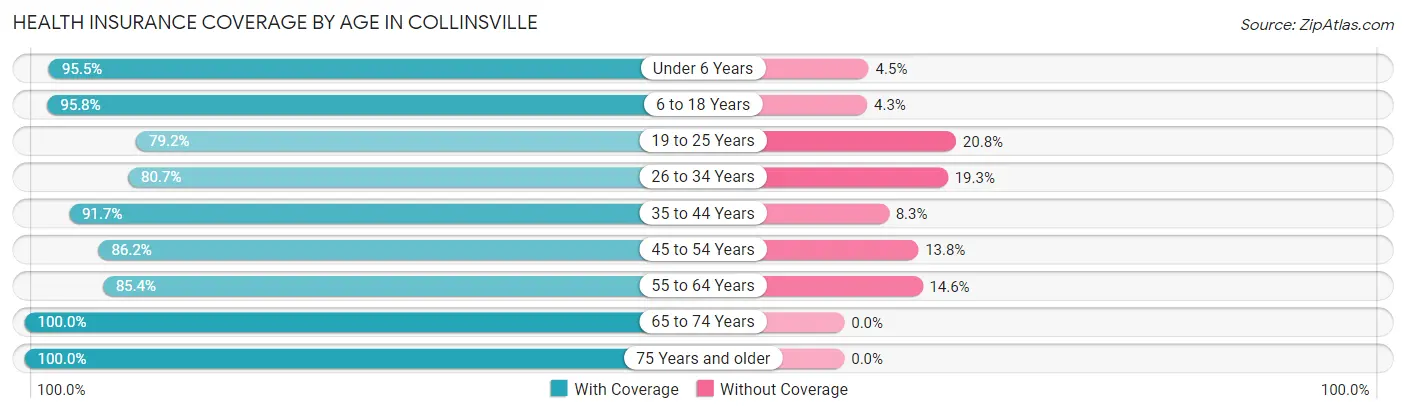
| Age Bracket | With Coverage | Without Coverage |
| Under 6 Years | 610 (95.5%) | 29 (4.5%) |
| 6 to 18 Years | 1,328 (95.8%) | 59 (4.3%) |
| 19 to 25 Years | 605 (79.2%) | 159 (20.8%) |
| 26 to 34 Years | 841 (80.7%) | 201 (19.3%) |
| 35 to 44 Years | 953 (91.7%) | 86 (8.3%) |
| 45 to 54 Years | 901 (86.2%) | 144 (13.8%) |
| 55 to 64 Years | 809 (85.4%) | 138 (14.6%) |
| 65 to 74 Years | 703 (100.0%) | 0 (0.0%) |
| 75 Years and older | 429 (100.0%) | 0 (0.0%) |
| Total | 7,179 (89.8%) | 816 (10.2%) |
Health Insurance Coverage by Citizenship Status in Collinsville
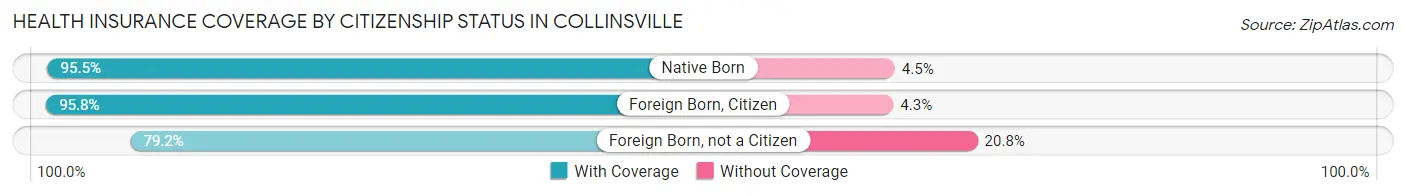
| Citizenship Status | With Coverage | Without Coverage |
| Native Born | 610 (95.5%) | 29 (4.5%) |
| Foreign Born, Citizen | 1,328 (95.8%) | 59 (4.3%) |
| Foreign Born, not a Citizen | 605 (79.2%) | 159 (20.8%) |
Health Insurance Coverage by Household Income in Collinsville
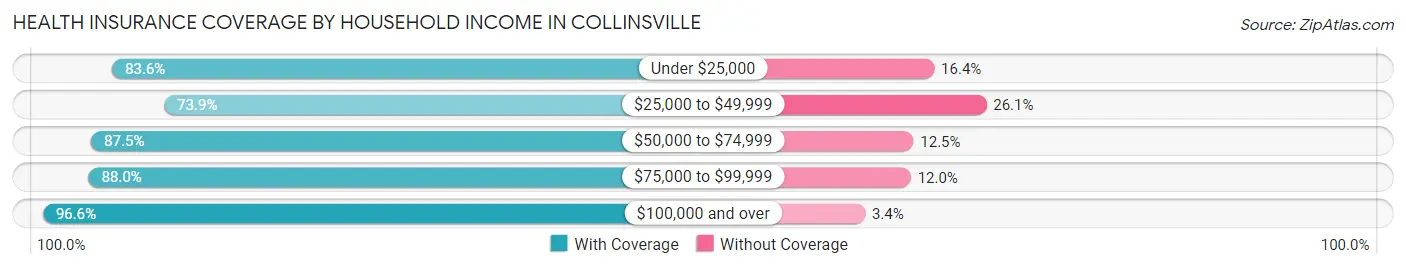
| Household Income | With Coverage | Without Coverage |
| Under $25,000 | 613 (83.6%) | 120 (16.4%) |
| $25,000 to $49,999 | 803 (73.9%) | 284 (26.1%) |
| $50,000 to $74,999 | 969 (87.5%) | 138 (12.5%) |
| $75,000 to $99,999 | 1,044 (88.0%) | 142 (12.0%) |
| $100,000 and over | 3,750 (96.6%) | 132 (3.4%) |
Public vs Private Health Insurance Coverage by Age in Collinsville
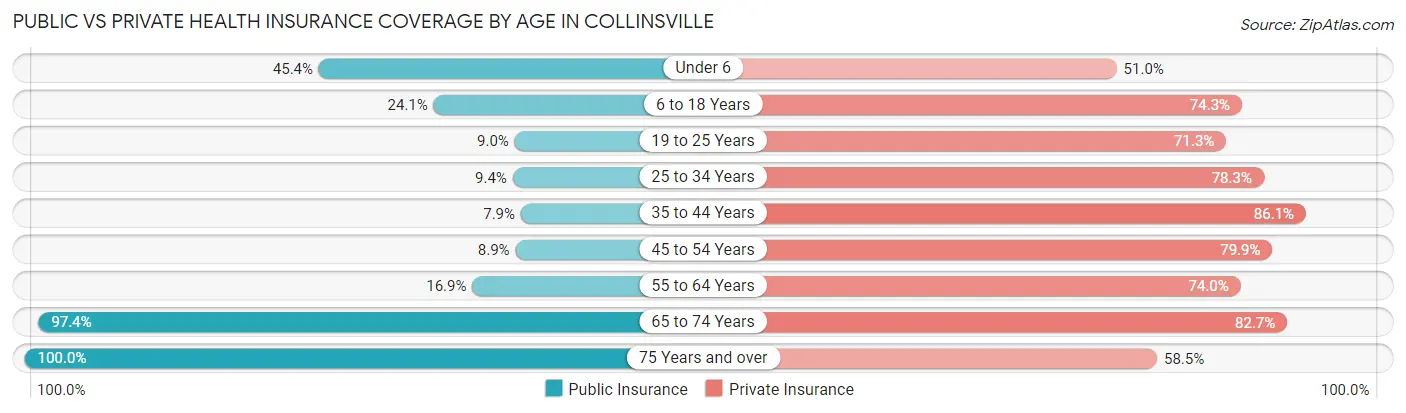
| Age Bracket | Public Insurance | Private Insurance |
| Under 6 | 290 (45.4%) | 326 (51.0%) |
| 6 to 18 Years | 334 (24.1%) | 1,030 (74.3%) |
| 19 to 25 Years | 69 (9.0%) | 545 (71.3%) |
| 25 to 34 Years | 98 (9.4%) | 816 (78.3%) |
| 35 to 44 Years | 82 (7.9%) | 895 (86.1%) |
| 45 to 54 Years | 93 (8.9%) | 835 (79.9%) |
| 55 to 64 Years | 160 (16.9%) | 701 (74.0%) |
| 65 to 74 Years | 685 (97.4%) | 581 (82.7%) |
| 75 Years and over | 429 (100.0%) | 251 (58.5%) |
| Total | 2,240 (28.0%) | 5,980 (74.8%) |
Disability Status by Sex by Age in Collinsville
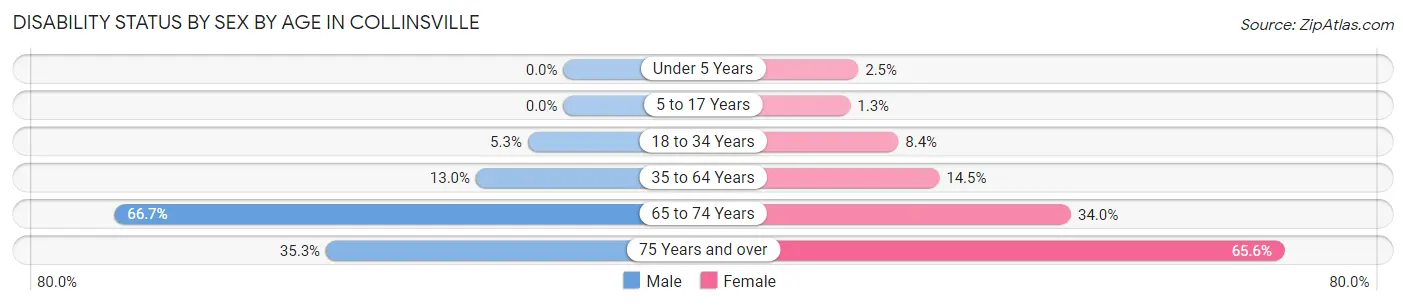
| Age Bracket | Male | Female |
| Under 5 Years | 0 (0.0%) | 6 (2.5%) |
| 5 to 17 Years | 0 (0.0%) | 9 (1.3%) |
| 18 to 34 Years | 57 (5.3%) | 70 (8.4%) |
| 35 to 64 Years | 208 (13.0%) | 207 (14.5%) |
| 65 to 74 Years | 218 (66.7%) | 128 (34.0%) |
| 75 Years and over | 61 (35.3%) | 168 (65.6%) |
Disability Class by Sex by Age in Collinsville
Disability Class: Hearing Difficulty
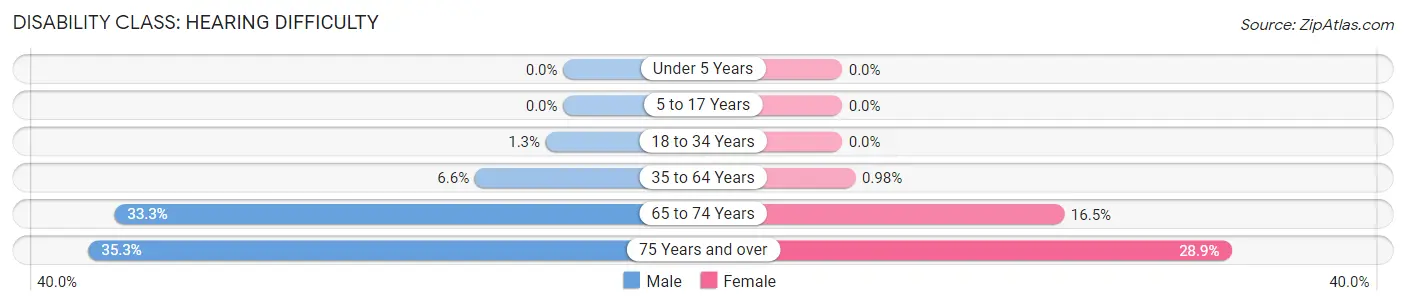
| Age Bracket | Male | Female |
| Under 5 Years | 0 (0.0%) | 0 (0.0%) |
| 5 to 17 Years | 0 (0.0%) | 0 (0.0%) |
| 18 to 34 Years | 14 (1.3%) | 0 (0.0%) |
| 35 to 64 Years | 105 (6.6%) | 14 (1.0%) |
| 65 to 74 Years | 109 (33.3%) | 62 (16.5%) |
| 75 Years and over | 61 (35.3%) | 74 (28.9%) |
Disability Class: Vision Difficulty
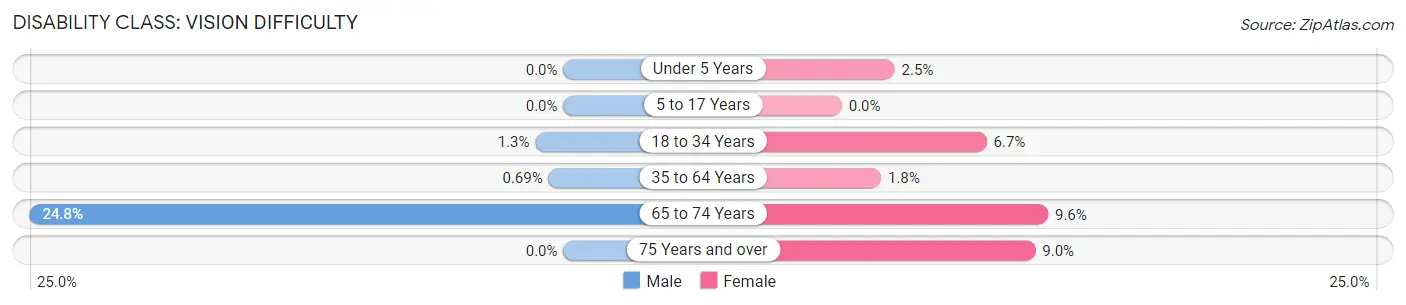
| Age Bracket | Male | Female |
| Under 5 Years | 0 (0.0%) | 6 (2.5%) |
| 5 to 17 Years | 0 (0.0%) | 0 (0.0%) |
| 18 to 34 Years | 14 (1.3%) | 56 (6.7%) |
| 35 to 64 Years | 11 (0.7%) | 26 (1.8%) |
| 65 to 74 Years | 81 (24.8%) | 36 (9.6%) |
| 75 Years and over | 0 (0.0%) | 23 (9.0%) |
Disability Class: Cognitive Difficulty
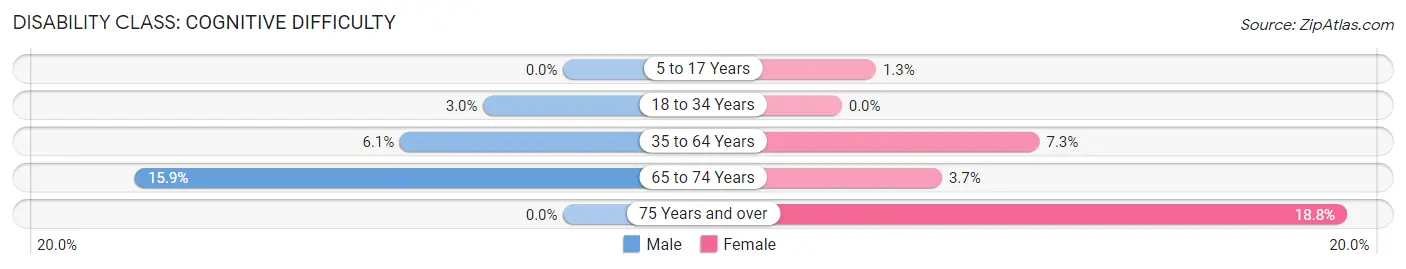
| Age Bracket | Male | Female |
| 5 to 17 Years | 0 (0.0%) | 9 (1.3%) |
| 18 to 34 Years | 32 (3.0%) | 0 (0.0%) |
| 35 to 64 Years | 97 (6.1%) | 105 (7.3%) |
| 65 to 74 Years | 52 (15.9%) | 14 (3.7%) |
| 75 Years and over | 0 (0.0%) | 48 (18.8%) |
Disability Class: Ambulatory Difficulty
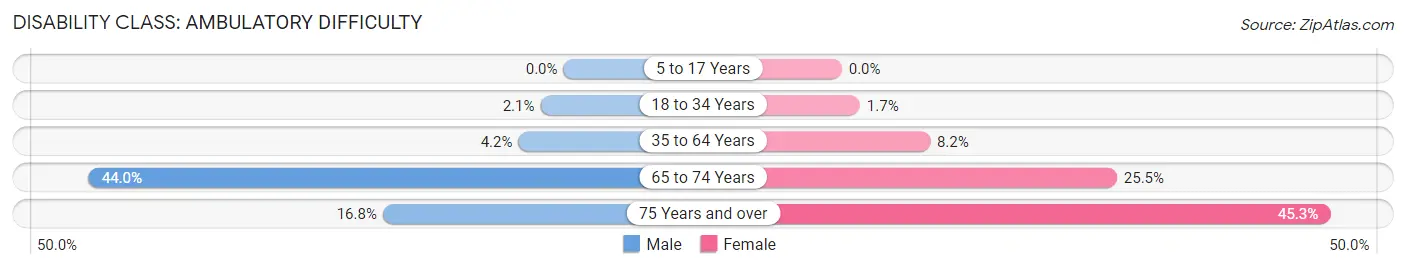
| Age Bracket | Male | Female |
| 5 to 17 Years | 0 (0.0%) | 0 (0.0%) |
| 18 to 34 Years | 23 (2.1%) | 14 (1.7%) |
| 35 to 64 Years | 67 (4.2%) | 117 (8.2%) |
| 65 to 74 Years | 144 (44.0%) | 96 (25.5%) |
| 75 Years and over | 29 (16.8%) | 116 (45.3%) |
Disability Class: Self-Care Difficulty
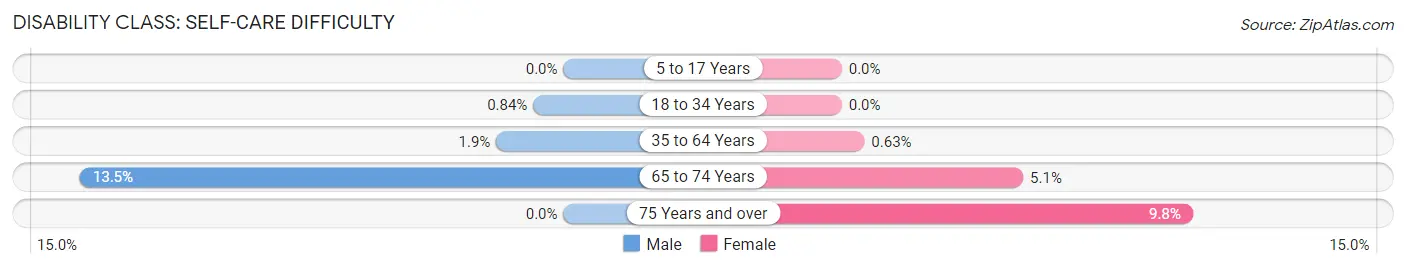
| Age Bracket | Male | Female |
| 5 to 17 Years | 0 (0.0%) | 0 (0.0%) |
| 18 to 34 Years | 9 (0.8%) | 0 (0.0%) |
| 35 to 64 Years | 30 (1.9%) | 9 (0.6%) |
| 65 to 74 Years | 44 (13.5%) | 19 (5.1%) |
| 75 Years and over | 0 (0.0%) | 25 (9.8%) |
Technology Access in Collinsville
Computing Device Access in Collinsville
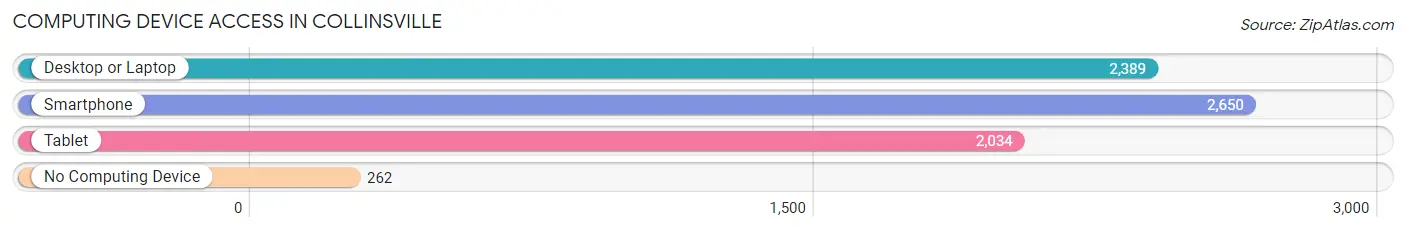
| Device Type | # Households | % Households |
| Desktop or Laptop | 2,389 | 77.2% |
| Smartphone | 2,650 | 85.6% |
| Tablet | 2,034 | 65.7% |
| No Computing Device | 262 | 8.5% |
| Total | 3,095 | 100.0% |
Internet Access in Collinsville
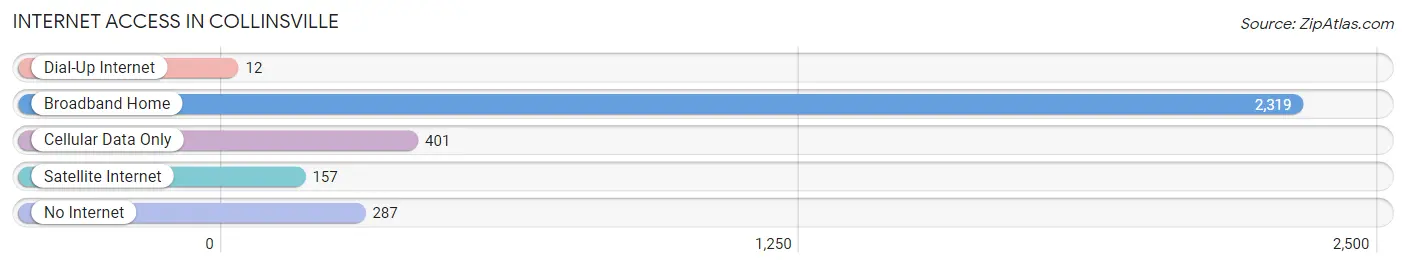
| Internet Type | # Households | % Households |
| Dial-Up Internet | 12 | 0.4% |
| Broadband Home | 2,319 | 74.9% |
| Cellular Data Only | 401 | 13.0% |
| Satellite Internet | 157 | 5.1% |
| No Internet | 287 | 9.3% |
| Total | 3,095 | 100.0% |
Collinsville Summary
History
The city of Collinsville, Oklahoma is located in the northeastern part of the state, just north of Tulsa. It is part of Tulsa County and is part of the Tulsa Metropolitan Statistical Area. The city was founded in 1883 by William and Mary Collins, who were among the first settlers in the area. The city was named after the Collins family and was incorporated in 1898.
The city of Collinsville has a rich history that dates back to the early days of the state. The area was originally inhabited by the Osage Indians, who were later displaced by the Cherokee and Creek tribes. The area was also home to a number of other Native American tribes, including the Quapaw, Shawnee, and Choctaw.
The city of Collinsville was an important stop on the Chisholm Trail, which was used by cowboys to drive cattle from Texas to Kansas. The city was also a major stop on the Missouri-Kansas-Texas Railroad, which was built in the late 1800s.
The city of Collinsville has a long history of industry and agriculture. The city was home to a number of factories, including a cotton mill, a flour mill, and a brick factory. The city was also home to a number of farms, which produced a variety of crops, including cotton, corn, wheat, and hay.
Geography
Collinsville is located in the northeastern part of Oklahoma, just north of Tulsa. It is part of Tulsa County and is part of the Tulsa Metropolitan Statistical Area. The city is situated in the Ozark Mountains and is surrounded by rolling hills and wooded areas. The city is located at the intersection of two major highways, US-169 and US-412.
The city of Collinsville has a total area of 8.3 square miles, all of which is land. The city has a humid subtropical climate, with hot summers and mild winters. The average annual temperature is around 64 degrees Fahrenheit, with an average high of around 90 degrees in the summer and an average low of around 40 degrees in the winter.
Economy
The economy of Collinsville is largely based on agriculture and manufacturing. The city is home to a number of factories, including a cotton mill, a flour mill, and a brick factory. The city is also home to a number of farms, which produce a variety of crops, including cotton, corn, wheat, and hay.
The city is also home to a number of retail stores, restaurants, and other businesses. The city is home to a number of large employers, including the Collinsville Public Schools, the Collinsville Hospital, and the Collinsville Technology Center.
Demographics
As of the 2010 census, the city of Collinsville had a population of 5,606. The racial makeup of the city was 87.3% White, 5.2% African American, 0.7% Native American, 0.7% Asian, 0.1% Pacific Islander, and 4.9% from other races. The median household income was $41,945, and the median family income was $50,945.
The city of Collinsville is served by the Collinsville Public Schools, which includes four elementary schools, one middle school, and one high school. The city is also home to a number of private schools, including the Collinsville Christian Academy and the Collinsville Montessori School.
Conclusion
Collinsville, Oklahoma is a small city located in the northeastern part of the state, just north of Tulsa. The city has a rich history that dates back to the early days of the state and has a long history of industry and agriculture. The city is home to a number of factories, farms, and other businesses, and is served by the Collinsville Public Schools. The city has a population of 5,606, with a median household income of $41,945. Collinsville is a great place to live, work, and raise a family.
Common Questions
What is Per Capita Income in Collinsville?
Per Capita income in Collinsville is $36,090.
What is the Median Family Income in Collinsville?
Median Family Income in Collinsville is $108,707.
What is the Median Household income in Collinsville?
Median Household Income in Collinsville is $76,866.
What is Income or Wage Gap in Collinsville?
Income or Wage Gap in Collinsville is 41.5%.
Women in Collinsville earn 58.5 cents for every dollar earned by a man.
What is Family Income Deficit in Collinsville?
Family Income Deficit in Collinsville is $7,906.
Families that are below poverty line in Collinsville earn $7,906 less on average than the poverty threshold level.
What is Inequality or Gini Index in Collinsville?
Inequality or Gini Index in Collinsville is 0.38.
What is the Total Population of Collinsville?
Total Population of Collinsville is 8,073.
What is the Total Male Population of Collinsville?
Total Male Population of Collinsville is 4,207.
What is the Total Female Population of Collinsville?
Total Female Population of Collinsville is 3,866.
What is the Ratio of Males per 100 Females in Collinsville?
There are 108.82 Males per 100 Females in Collinsville.
What is the Ratio of Females per 100 Males in Collinsville?
There are 91.89 Females per 100 Males in Collinsville.
What is the Median Population Age in Collinsville?
Median Population Age in Collinsville is 37.4 Years.
What is the Average Family Size in Collinsville
Average Family Size in Collinsville is 3.1 People.
What is the Average Household Size in Collinsville
Average Household Size in Collinsville is 2.6 People.
How Large is the Labor Force in Collinsville?
There are 4,389 People in the Labor Forcein in Collinsville.
What is the Percentage of People in the Labor Force in Collinsville?
69.2% of People are in the Labor Force in Collinsville.
What is the Unemployment Rate in Collinsville?
Unemployment Rate in Collinsville is 8.2%.