Ponca City, OK Map & Demographics
Ponca City Map
Ponca City Overview
$29,976
PER CAPITA INCOME
$64,708
AVG FAMILY INCOME
$51,367
AVG HOUSEHOLD INCOME
24.7%
WAGE / INCOME GAP [ % ]
75.3¢/ $1
WAGE / INCOME GAP [ $ ]
$11,819
FAMILY INCOME DEFICIT
0.47
INEQUALITY / GINI INDEX
24,441
TOTAL POPULATION
11,905
MALE POPULATION
12,536
FEMALE POPULATION
94.97
MALES / 100 FEMALES
105.30
FEMALES / 100 MALES
37.0
MEDIAN AGE
3.2
AVG FAMILY SIZE
2.5
AVG HOUSEHOLD SIZE
11,384
LABOR FORCE [ PEOPLE ]
60.2%
PERCENT IN LABOR FORCE
6.7%
UNEMPLOYMENT RATE
Ponca City Area Codes
Income in Ponca City
Income Overview in Ponca City
Per Capita Income in Ponca City is $29,976, while median incomes of families and households are $64,708 and $51,367 respectively.
| Characteristic | Number | Measure |
| Per Capita Income | 24,441 | $29,976 |
| Median Family Income | 5,738 | $64,708 |
| Mean Family Income | 5,738 | $87,378 |
| Median Household Income | 9,343 | $51,367 |
| Mean Household Income | 9,343 | $73,096 |
| Income Deficit | 5,738 | $11,819 |
| Wage / Income Gap (%) | 24,441 | 24.67% |
| Wage / Income Gap ($) | 24,441 | 75.33¢ per $1 |
| Gini / Inequality Index | 24,441 | 0.47 |
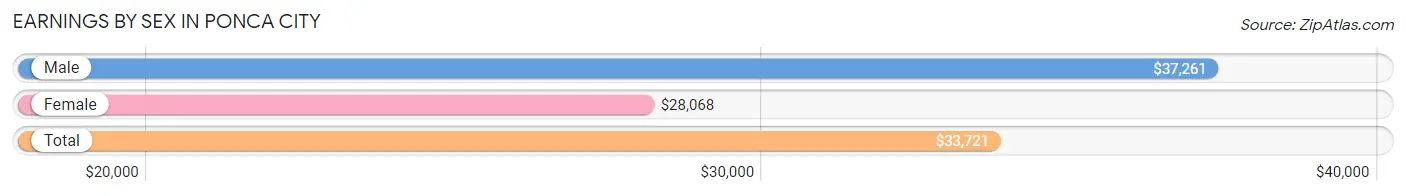
Earnings by Sex in Ponca City
Average Earnings in Ponca City are $33,721, $37,261 for men and $28,068 for women, a difference of 24.7%.
| Sex | Number | Average Earnings |
| Male | 6,259 (53.3%) | $37,261 |
| Female | 5,479 (46.7%) | $28,068 |
| Total | 11,738 (100.0%) | $33,721 |
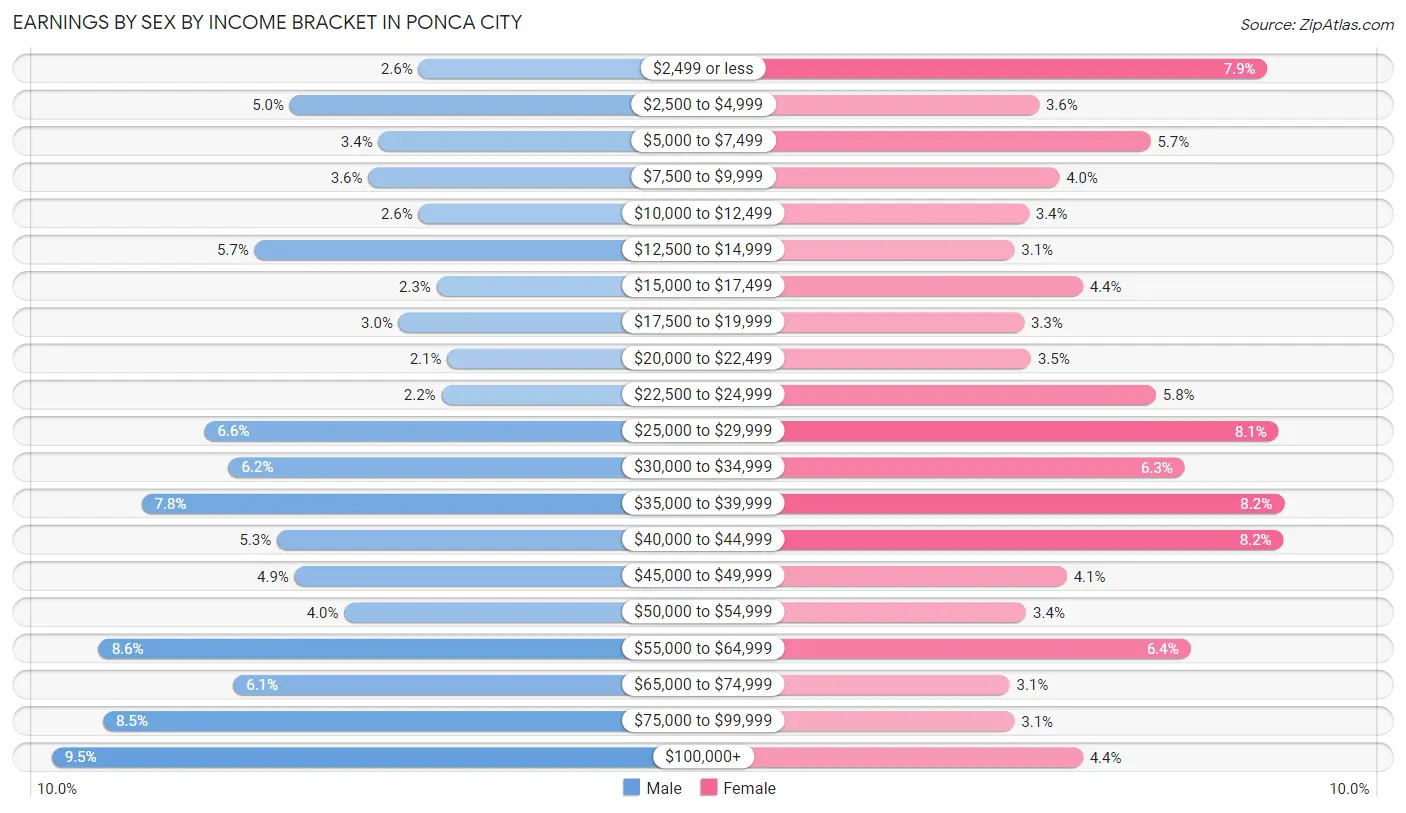
Earnings by Sex by Income Bracket in Ponca City
The most common earnings brackets in Ponca City are $100,000+ for men (594 | 9.5%) and $35,000 to $39,999 for women (449 | 8.2%).
| Income | Male | Female |
| $2,499 or less | 164 (2.6%) | 432 (7.9%) |
| $2,500 to $4,999 | 315 (5.0%) | 197 (3.6%) |
| $5,000 to $7,499 | 211 (3.4%) | 312 (5.7%) |
| $7,500 to $9,999 | 223 (3.6%) | 218 (4.0%) |
| $10,000 to $12,499 | 164 (2.6%) | 187 (3.4%) |
| $12,500 to $14,999 | 356 (5.7%) | 172 (3.1%) |
| $15,000 to $17,499 | 143 (2.3%) | 242 (4.4%) |
| $17,500 to $19,999 | 187 (3.0%) | 182 (3.3%) |
| $20,000 to $22,499 | 130 (2.1%) | 189 (3.5%) |
| $22,500 to $24,999 | 137 (2.2%) | 317 (5.8%) |
| $25,000 to $29,999 | 415 (6.6%) | 443 (8.1%) |
| $30,000 to $34,999 | 387 (6.2%) | 347 (6.3%) |
| $35,000 to $39,999 | 489 (7.8%) | 449 (8.2%) |
| $40,000 to $44,999 | 330 (5.3%) | 448 (8.2%) |
| $45,000 to $49,999 | 309 (4.9%) | 226 (4.1%) |
| $50,000 to $54,999 | 251 (4.0%) | 184 (3.4%) |
| $55,000 to $64,999 | 539 (8.6%) | 353 (6.4%) |
| $65,000 to $74,999 | 381 (6.1%) | 167 (3.0%) |
| $75,000 to $99,999 | 534 (8.5%) | 172 (3.1%) |
| $100,000+ | 594 (9.5%) | 242 (4.4%) |
| Total | 6,259 (100.0%) | 5,479 (100.0%) |
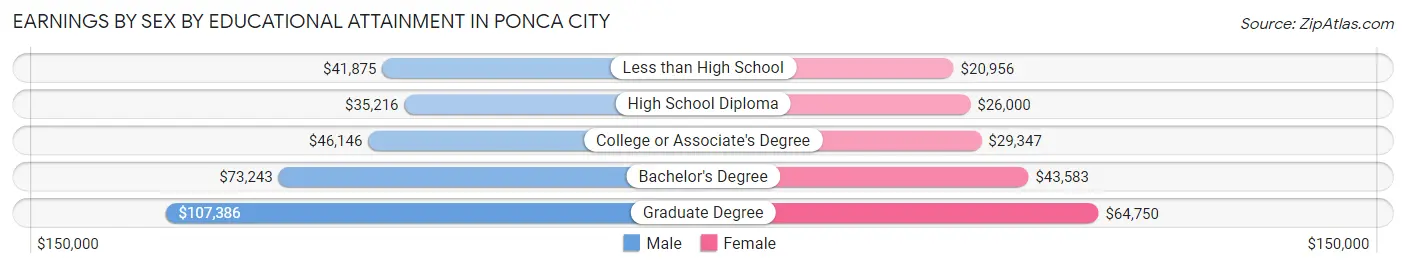
Earnings by Sex by Educational Attainment in Ponca City
Average earnings in Ponca City are $41,199 for men and $33,278 for women, a difference of 19.2%. Men with an educational attainment of graduate degree enjoy the highest average annual earnings of $107,386, while those with high school diploma education earn the least with $35,216. Women with an educational attainment of graduate degree earn the most with the average annual earnings of $64,750, while those with less than high school education have the smallest earnings of $20,956.
| Educational Attainment | Male Income | Female Income |
| Less than High School | $41,875 | $20,956 |
| High School Diploma | $35,216 | $26,000 |
| College or Associate's Degree | $46,146 | $29,347 |
| Bachelor's Degree | $73,243 | $43,583 |
| Graduate Degree | $107,386 | $64,750 |
| Total | $41,199 | $33,278 |
Family Income in Ponca City
Family Income Brackets in Ponca City
According to the Ponca City family income data, there are 1,056 families falling into the $35,000 to $49,999 income range, which is the most common income bracket and makes up 18.4% of all families. Conversely, the $15,000 to $24,999 income bracket is the least frequent group with only 230 families (4.0%) belonging to this category.
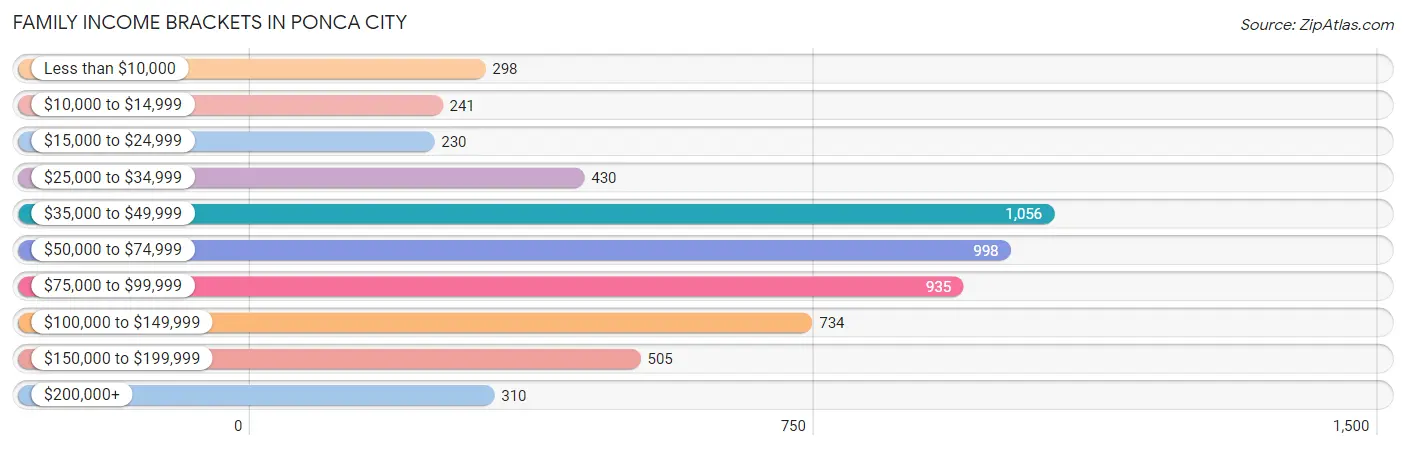
| Income Bracket | # Families | % Families |
| Less than $10,000 | 298 | 5.2% |
| $10,000 to $14,999 | 241 | 4.2% |
| $15,000 to $24,999 | 230 | 4.0% |
| $25,000 to $34,999 | 430 | 7.5% |
| $35,000 to $49,999 | 1,056 | 18.4% |
| $50,000 to $74,999 | 998 | 17.4% |
| $75,000 to $99,999 | 935 | 16.3% |
| $100,000 to $149,999 | 734 | 12.8% |
| $150,000 to $199,999 | 505 | 8.8% |
| $200,000+ | 310 | 5.4% |
Family Income by Famaliy Size in Ponca City
6-person families (179 | 3.1%) account for the highest median family income in Ponca City with $97,083 per family, while 2-person families (2,819 | 49.1%) have the highest median income of $29,976 per family member.
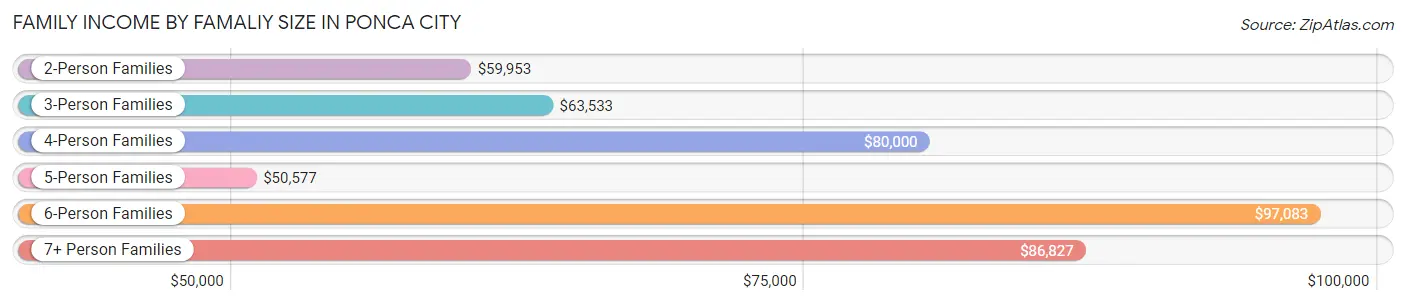
| Income Bracket | # Families | Median Income |
| 2-Person Families | 2,819 (49.1%) | $59,953 |
| 3-Person Families | 1,305 (22.7%) | $63,533 |
| 4-Person Families | 828 (14.4%) | $80,000 |
| 5-Person Families | 508 (8.8%) | $50,577 |
| 6-Person Families | 179 (3.1%) | $97,083 |
| 7+ Person Families | 99 (1.7%) | $86,827 |
| Total | 5,738 (100.0%) | $64,708 |
Family Income by Number of Earners in Ponca City
The median family income in Ponca City is $64,708, with families comprising 3+ earners (394) having the highest median family income of $111,196, while families with no earners (1,168) have the lowest median family income of $42,802, accounting for 6.9% and 20.4% of families, respectively.
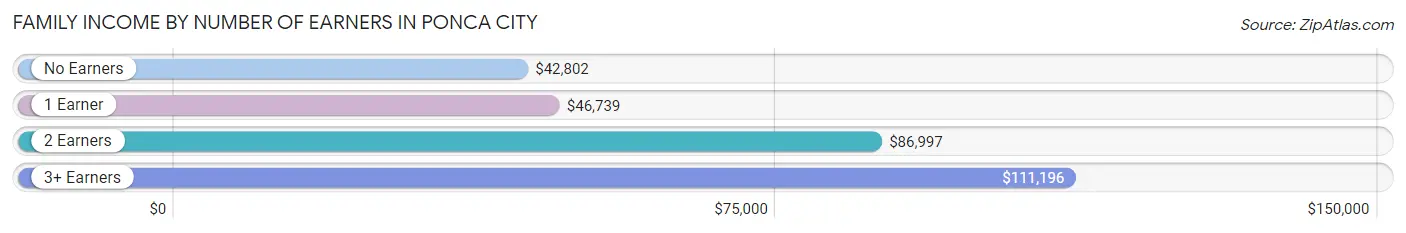
| Number of Earners | # Families | Median Income |
| No Earners | 1,168 (20.4%) | $42,802 |
| 1 Earner | 2,143 (37.3%) | $46,739 |
| 2 Earners | 2,033 (35.4%) | $86,997 |
| 3+ Earners | 394 (6.9%) | $111,196 |
| Total | 5,738 (100.0%) | $64,708 |
Household Income in Ponca City
Household Income Brackets in Ponca City
With 1,616 households falling in the category, the $50,000 to $74,999 income range is the most frequent in Ponca City, accounting for 17.3% of all households. In contrast, only 374 households (4.0%) fall into the $200,000+ income bracket, making it the least populous group.
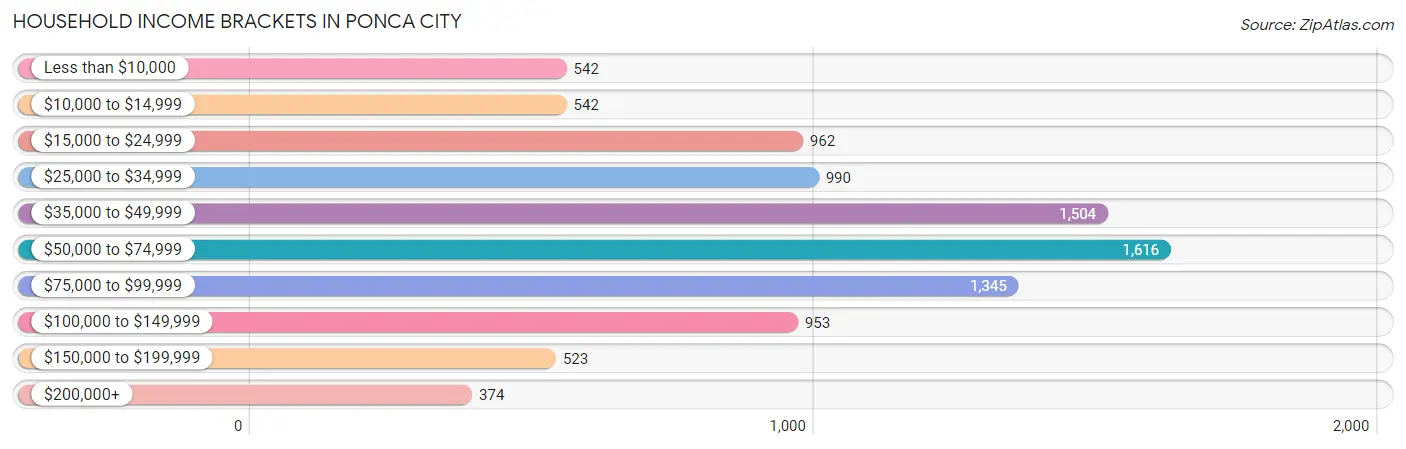
| Income Bracket | # Households | % Households |
| Less than $10,000 | 542 | 5.8% |
| $10,000 to $14,999 | 542 | 5.8% |
| $15,000 to $24,999 | 962 | 10.3% |
| $25,000 to $34,999 | 990 | 10.6% |
| $35,000 to $49,999 | 1,504 | 16.1% |
| $50,000 to $74,999 | 1,616 | 17.3% |
| $75,000 to $99,999 | 1,345 | 14.4% |
| $100,000 to $149,999 | 953 | 10.2% |
| $150,000 to $199,999 | 523 | 5.6% |
| $200,000+ | 374 | 4.0% |
Household Income by Householder Age in Ponca City
The median household income in Ponca City is $51,367, with the highest median household income of $66,875 found in the 45 to 64 years age bracket for the primary householder. A total of 2,943 households (31.5%) fall into this category. Meanwhile, the 15 to 24 years age bracket for the primary householder has the lowest median household income of $37,150, with 455 households (4.9%) in this group.
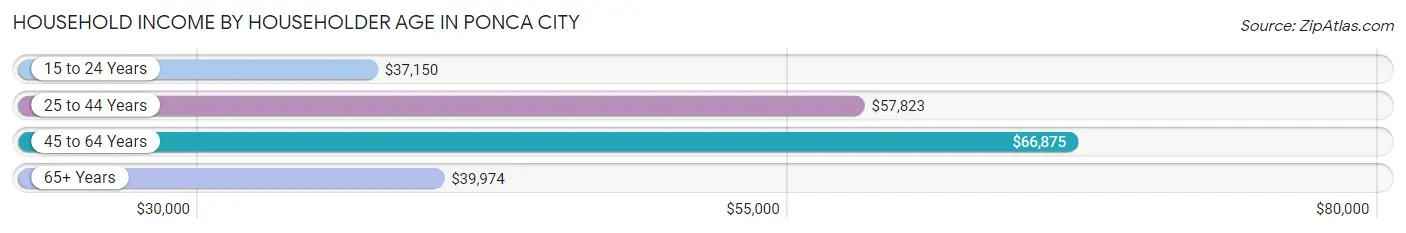
| Income Bracket | # Households | Median Income |
| 15 to 24 Years | 455 (4.9%) | $37,150 |
| 25 to 44 Years | 3,245 (34.7%) | $57,823 |
| 45 to 64 Years | 2,943 (31.5%) | $66,875 |
| 65+ Years | 2,700 (28.9%) | $39,974 |
| Total | 9,343 (100.0%) | $51,367 |
Poverty in Ponca City
Income Below Poverty by Sex and Age in Ponca City
With 16.7% poverty level for males and 18.7% for females among the residents of Ponca City, 5 year old males and 12 to 14 year old females are the most vulnerable to poverty, with 62 males (36.7%) and 132 females (33.3%) in their respective age groups living below the poverty level.
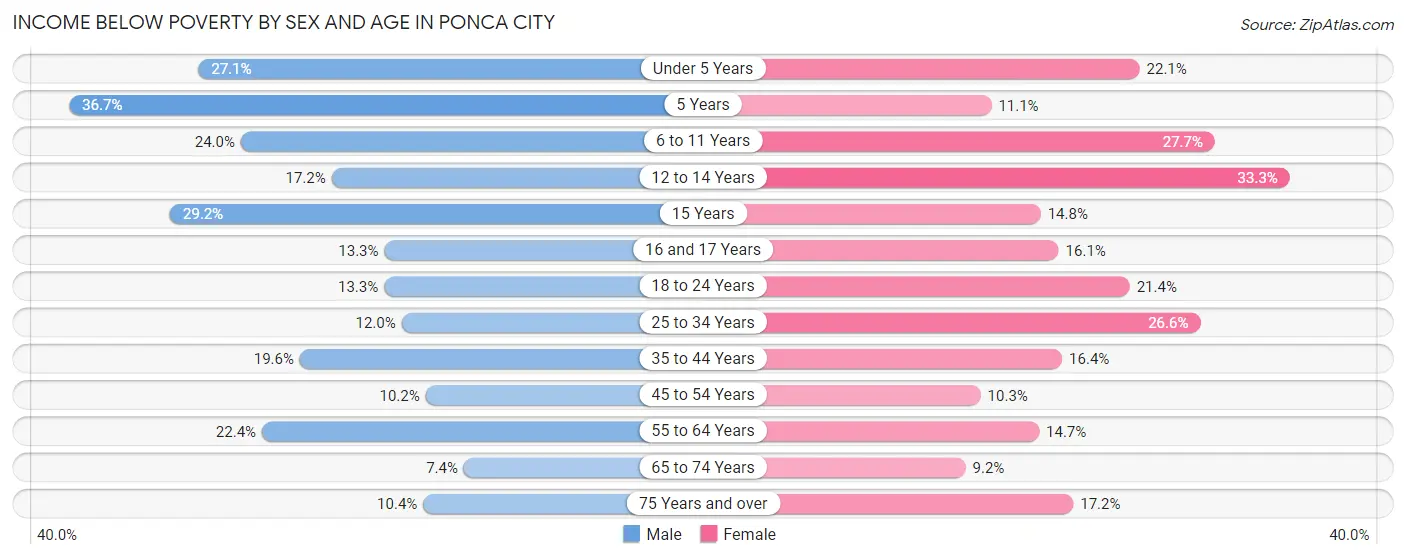
| Age Bracket | Male | Female |
| Under 5 Years | 219 (27.1%) | 189 (22.1%) |
| 5 Years | 62 (36.7%) | 17 (11.1%) |
| 6 to 11 Years | 227 (23.9%) | 329 (27.7%) |
| 12 to 14 Years | 95 (17.2%) | 132 (33.3%) |
| 15 Years | 52 (29.2%) | 22 (14.8%) |
| 16 and 17 Years | 38 (13.3%) | 43 (16.1%) |
| 18 to 24 Years | 135 (13.3%) | 258 (21.4%) |
| 25 to 34 Years | 188 (12.0%) | 441 (26.6%) |
| 35 to 44 Years | 321 (19.6%) | 241 (16.4%) |
| 45 to 54 Years | 131 (10.2%) | 118 (10.3%) |
| 55 to 64 Years | 305 (22.4%) | 211 (14.6%) |
| 65 to 74 Years | 72 (7.4%) | 124 (9.2%) |
| 75 Years and over | 82 (10.4%) | 175 (17.2%) |
| Total | 1,927 (16.7%) | 2,300 (18.7%) |
Income Above Poverty by Sex and Age in Ponca City
According to the poverty statistics in Ponca City, males aged 65 to 74 years and females aged 65 to 74 years are the age groups that are most secure financially, with 92.6% of males and 90.8% of females in these age groups living above the poverty line.
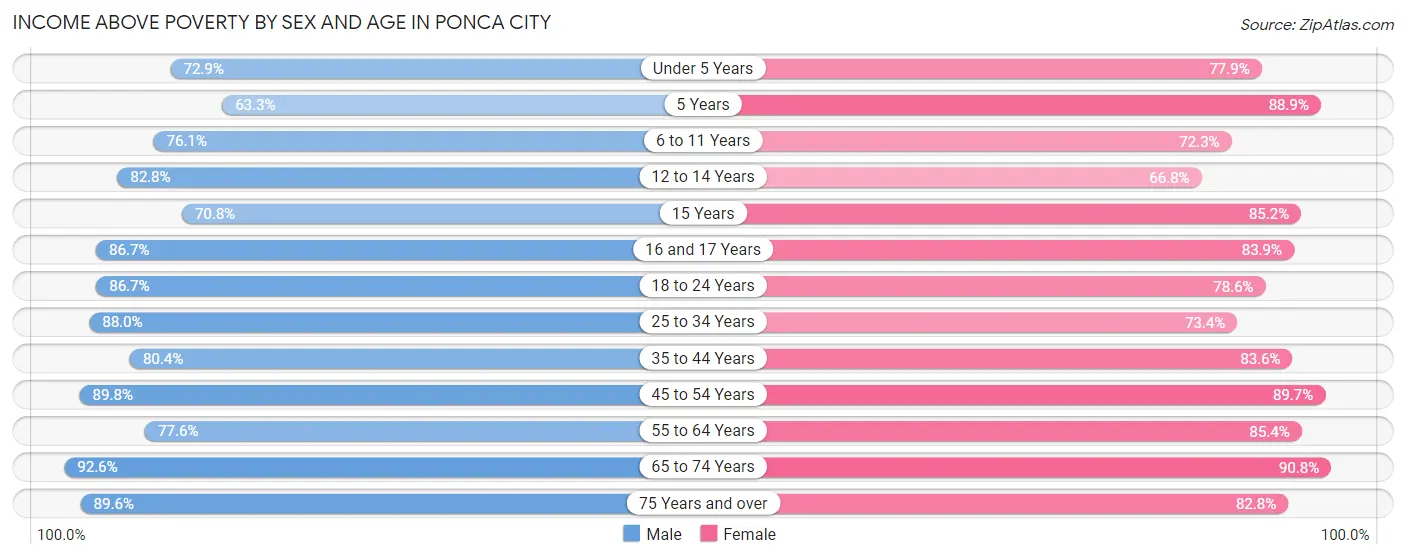
| Age Bracket | Male | Female |
| Under 5 Years | 589 (72.9%) | 666 (77.9%) |
| 5 Years | 107 (63.3%) | 136 (88.9%) |
| 6 to 11 Years | 721 (76.0%) | 859 (72.3%) |
| 12 to 14 Years | 457 (82.8%) | 265 (66.7%) |
| 15 Years | 126 (70.8%) | 127 (85.2%) |
| 16 and 17 Years | 248 (86.7%) | 224 (83.9%) |
| 18 to 24 Years | 879 (86.7%) | 949 (78.6%) |
| 25 to 34 Years | 1,378 (88.0%) | 1,216 (73.4%) |
| 35 to 44 Years | 1,319 (80.4%) | 1,232 (83.6%) |
| 45 to 54 Years | 1,149 (89.8%) | 1,026 (89.7%) |
| 55 to 64 Years | 1,058 (77.6%) | 1,229 (85.4%) |
| 65 to 74 Years | 902 (92.6%) | 1,226 (90.8%) |
| 75 Years and over | 706 (89.6%) | 843 (82.8%) |
| Total | 9,639 (83.3%) | 9,998 (81.3%) |
Income Below Poverty Among Married-Couple Families in Ponca City
The poverty statistics for married-couple families in Ponca City show that 5.9% or 230 of the total 3,888 families live below the poverty line. Families with 3 or 4 children have the highest poverty rate of 14.6%, comprising of 60 families. On the other hand, families with no children have the lowest poverty rate of 4.6%, which includes 104 families.
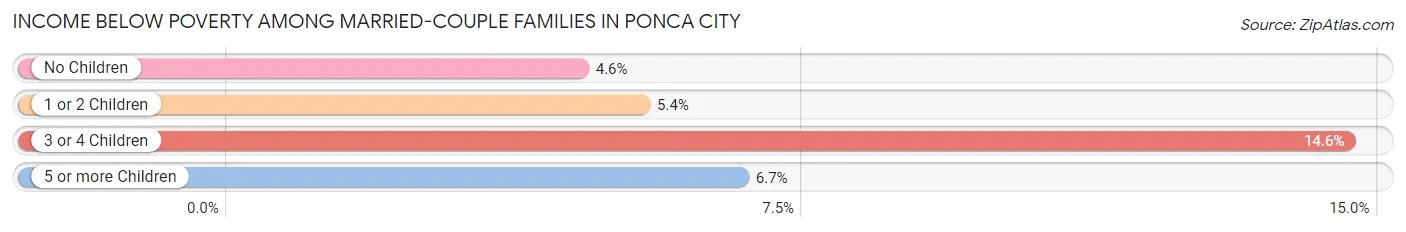
| Children | Above Poverty | Below Poverty |
| No Children | 2,168 (95.4%) | 104 (4.6%) |
| 1 or 2 Children | 1,055 (94.6%) | 60 (5.4%) |
| 3 or 4 Children | 351 (85.4%) | 60 (14.6%) |
| 5 or more Children | 84 (93.3%) | 6 (6.7%) |
| Total | 3,658 (94.1%) | 230 (5.9%) |
Income Below Poverty Among Single-Parent Households in Ponca City
According to the poverty data in Ponca City, 19.5% or 113 single-father households and 36.3% or 461 single-mother households are living below the poverty line. Among single-father households, those with 3 or 4 children have the highest poverty rate, with 20 households (43.5%) experiencing poverty. Likewise, among single-mother households, those with 5 or more children have the highest poverty rate, with 8 households (100.0%) falling below the poverty line.
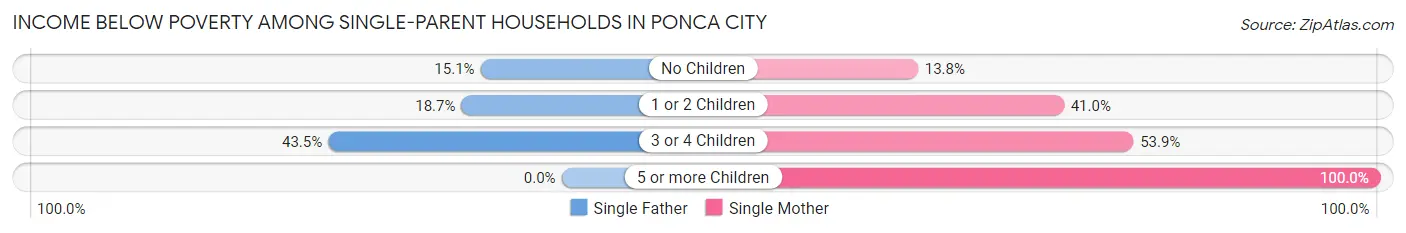
| Children | Single Father | Single Mother |
| No Children | 29 (15.1%) | 45 (13.8%) |
| 1 or 2 Children | 64 (18.7%) | 305 (41.0%) |
| 3 or 4 Children | 20 (43.5%) | 103 (53.9%) |
| 5 or more Children | 0 (0.0%) | 8 (100.0%) |
| Total | 113 (19.5%) | 461 (36.3%) |
Income Below Poverty Among Married-Couple vs Single-Parent Households in Ponca City
The poverty data for Ponca City shows that 230 of the married-couple family households (5.9%) and 574 of the single-parent households (31.0%) are living below the poverty level. Within the married-couple family households, those with 3 or 4 children have the highest poverty rate, with 60 households (14.6%) falling below the poverty line. Among the single-parent households, those with 5 or more children have the highest poverty rate, with 8 household (100.0%) living below poverty.
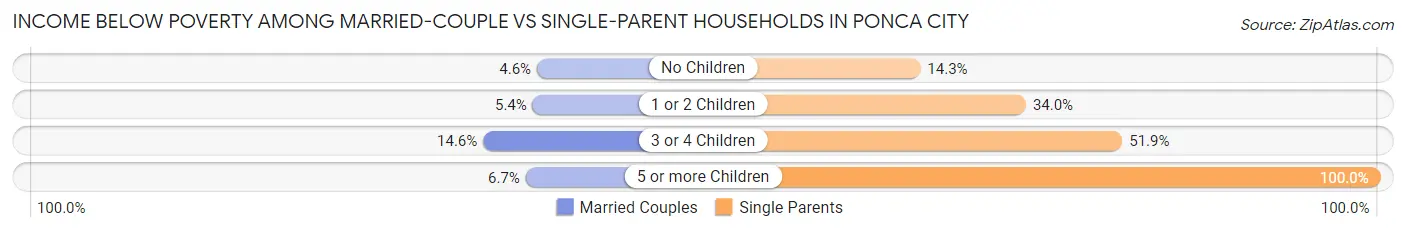
| Children | Married-Couple Families | Single-Parent Households |
| No Children | 104 (4.6%) | 74 (14.3%) |
| 1 or 2 Children | 60 (5.4%) | 369 (34.0%) |
| 3 or 4 Children | 60 (14.6%) | 123 (51.9%) |
| 5 or more Children | 6 (6.7%) | 8 (100.0%) |
| Total | 230 (5.9%) | 574 (31.0%) |
Race in Ponca City
The most populous races in Ponca City are White / Caucasian (17,664 | 72.3%), Two or more Races (2,991 | 12.2%), and Hispanic or Latino (2,279 | 9.3%).
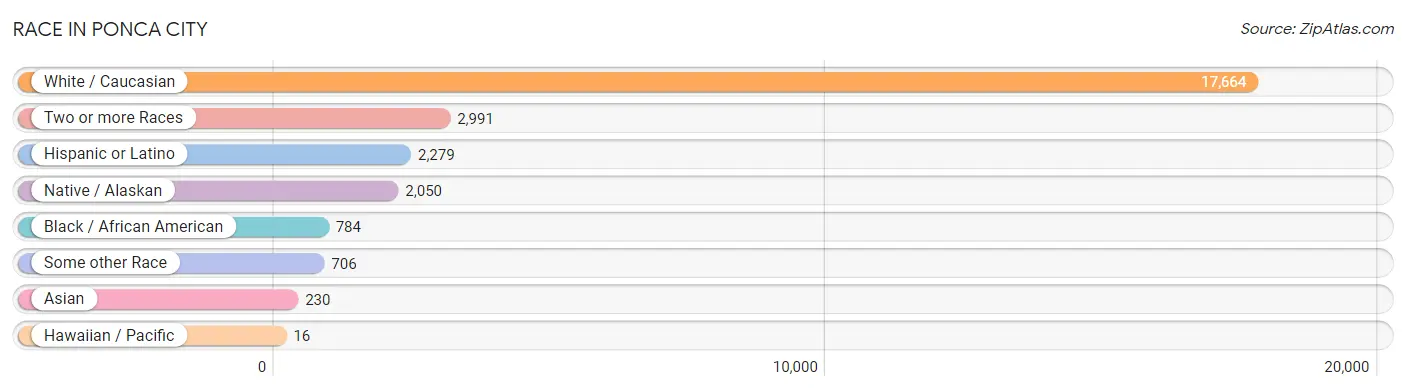
| Race | # Population | % Population |
| Asian | 230 | 0.9% |
| Black / African American | 784 | 3.2% |
| Hawaiian / Pacific | 16 | 0.1% |
| Hispanic or Latino | 2,279 | 9.3% |
| Native / Alaskan | 2,050 | 8.4% |
| White / Caucasian | 17,664 | 72.3% |
| Two or more Races | 2,991 | 12.2% |
| Some other Race | 706 | 2.9% |
| Total | 24,441 | 100.0% |
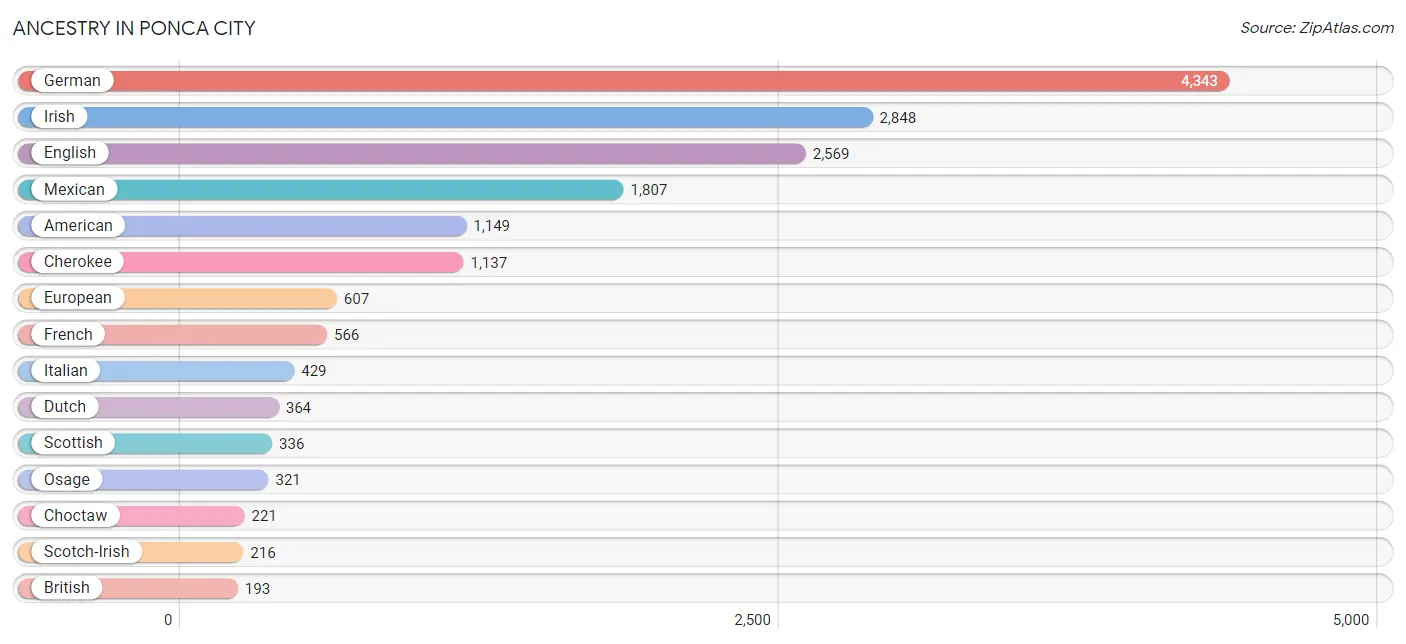
Ancestry in Ponca City
The most populous ancestries reported in Ponca City are German (4,343 | 17.8%), Irish (2,848 | 11.7%), English (2,569 | 10.5%), Mexican (1,807 | 7.4%), and American (1,149 | 4.7%), together accounting for 52.0% of all Ponca City residents.
| Ancestry | # Population | % Population |
| American | 1,149 | 4.7% |
| Apache | 95 | 0.4% |
| Arab | 27 | 0.1% |
| Arapaho | 7 | 0.0% |
| Austrian | 31 | 0.1% |
| Bhutanese | 60 | 0.3% |
| Blackfeet | 3 | 0.0% |
| British | 193 | 0.8% |
| Burmese | 164 | 0.7% |
| Cajun | 8 | 0.0% |
| Central American | 99 | 0.4% |
| Cherokee | 1,137 | 4.6% |
| Cheyenne | 22 | 0.1% |
| Chickasaw | 56 | 0.2% |
| Chippewa | 4 | 0.0% |
| Choctaw | 221 | 0.9% |
| Comanche | 13 | 0.1% |
| Creek | 59 | 0.2% |
| Crow | 25 | 0.1% |
| Cuban | 16 | 0.1% |
| Czech | 34 | 0.1% |
| Czechoslovakian | 5 | 0.0% |
| Danish | 21 | 0.1% |
| Delaware | 10 | 0.0% |
| Dutch | 364 | 1.5% |
| Dutch West Indian | 20 | 0.1% |
| Eastern European | 19 | 0.1% |
| Ecuadorian | 19 | 0.1% |
| Egyptian | 8 | 0.0% |
| English | 2,569 | 10.5% |
| European | 607 | 2.5% |
| French | 566 | 2.3% |
| French Canadian | 51 | 0.2% |
| German | 4,343 | 17.8% |
| Greek | 13 | 0.1% |
| Guatemalan | 12 | 0.1% |
| Hungarian | 25 | 0.1% |
| Indian (Asian) | 36 | 0.2% |
| Irish | 2,848 | 11.7% |
| Iroquois | 59 | 0.2% |
| Italian | 429 | 1.8% |
| Kiowa | 38 | 0.2% |
| Korean | 46 | 0.2% |
| Lebanese | 27 | 0.1% |
| Lithuanian | 12 | 0.1% |
| Malaysian | 1 | 0.0% |
| Mexican | 1,807 | 7.4% |
| Mexican American Indian | 41 | 0.2% |
| Mongolian | 14 | 0.1% |
| Native Hawaiian | 16 | 0.1% |
| Navajo | 98 | 0.4% |
| Nicaraguan | 28 | 0.1% |
| Northern European | 5 | 0.0% |
| Norwegian | 132 | 0.5% |
| Osage | 321 | 1.3% |
| Pennsylvania German | 8 | 0.0% |
| Polish | 186 | 0.8% |
| Portuguese | 53 | 0.2% |
| Potawatomi | 65 | 0.3% |
| Pueblo | 65 | 0.3% |
| Puerto Rican | 148 | 0.6% |
| Russian | 51 | 0.2% |
| Salvadoran | 59 | 0.2% |
| Scandinavian | 120 | 0.5% |
| Scotch-Irish | 216 | 0.9% |
| Scottish | 336 | 1.4% |
| Seminole | 29 | 0.1% |
| Shoshone | 4 | 0.0% |
| Sioux | 32 | 0.1% |
| South American | 19 | 0.1% |
| Spaniard | 28 | 0.1% |
| Spanish | 38 | 0.2% |
| Sri Lankan | 1 | 0.0% |
| Subsaharan African | 7 | 0.0% |
| Swedish | 161 | 0.7% |
| Swiss | 14 | 0.1% |
| Welsh | 111 | 0.4% | View All 77 Rows |
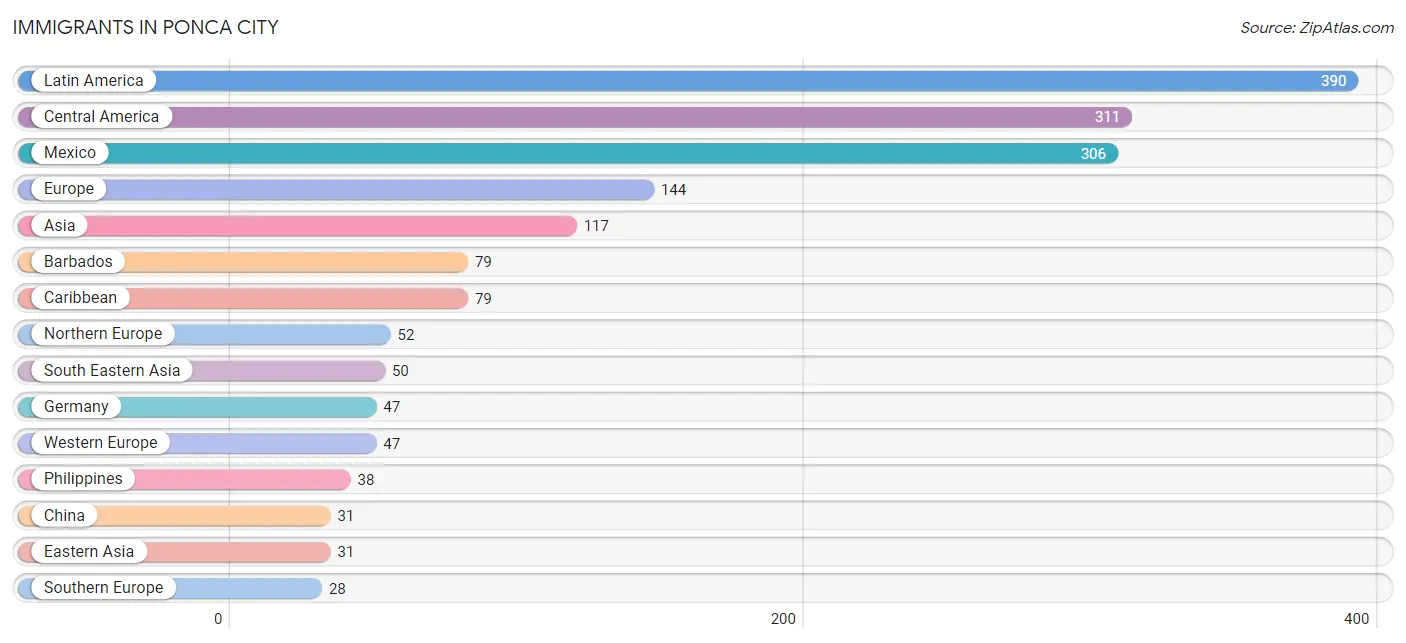
Immigrants in Ponca City
The most numerous immigrant groups reported in Ponca City came from Latin America (390 | 1.6%), Central America (311 | 1.3%), Mexico (306 | 1.3%), Europe (144 | 0.6%), and Asia (117 | 0.5%), together accounting for 5.2% of all Ponca City residents.
| Immigration Origin | # Population | % Population |
| Asia | 117 | 0.5% |
| Barbados | 79 | 0.3% |
| Belarus | 17 | 0.1% |
| Caribbean | 79 | 0.3% |
| Central America | 311 | 1.3% |
| China | 31 | 0.1% |
| Eastern Asia | 31 | 0.1% |
| Eastern Europe | 17 | 0.1% |
| England | 19 | 0.1% |
| Europe | 144 | 0.6% |
| Germany | 47 | 0.2% |
| India | 19 | 0.1% |
| Latin America | 390 | 1.6% |
| Mexico | 306 | 1.3% |
| Nicaragua | 5 | 0.0% |
| Northern Europe | 52 | 0.2% |
| Oceania | 17 | 0.1% |
| Philippines | 38 | 0.2% |
| South Central Asia | 19 | 0.1% |
| South Eastern Asia | 50 | 0.2% |
| Southern Europe | 28 | 0.1% |
| Spain | 28 | 0.1% |
| Sweden | 10 | 0.0% |
| Thailand | 11 | 0.1% |
| Vietnam | 1 | 0.0% |
| Western Europe | 47 | 0.2% | View All 26 Rows |
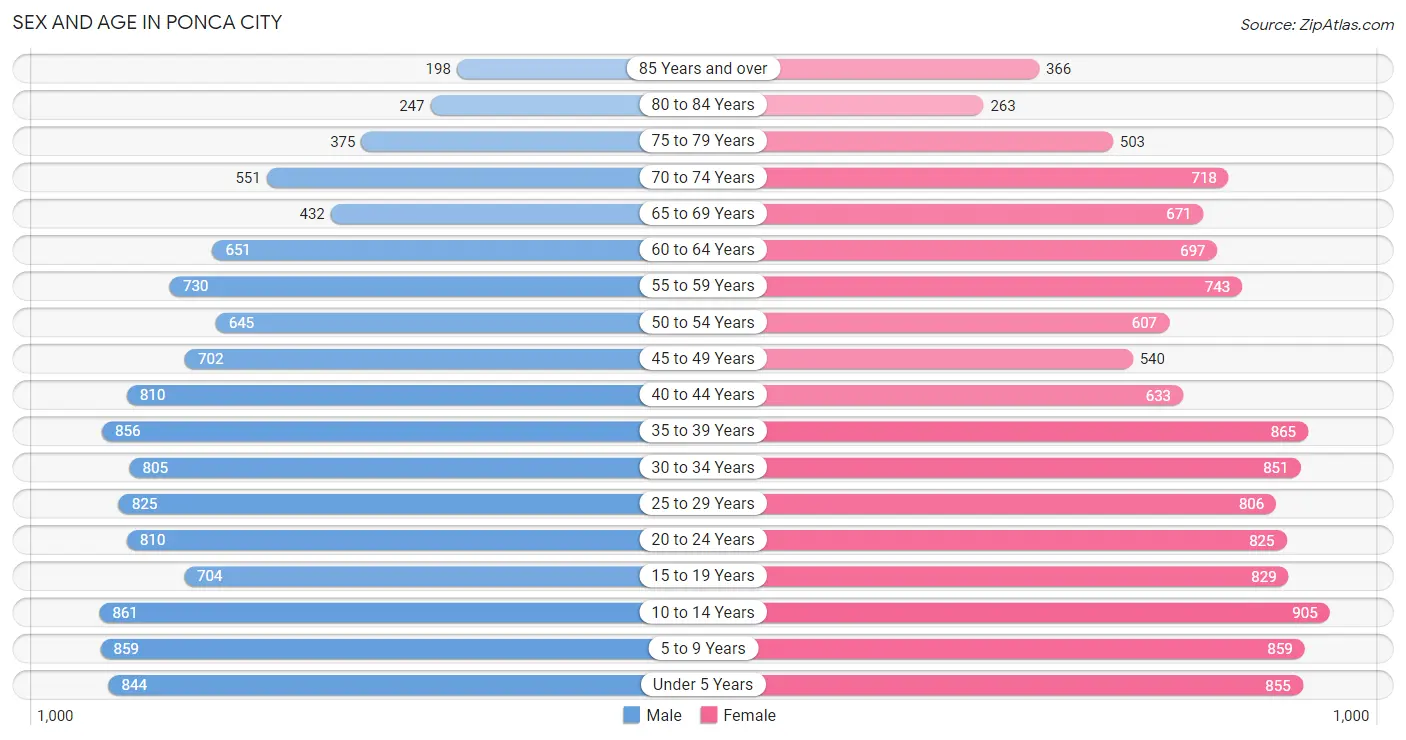
Sex and Age in Ponca City
Sex and Age in Ponca City
The most populous age groups in Ponca City are 10 to 14 Years (861 | 7.2%) for men and 10 to 14 Years (905 | 7.2%) for women.
| Age Bracket | Male | Female |
| Under 5 Years | 844 (7.1%) | 855 (6.8%) |
| 5 to 9 Years | 859 (7.2%) | 859 (6.9%) |
| 10 to 14 Years | 861 (7.2%) | 905 (7.2%) |
| 15 to 19 Years | 704 (5.9%) | 829 (6.6%) |
| 20 to 24 Years | 810 (6.8%) | 825 (6.6%) |
| 25 to 29 Years | 825 (6.9%) | 806 (6.4%) |
| 30 to 34 Years | 805 (6.8%) | 851 (6.8%) |
| 35 to 39 Years | 856 (7.2%) | 865 (6.9%) |
| 40 to 44 Years | 810 (6.8%) | 633 (5.1%) |
| 45 to 49 Years | 702 (5.9%) | 540 (4.3%) |
| 50 to 54 Years | 645 (5.4%) | 607 (4.8%) |
| 55 to 59 Years | 730 (6.1%) | 743 (5.9%) |
| 60 to 64 Years | 651 (5.5%) | 697 (5.6%) |
| 65 to 69 Years | 432 (3.6%) | 671 (5.3%) |
| 70 to 74 Years | 551 (4.6%) | 718 (5.7%) |
| 75 to 79 Years | 375 (3.2%) | 503 (4.0%) |
| 80 to 84 Years | 247 (2.1%) | 263 (2.1%) |
| 85 Years and over | 198 (1.7%) | 366 (2.9%) |
| Total | 11,905 (100.0%) | 12,536 (100.0%) |
Families and Households in Ponca City
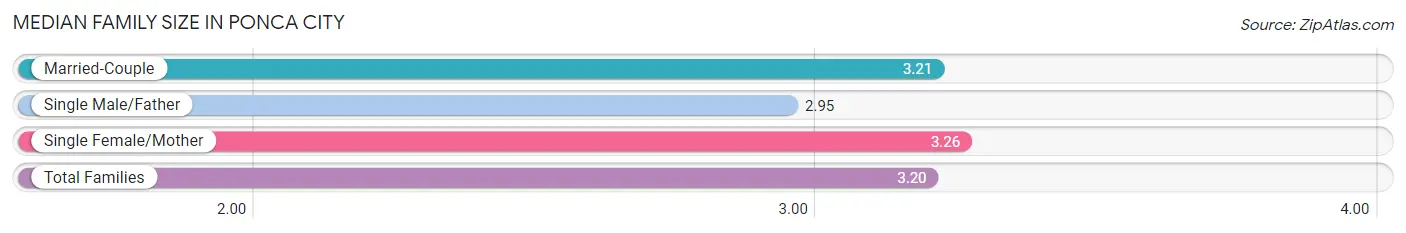
Median Family Size in Ponca City
The median family size in Ponca City is 3.20 persons per family, with single female/mother families (1,269 | 22.1%) accounting for the largest median family size of 3.26 persons per family. On the other hand, single male/father families (581 | 10.1%) represent the smallest median family size with 2.95 persons per family.
| Family Type | # Families | Family Size |
| Married-Couple | 3,888 (67.8%) | 3.21 |
| Single Male/Father | 581 (10.1%) | 2.95 |
| Single Female/Mother | 1,269 (22.1%) | 3.26 |
| Total Families | 5,738 (100.0%) | 3.20 |
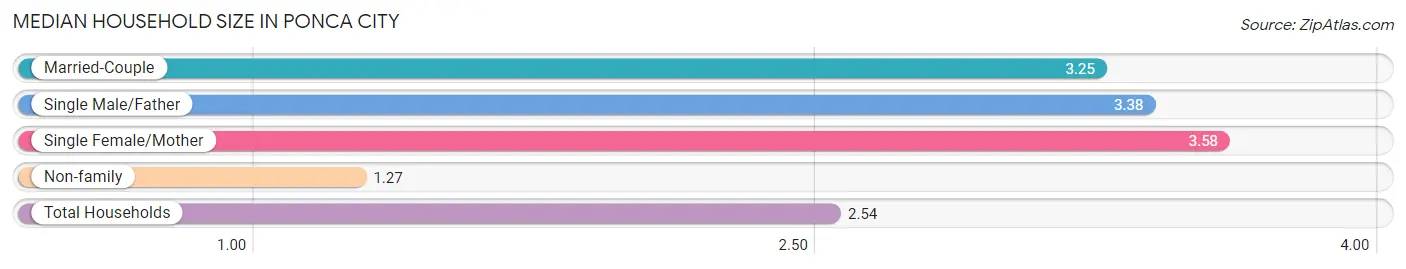
Median Household Size in Ponca City
The median household size in Ponca City is 2.54 persons per household, with single female/mother households (1,269 | 13.6%) accounting for the largest median household size of 3.58 persons per household. non-family households (3,605 | 38.6%) represent the smallest median household size with 1.27 persons per household.
| Household Type | # Households | Household Size |
| Married-Couple | 3,888 (41.6%) | 3.25 |
| Single Male/Father | 581 (6.2%) | 3.38 |
| Single Female/Mother | 1,269 (13.6%) | 3.58 |
| Non-family | 3,605 (38.6%) | 1.27 |
| Total Households | 9,343 (100.0%) | 2.54 |
Household Size by Marriage Status in Ponca City
Out of a total of 9,343 households in Ponca City, 5,738 (61.4%) are family households, while 3,605 (38.6%) are nonfamily households. The most numerous type of family households are 2-person households, comprising 2,720, and the most common type of nonfamily households are 1-person households, comprising 2,887.
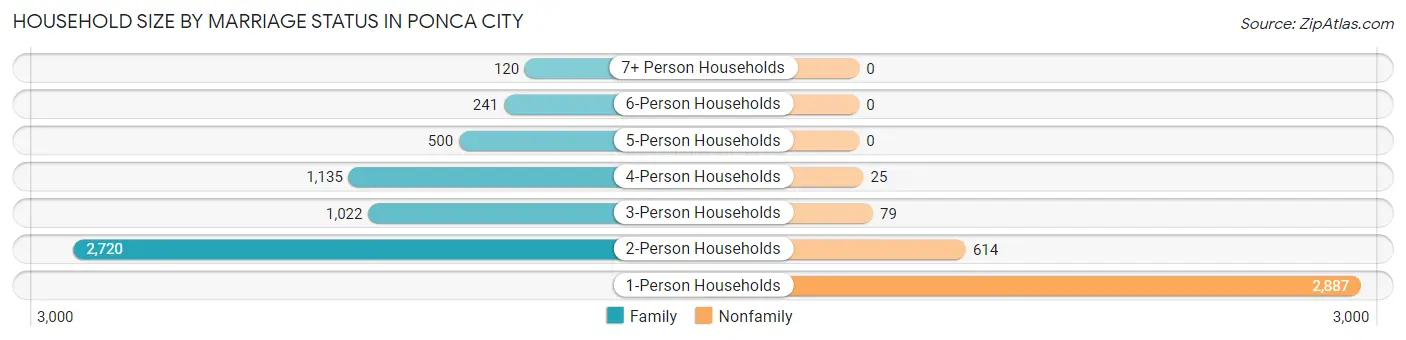
| Household Size | Family Households | Nonfamily Households |
| 1-Person Households | - | 2,887 (30.9%) |
| 2-Person Households | 2,720 (29.1%) | 614 (6.6%) |
| 3-Person Households | 1,022 (10.9%) | 79 (0.9%) |
| 4-Person Households | 1,135 (12.1%) | 25 (0.3%) |
| 5-Person Households | 500 (5.3%) | 0 (0.0%) |
| 6-Person Households | 241 (2.6%) | 0 (0.0%) |
| 7+ Person Households | 120 (1.3%) | 0 (0.0%) |
| Total | 5,738 (61.4%) | 3,605 (38.6%) |
Female Fertility in Ponca City
Fertility by Age in Ponca City
Average fertility rate in Ponca City is 56.0 births per 1,000 women. Women in the age bracket of 20 to 34 years have the highest fertility rate with 89.0 births per 1,000 women. Women in the age bracket of 20 to 34 years acount for 71.3% of all women with births.
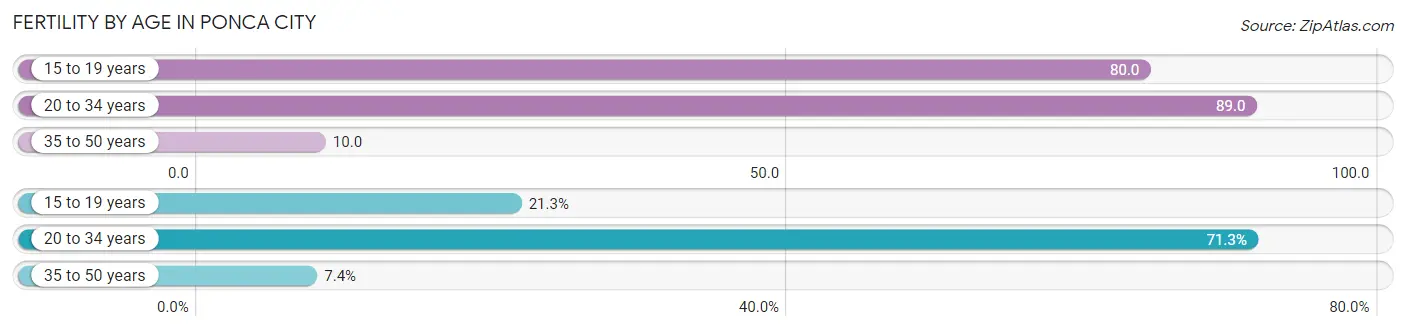
| Age Bracket | Women with Births | Births / 1,000 Women |
| 15 to 19 years | 66 (21.3%) | 80.0 |
| 20 to 34 years | 221 (71.3%) | 89.0 |
| 35 to 50 years | 23 (7.4%) | 10.0 |
| Total | 310 (100.0%) | 56.0 |
Fertility by Age by Marriage Status in Ponca City
65.5% of women with births (310) in Ponca City are married. The highest percentage of unmarried women with births falls into 15 to 19 years age bracket with 100.0% of them unmarried at the time of birth, while the lowest percentage of unmarried women with births belong to 35 to 50 years age bracket with 0.0% of them unmarried.
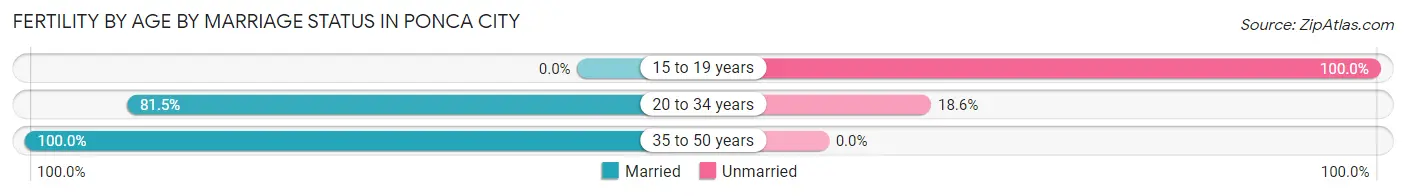
| Age Bracket | Married | Unmarried |
| 15 to 19 years | 0 (0.0%) | 66 (100.0%) |
| 20 to 34 years | 180 (81.5%) | 41 (18.5%) |
| 35 to 50 years | 23 (100.0%) | 0 (0.0%) |
| Total | 203 (65.5%) | 107 (34.5%) |
Fertility by Education in Ponca City
Average fertility rate in Ponca City is 56.0 births per 1,000 women. Women with the education attainment of bachelor's degree have the highest fertility rate of 77.0 births per 1,000 women, while women with the education attainment of less than high school have the lowest fertility at 23.0 births per 1,000 women. Women with the education attainment of college or associate's degree represent 42.6% of all women with births.
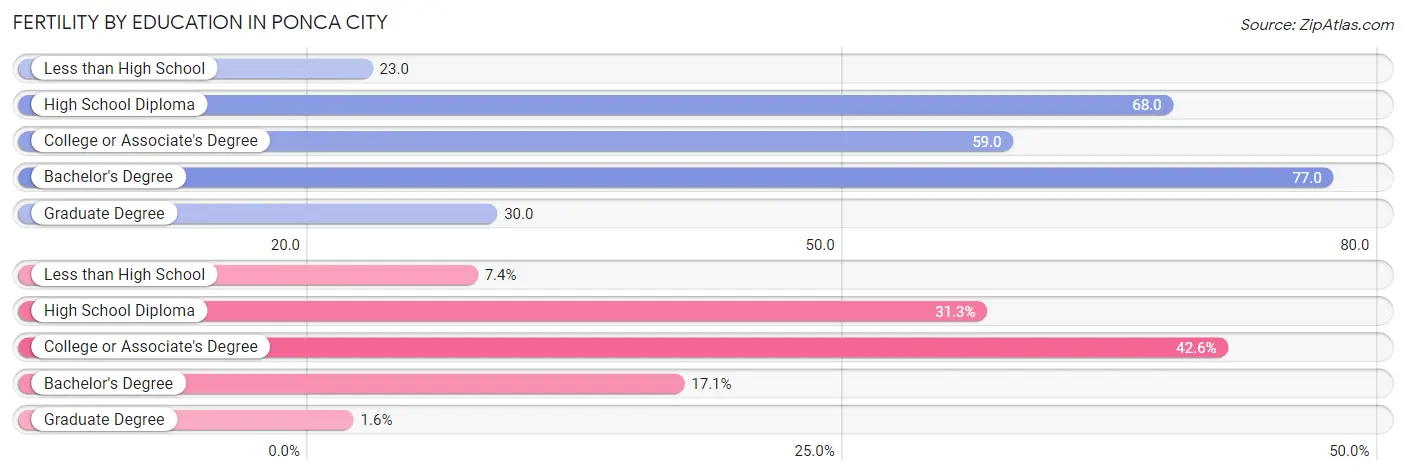
| Educational Attainment | Women with Births | Births / 1,000 Women |
| Less than High School | 23 (7.4%) | 23.0 |
| High School Diploma | 97 (31.3%) | 68.0 |
| College or Associate's Degree | 132 (42.6%) | 59.0 |
| Bachelor's Degree | 53 (17.1%) | 77.0 |
| Graduate Degree | 5 (1.6%) | 30.0 |
| Total | 310 (100.0%) | 56.0 |
Fertility by Education by Marriage Status in Ponca City
34.5% of women with births in Ponca City are unmarried. Women with the educational attainment of less than high school are most likely to be married with 100.0% of them married at childbirth, while women with the educational attainment of high school diploma are least likely to be married with 91.7% of them unmarried at childbirth.
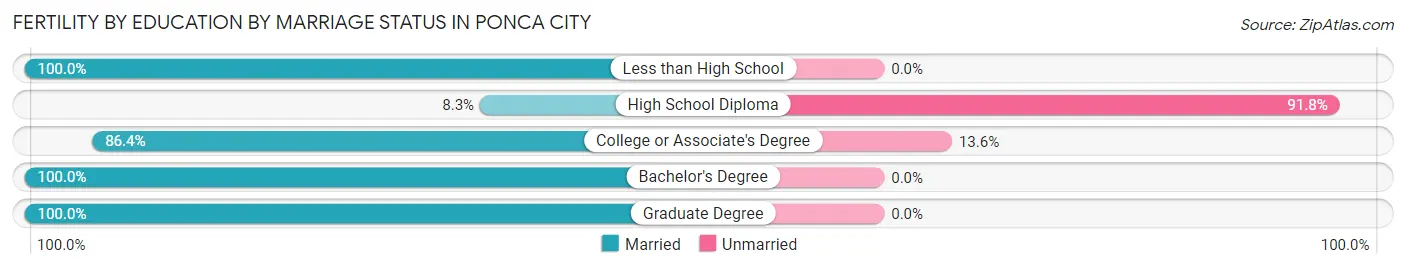
| Educational Attainment | Married | Unmarried |
| Less than High School | 23 (100.0%) | 0 (0.0%) |
| High School Diploma | 8 (8.3%) | 89 (91.7%) |
| College or Associate's Degree | 114 (86.4%) | 18 (13.6%) |
| Bachelor's Degree | 53 (100.0%) | 0 (0.0%) |
| Graduate Degree | 5 (100.0%) | 0 (0.0%) |
| Total | 203 (65.5%) | 107 (34.5%) |
Employment Characteristics in Ponca City
Employment by Class of Employer in Ponca City
Among the 10,505 employed individuals in Ponca City, private company employees (7,280 | 69.3%), local government employees (779 | 7.4%), and state government employees (655 | 6.2%) make up the most common classes of employment.
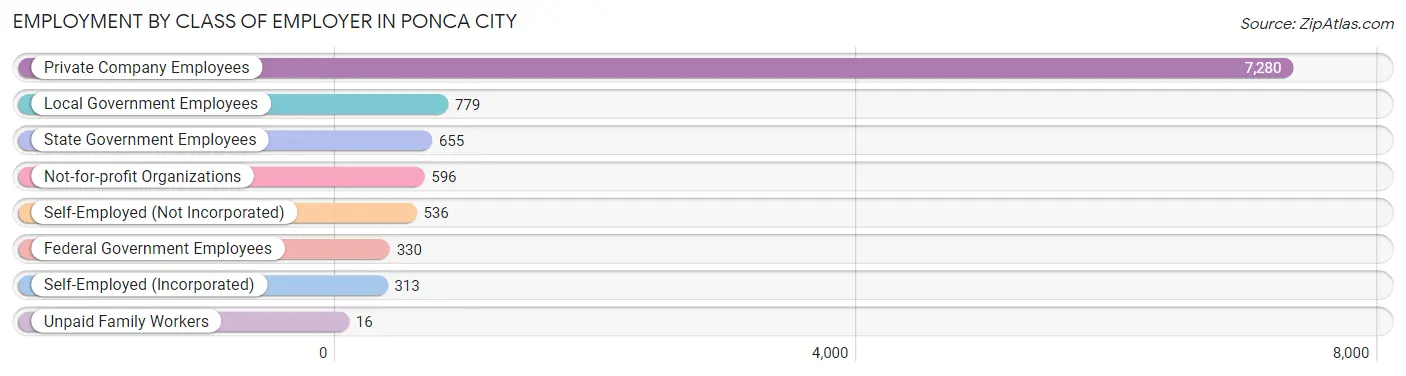
| Employer Class | # Employees | % Employees |
| Private Company Employees | 7,280 | 69.3% |
| Self-Employed (Incorporated) | 313 | 3.0% |
| Self-Employed (Not Incorporated) | 536 | 5.1% |
| Not-for-profit Organizations | 596 | 5.7% |
| Local Government Employees | 779 | 7.4% |
| State Government Employees | 655 | 6.2% |
| Federal Government Employees | 330 | 3.1% |
| Unpaid Family Workers | 16 | 0.2% |
| Total | 10,505 | 100.0% |
Employment Status by Age in Ponca City
According to the labor force statistics for Ponca City, out of the total population over 16 years of age (18,911), 60.2% or 11,384 individuals are in the labor force, with 6.7% or 763 of them unemployed. The age group with the highest labor force participation rate is 25 to 29 years, with 82.3% or 1,342 individuals in the labor force. Within the labor force, the 16 to 19 years age range has the highest percentage of unemployed individuals, with 15.3% or 98 of them being unemployed.
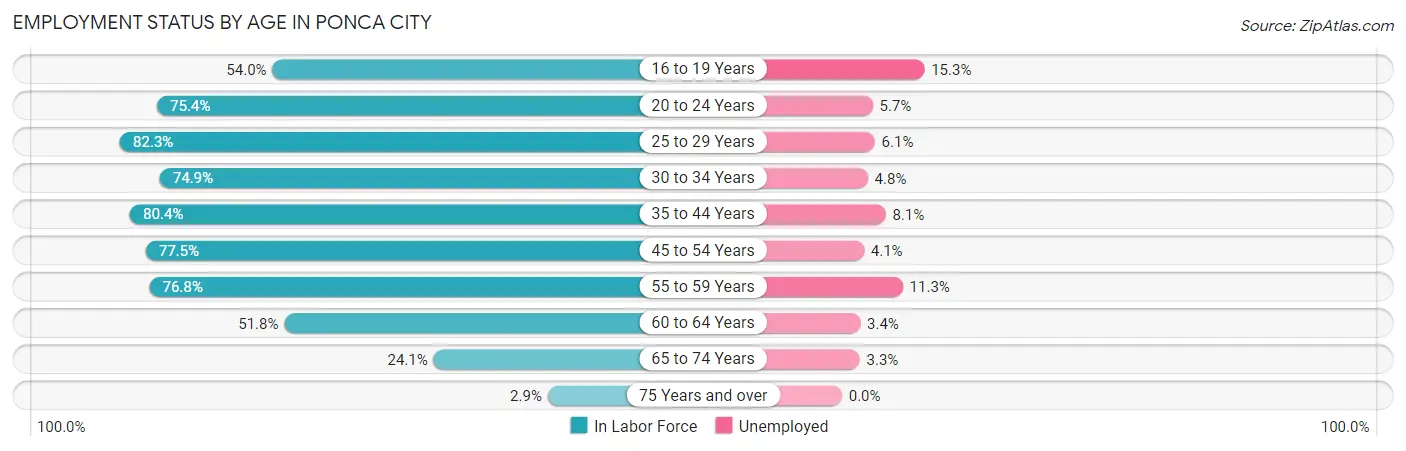
| Age Bracket | In Labor Force | Unemployed |
| 16 to 19 Years | 640 (54.0%) | 98 (15.3%) |
| 20 to 24 Years | 1,233 (75.4%) | 70 (5.7%) |
| 25 to 29 Years | 1,342 (82.3%) | 82 (6.1%) |
| 30 to 34 Years | 1,240 (74.9%) | 60 (4.8%) |
| 35 to 44 Years | 2,544 (80.4%) | 206 (8.1%) |
| 45 to 54 Years | 1,933 (77.5%) | 79 (4.1%) |
| 55 to 59 Years | 1,131 (76.8%) | 128 (11.3%) |
| 60 to 64 Years | 698 (51.8%) | 24 (3.4%) |
| 65 to 74 Years | 572 (24.1%) | 19 (3.3%) |
| 75 Years and over | 57 (2.9%) | 0 (0.0%) |
| Total | 11,384 (60.2%) | 763 (6.7%) |
Employment Status by Educational Attainment in Ponca City
According to labor force statistics for Ponca City, 75.6% of individuals (8,895) out of the total population between 25 and 64 years of age (11,766) are in the labor force, with 6.5% or 578 of them being unemployed. The group with the highest labor force participation rate are those with the educational attainment of bachelor's degree or higher, with 84.1% or 1,732 individuals in the labor force. Within the labor force, individuals with less than high school education have the highest percentage of unemployment, with 17.8% or 142 of them being unemployed.
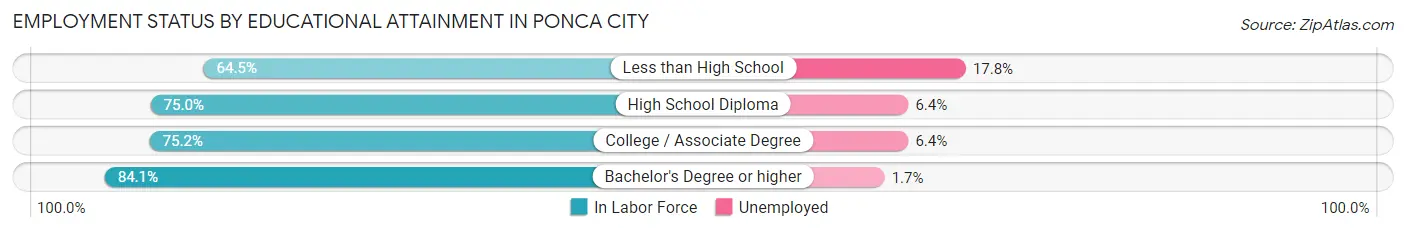
| Educational Attainment | In Labor Force | Unemployed |
| Less than High School | 797 (64.5%) | 220 (17.8%) |
| High School Diploma | 3,076 (75.0%) | 262 (6.4%) |
| College / Associate Degree | 3,287 (75.2%) | 280 (6.4%) |
| Bachelor's Degree or higher | 1,732 (84.1%) | 35 (1.7%) |
| Total | 8,895 (75.6%) | 765 (6.5%) |
Employment Occupations by Sex in Ponca City
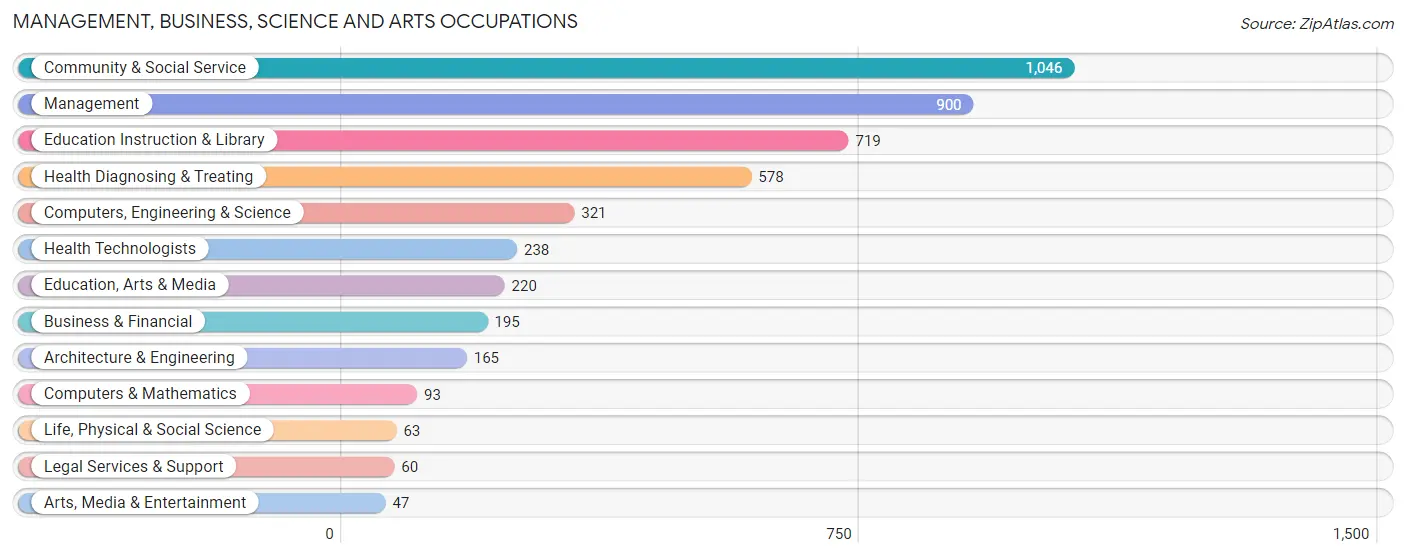
Management, Business, Science and Arts Occupations
The most common Management, Business, Science and Arts occupations in Ponca City are Community & Social Service (1,046 | 9.9%), Management (900 | 8.5%), Education Instruction & Library (719 | 6.8%), Health Diagnosing & Treating (578 | 5.4%), and Computers, Engineering & Science (321 | 3.0%).
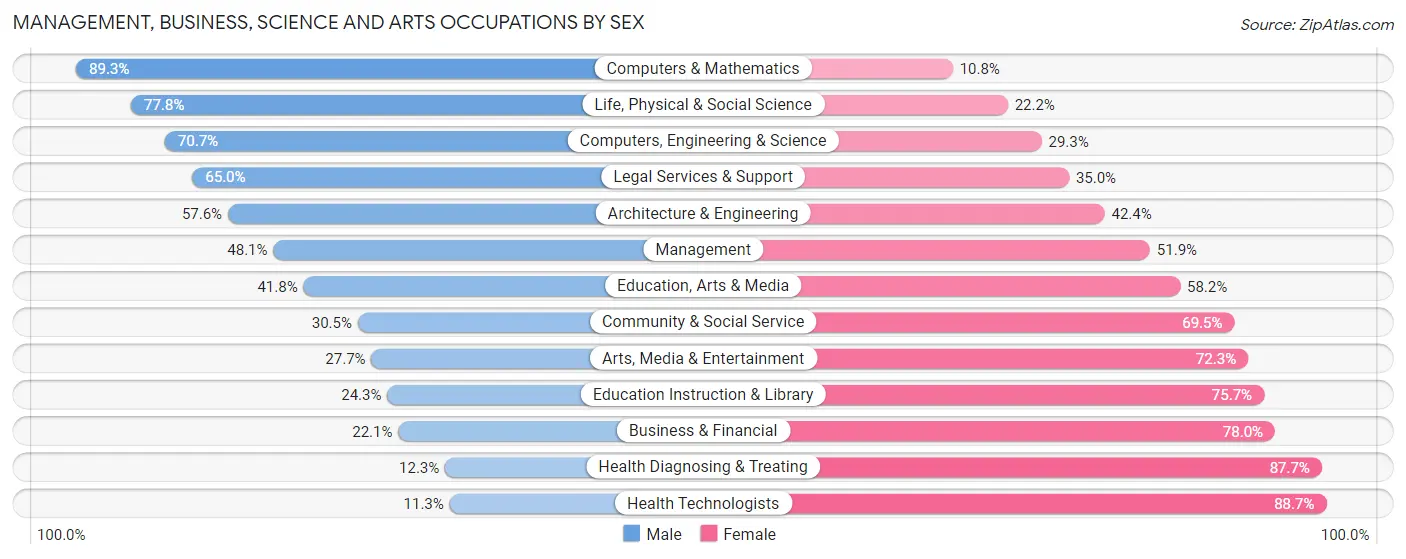
Management, Business, Science and Arts Occupations by Sex
Within the Management, Business, Science and Arts occupations in Ponca City, the most male-oriented occupations are Computers & Mathematics (89.2%), Life, Physical & Social Science (77.8%), and Computers, Engineering & Science (70.7%), while the most female-oriented occupations are Health Technologists (88.7%), Health Diagnosing & Treating (87.7%), and Business & Financial (77.9%).
| Occupation | Male | Female |
| Management | 433 (48.1%) | 467 (51.9%) |
| Business & Financial | 43 (22.1%) | 152 (77.9%) |
| Computers, Engineering & Science | 227 (70.7%) | 94 (29.3%) |
| Computers & Mathematics | 83 (89.2%) | 10 (10.7%) |
| Architecture & Engineering | 95 (57.6%) | 70 (42.4%) |
| Life, Physical & Social Science | 49 (77.8%) | 14 (22.2%) |
| Community & Social Service | 319 (30.5%) | 727 (69.5%) |
| Education, Arts & Media | 92 (41.8%) | 128 (58.2%) |
| Legal Services & Support | 39 (65.0%) | 21 (35.0%) |
| Education Instruction & Library | 175 (24.3%) | 544 (75.7%) |
| Arts, Media & Entertainment | 13 (27.7%) | 34 (72.3%) |
| Health Diagnosing & Treating | 71 (12.3%) | 507 (87.7%) |
| Health Technologists | 27 (11.3%) | 211 (88.7%) |
| Total (Category) | 1,093 (35.9%) | 1,947 (64.0%) |
| Total (Overall) | 5,631 (53.0%) | 4,987 (47.0%) |
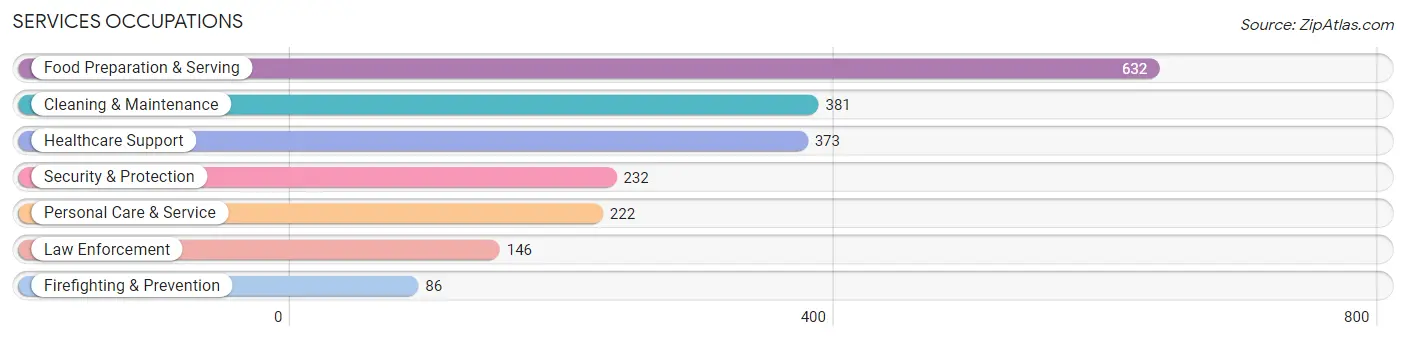
Services Occupations
The most common Services occupations in Ponca City are Food Preparation & Serving (632 | 5.9%), Cleaning & Maintenance (381 | 3.6%), Healthcare Support (373 | 3.5%), Security & Protection (232 | 2.2%), and Personal Care & Service (222 | 2.1%).
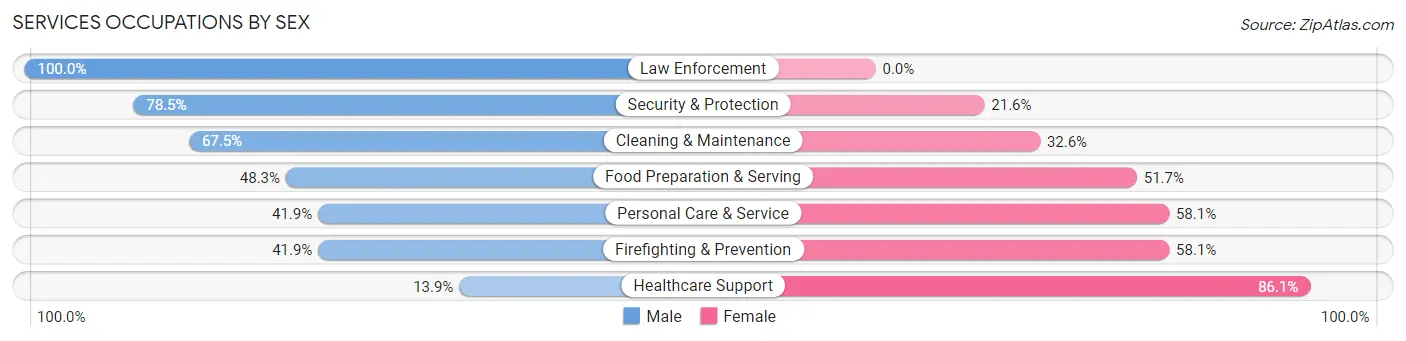
Services Occupations by Sex
Within the Services occupations in Ponca City, the most male-oriented occupations are Law Enforcement (100.0%), Security & Protection (78.4%), and Cleaning & Maintenance (67.4%), while the most female-oriented occupations are Healthcare Support (86.1%), Firefighting & Prevention (58.1%), and Personal Care & Service (58.1%).
| Occupation | Male | Female |
| Healthcare Support | 52 (13.9%) | 321 (86.1%) |
| Security & Protection | 182 (78.4%) | 50 (21.5%) |
| Firefighting & Prevention | 36 (41.9%) | 50 (58.1%) |
| Law Enforcement | 146 (100.0%) | 0 (0.0%) |
| Food Preparation & Serving | 305 (48.3%) | 327 (51.7%) |
| Cleaning & Maintenance | 257 (67.4%) | 124 (32.6%) |
| Personal Care & Service | 93 (41.9%) | 129 (58.1%) |
| Total (Category) | 889 (48.3%) | 951 (51.7%) |
| Total (Overall) | 5,631 (53.0%) | 4,987 (47.0%) |
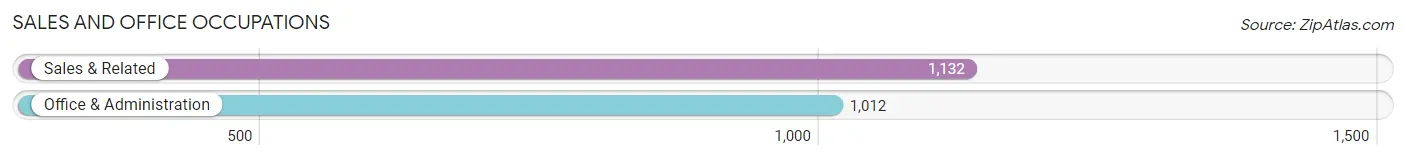
Sales and Office Occupations
The most common Sales and Office occupations in Ponca City are Sales & Related (1,132 | 10.7%), and Office & Administration (1,012 | 9.5%).
Sales and Office Occupations by Sex
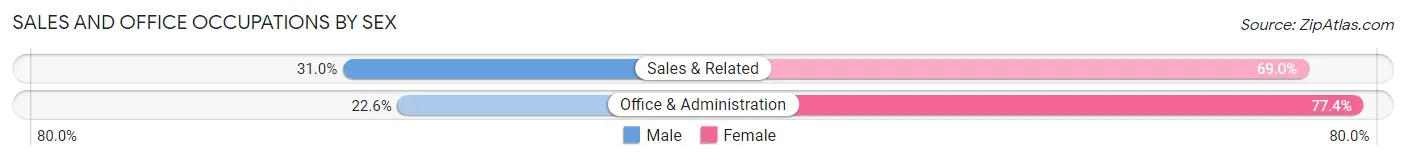
| Occupation | Male | Female |
| Sales & Related | 351 (31.0%) | 781 (69.0%) |
| Office & Administration | 229 (22.6%) | 783 (77.4%) |
| Total (Category) | 580 (27.1%) | 1,564 (73.0%) |
| Total (Overall) | 5,631 (53.0%) | 4,987 (47.0%) |
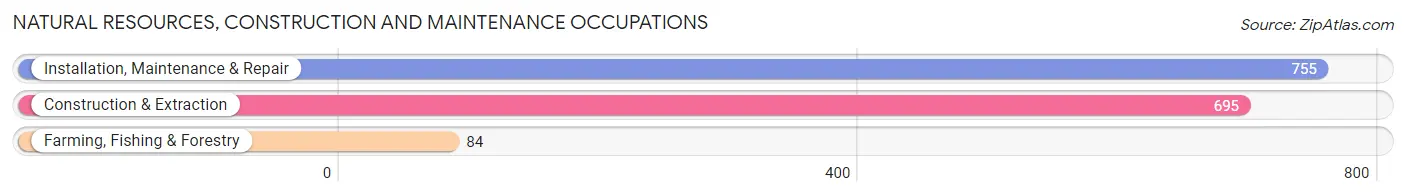
Natural Resources, Construction and Maintenance Occupations
The most common Natural Resources, Construction and Maintenance occupations in Ponca City are Installation, Maintenance & Repair (755 | 7.1%), Construction & Extraction (695 | 6.6%), and Farming, Fishing & Forestry (84 | 0.8%).
Natural Resources, Construction and Maintenance Occupations by Sex
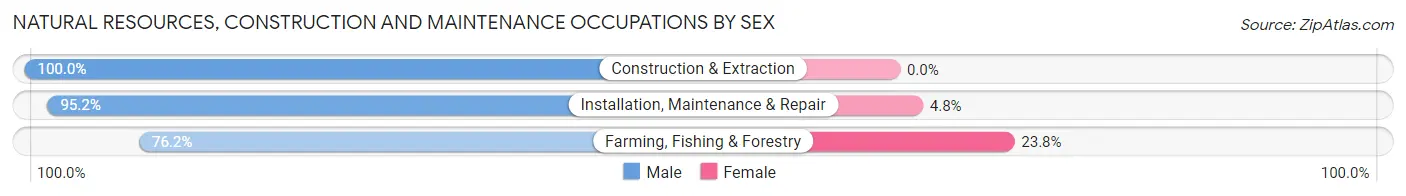
| Occupation | Male | Female |
| Farming, Fishing & Forestry | 64 (76.2%) | 20 (23.8%) |
| Construction & Extraction | 695 (100.0%) | 0 (0.0%) |
| Installation, Maintenance & Repair | 719 (95.2%) | 36 (4.8%) |
| Total (Category) | 1,478 (96.4%) | 56 (3.6%) |
| Total (Overall) | 5,631 (53.0%) | 4,987 (47.0%) |
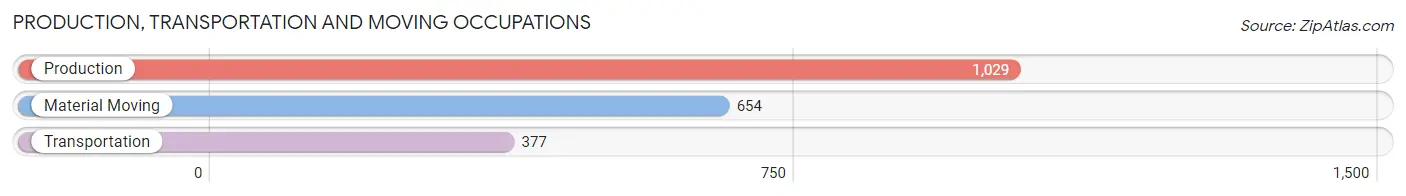
Production, Transportation and Moving Occupations
The most common Production, Transportation and Moving occupations in Ponca City are Production (1,029 | 9.7%), Material Moving (654 | 6.2%), and Transportation (377 | 3.5%).
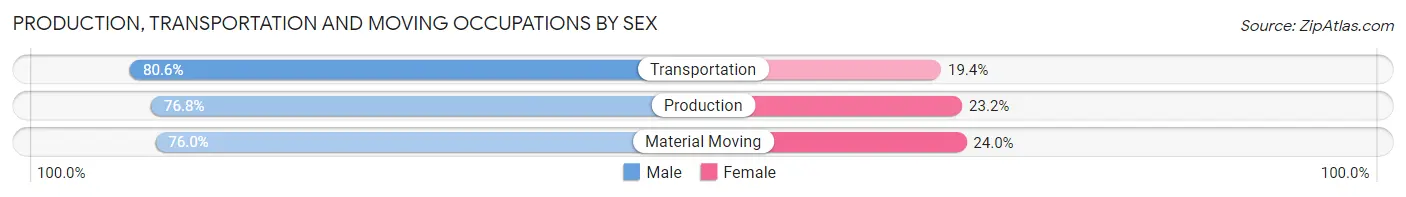
Production, Transportation and Moving Occupations by Sex
| Occupation | Male | Female |
| Production | 790 (76.8%) | 239 (23.2%) |
| Transportation | 304 (80.6%) | 73 (19.4%) |
| Material Moving | 497 (76.0%) | 157 (24.0%) |
| Total (Category) | 1,591 (77.2%) | 469 (22.8%) |
| Total (Overall) | 5,631 (53.0%) | 4,987 (47.0%) |
Employment Industries by Sex in Ponca City
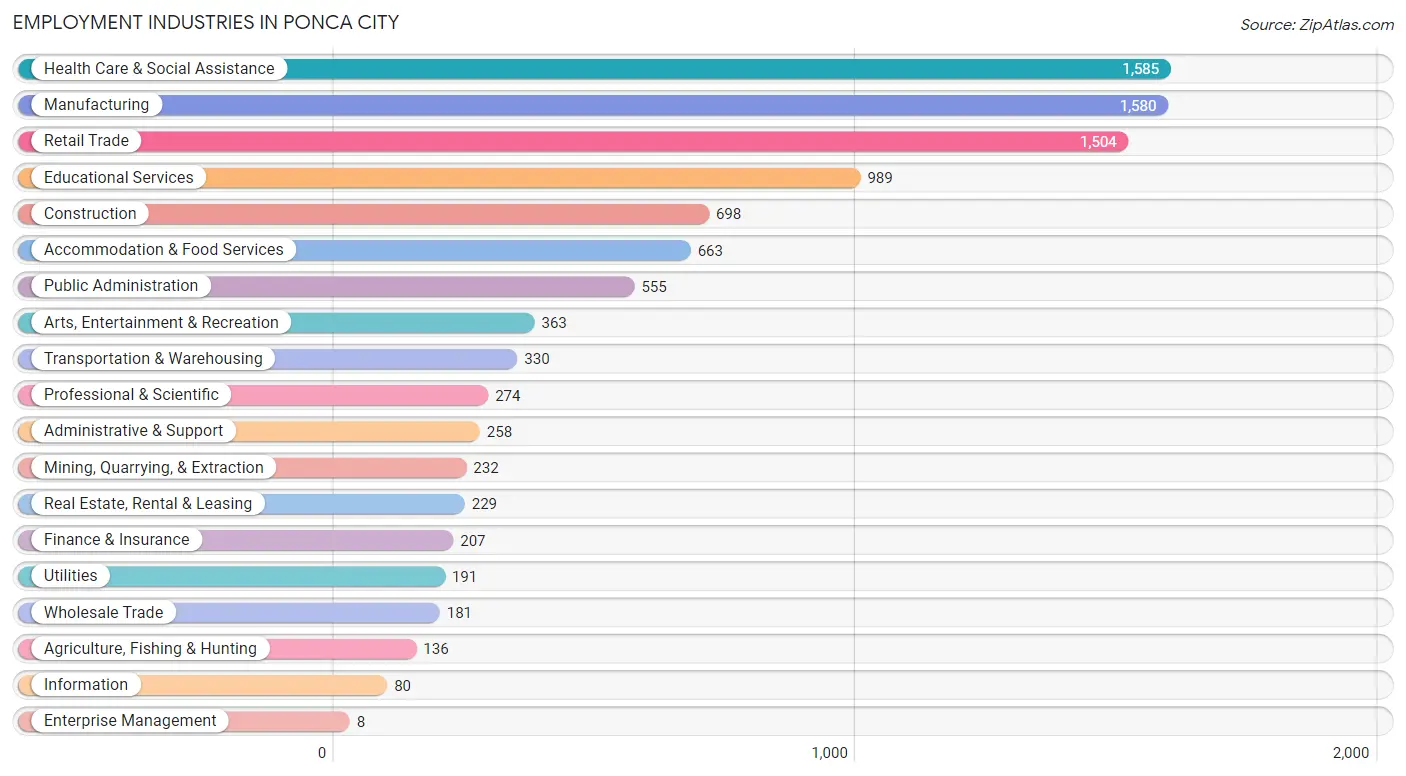
Employment Industries in Ponca City
The major employment industries in Ponca City include Health Care & Social Assistance (1,585 | 14.9%), Manufacturing (1,580 | 14.9%), Retail Trade (1,504 | 14.2%), Educational Services (989 | 9.3%), and Construction (698 | 6.6%).
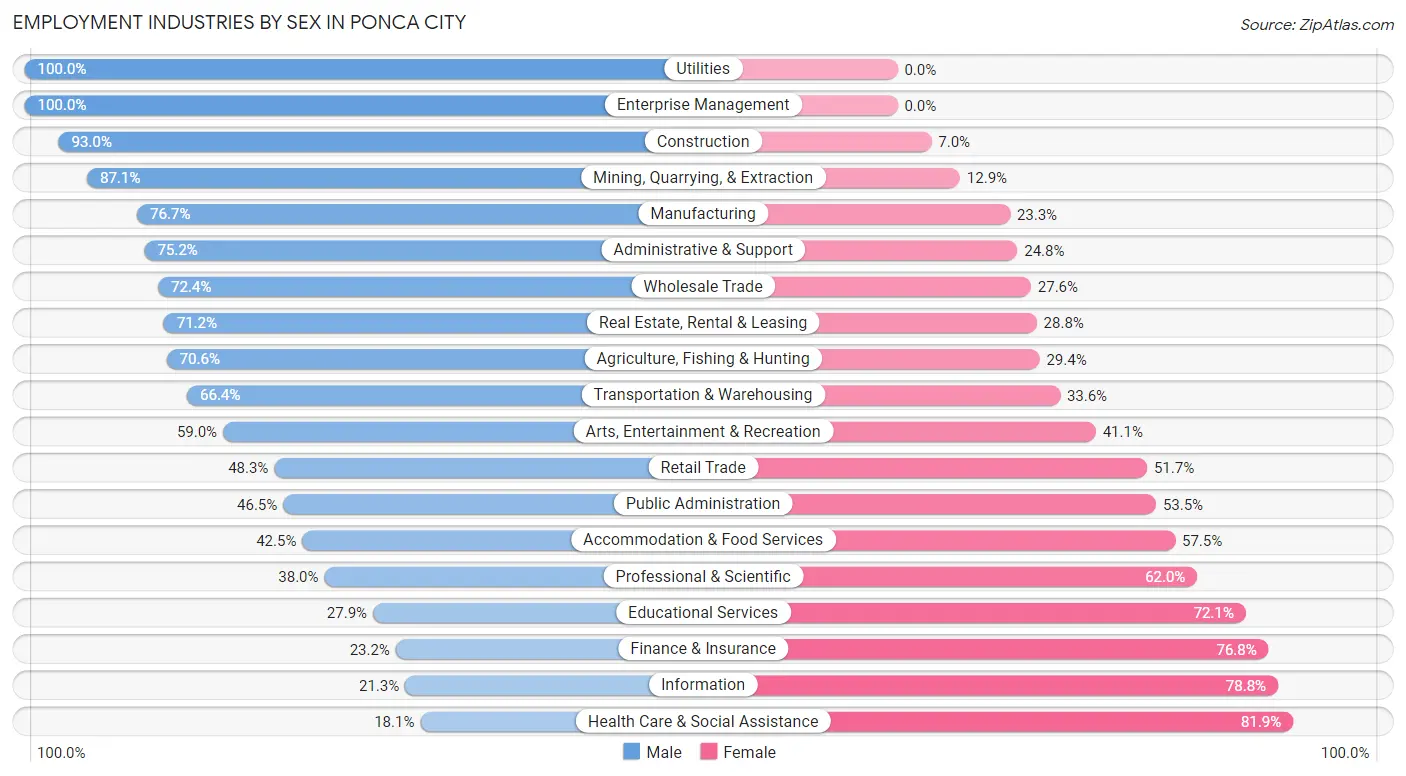
Employment Industries by Sex in Ponca City
The Ponca City industries that see more men than women are Utilities (100.0%), Enterprise Management (100.0%), and Construction (93.0%), whereas the industries that tend to have a higher number of women are Health Care & Social Assistance (81.9%), Information (78.7%), and Finance & Insurance (76.8%).
| Industry | Male | Female |
| Agriculture, Fishing & Hunting | 96 (70.6%) | 40 (29.4%) |
| Mining, Quarrying, & Extraction | 202 (87.1%) | 30 (12.9%) |
| Construction | 649 (93.0%) | 49 (7.0%) |
| Manufacturing | 1,212 (76.7%) | 368 (23.3%) |
| Wholesale Trade | 131 (72.4%) | 50 (27.6%) |
| Retail Trade | 727 (48.3%) | 777 (51.7%) |
| Transportation & Warehousing | 219 (66.4%) | 111 (33.6%) |
| Utilities | 191 (100.0%) | 0 (0.0%) |
| Information | 17 (21.2%) | 63 (78.7%) |
| Finance & Insurance | 48 (23.2%) | 159 (76.8%) |
| Real Estate, Rental & Leasing | 163 (71.2%) | 66 (28.8%) |
| Professional & Scientific | 104 (38.0%) | 170 (62.0%) |
| Enterprise Management | 8 (100.0%) | 0 (0.0%) |
| Administrative & Support | 194 (75.2%) | 64 (24.8%) |
| Educational Services | 276 (27.9%) | 713 (72.1%) |
| Health Care & Social Assistance | 287 (18.1%) | 1,298 (81.9%) |
| Arts, Entertainment & Recreation | 214 (59.0%) | 149 (41.0%) |
| Accommodation & Food Services | 282 (42.5%) | 381 (57.5%) |
| Public Administration | 258 (46.5%) | 297 (53.5%) |
| Total | 5,631 (53.0%) | 4,987 (47.0%) |
Education in Ponca City
School Enrollment in Ponca City
The most common levels of schooling among the 5,792 students in Ponca City are elementary school (1,489 | 25.7%), middle school (1,335 | 23.1%), and high school (1,174 | 20.3%).
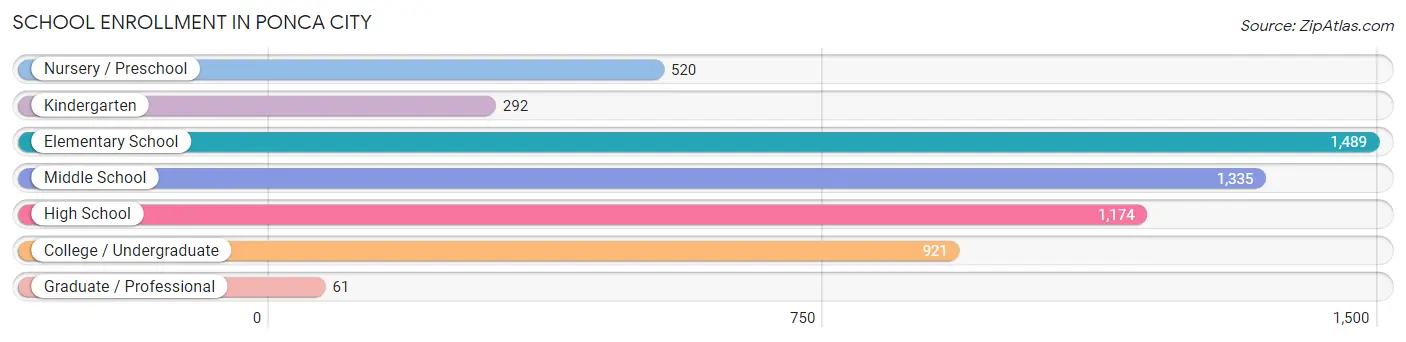
| School Level | # Students | % Students |
| Nursery / Preschool | 520 | 9.0% |
| Kindergarten | 292 | 5.0% |
| Elementary School | 1,489 | 25.7% |
| Middle School | 1,335 | 23.1% |
| High School | 1,174 | 20.3% |
| College / Undergraduate | 921 | 15.9% |
| Graduate / Professional | 61 | 1.1% |
| Total | 5,792 | 100.0% |
School Enrollment by Age by Funding Source in Ponca City
Out of a total of 5,792 students who are enrolled in schools in Ponca City, 915 (15.8%) attend a private institution, while the remaining 4,877 (84.2%) are enrolled in public schools. The age group of 3 to 4 year olds has the highest likelihood of being enrolled in private schools, with 115 (33.3% in the age bracket) enrolled. Conversely, the age group of 18 to 19 year olds has the lowest likelihood of being enrolled in a private school, with 397 (93.9% in the age bracket) attending a public institution.
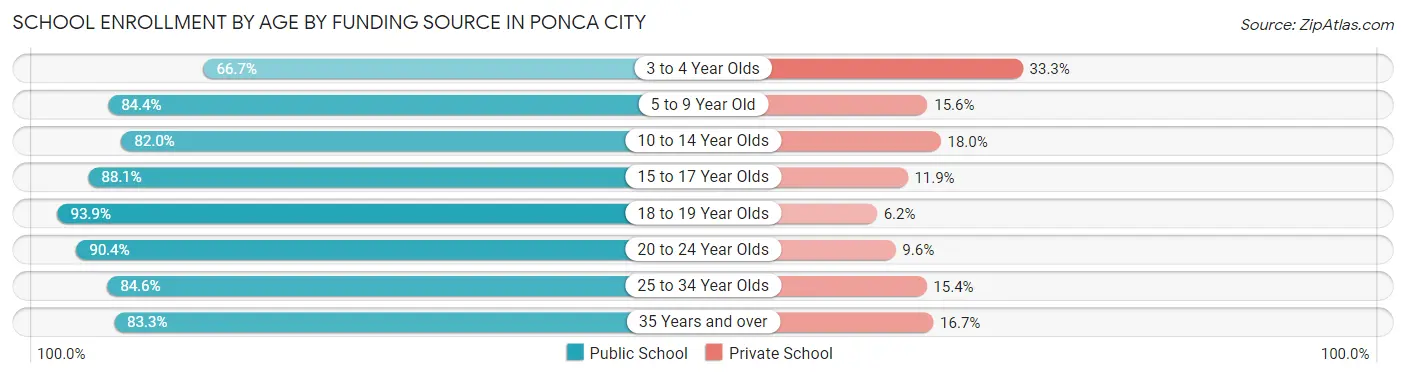
| Age Bracket | Public School | Private School |
| 3 to 4 Year Olds | 230 (66.7%) | 115 (33.3%) |
| 5 to 9 Year Old | 1,387 (84.4%) | 256 (15.6%) |
| 10 to 14 Year Olds | 1,399 (82.0%) | 308 (18.0%) |
| 15 to 17 Year Olds | 786 (88.1%) | 106 (11.9%) |
| 18 to 19 Year Olds | 397 (93.9%) | 26 (6.1%) |
| 20 to 24 Year Olds | 253 (90.4%) | 27 (9.6%) |
| 25 to 34 Year Olds | 247 (84.6%) | 45 (15.4%) |
| 35 Years and over | 175 (83.3%) | 35 (16.7%) |
| Total | 4,877 (84.2%) | 915 (15.8%) |
Educational Attainment by Field of Study in Ponca City
Education (855 | 26.8%), business (720 | 22.6%), arts & humanities (222 | 7.0%), science & technology (208 | 6.5%), and bio, nature & agricultural (196 | 6.1%) are the most common fields of study among 3,193 individuals in Ponca City who have obtained a bachelor's degree or higher.
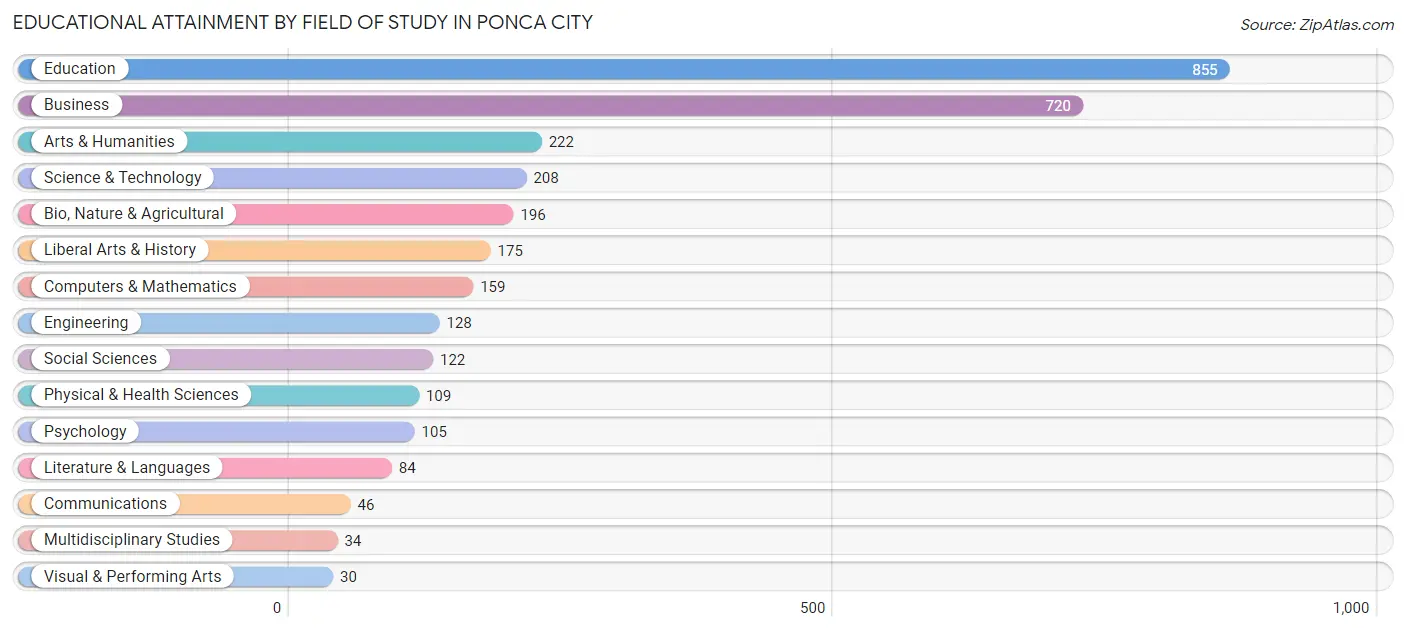
| Field of Study | # Graduates | % Graduates |
| Computers & Mathematics | 159 | 5.0% |
| Bio, Nature & Agricultural | 196 | 6.1% |
| Physical & Health Sciences | 109 | 3.4% |
| Psychology | 105 | 3.3% |
| Social Sciences | 122 | 3.8% |
| Engineering | 128 | 4.0% |
| Multidisciplinary Studies | 34 | 1.1% |
| Science & Technology | 208 | 6.5% |
| Business | 720 | 22.6% |
| Education | 855 | 26.8% |
| Literature & Languages | 84 | 2.6% |
| Liberal Arts & History | 175 | 5.5% |
| Visual & Performing Arts | 30 | 0.9% |
| Communications | 46 | 1.4% |
| Arts & Humanities | 222 | 7.0% |
| Total | 3,193 | 100.0% |
Transportation & Commute in Ponca City
Vehicle Availability by Sex in Ponca City
The most prevalent vehicle ownership categories in Ponca City are males with 2 vehicles (2,363, accounting for 42.6%) and females with 2 vehicles (2,112, making up 48.5%).
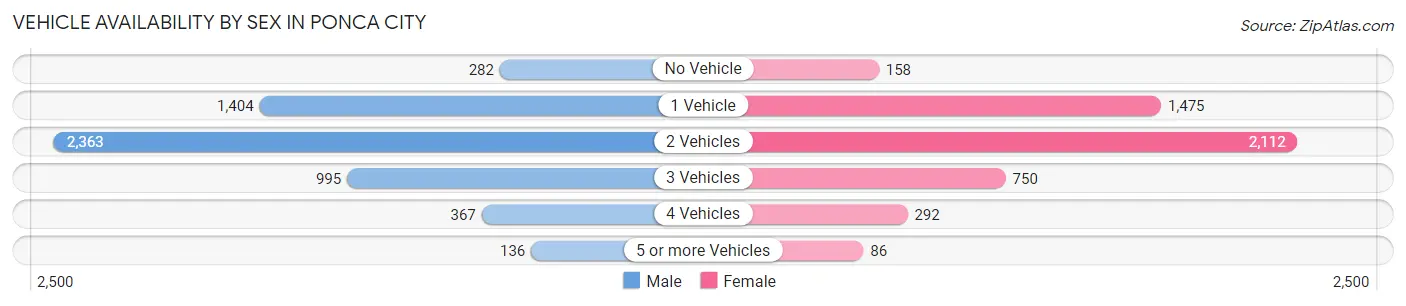
| Vehicles Available | Male | Female |
| No Vehicle | 282 (5.1%) | 158 (3.2%) |
| 1 Vehicle | 1,404 (25.3%) | 1,475 (30.3%) |
| 2 Vehicles | 2,363 (42.6%) | 2,112 (43.3%) |
| 3 Vehicles | 995 (17.9%) | 750 (15.4%) |
| 4 Vehicles | 367 (6.6%) | 292 (6.0%) |
| 5 or more Vehicles | 136 (2.5%) | 86 (1.8%) |
| Total | 5,547 (100.0%) | 4,873 (100.0%) |
Commute Time in Ponca City
The most frequently occuring commute durations in Ponca City are 5 to 9 minutes (3,294 commuters, 32.7%), 10 to 14 minutes (2,645 commuters, 26.2%), and 15 to 19 minutes (1,272 commuters, 12.6%).
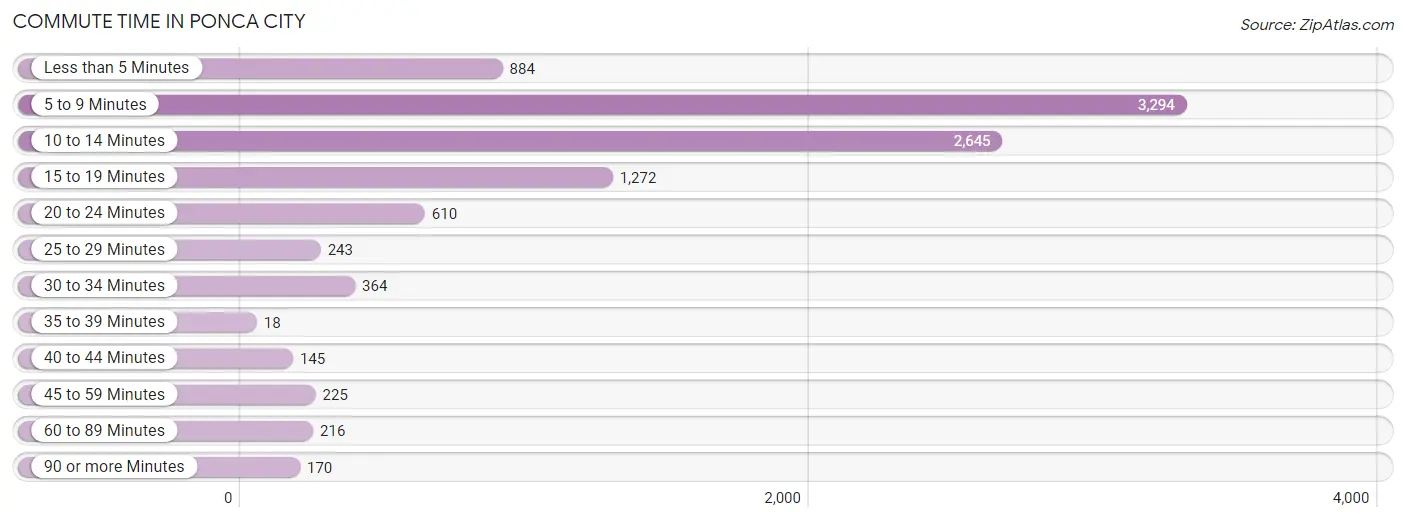
| Commute Time | # Commuters | % Commuters |
| Less than 5 Minutes | 884 | 8.8% |
| 5 to 9 Minutes | 3,294 | 32.7% |
| 10 to 14 Minutes | 2,645 | 26.2% |
| 15 to 19 Minutes | 1,272 | 12.6% |
| 20 to 24 Minutes | 610 | 6.0% |
| 25 to 29 Minutes | 243 | 2.4% |
| 30 to 34 Minutes | 364 | 3.6% |
| 35 to 39 Minutes | 18 | 0.2% |
| 40 to 44 Minutes | 145 | 1.4% |
| 45 to 59 Minutes | 225 | 2.2% |
| 60 to 89 Minutes | 216 | 2.1% |
| 90 or more Minutes | 170 | 1.7% |
Commute Time by Sex in Ponca City
The most common commute times in Ponca City are 5 to 9 minutes (1,664 commuters, 30.9%) for males and 5 to 9 minutes (1,630 commuters, 34.7%) for females.
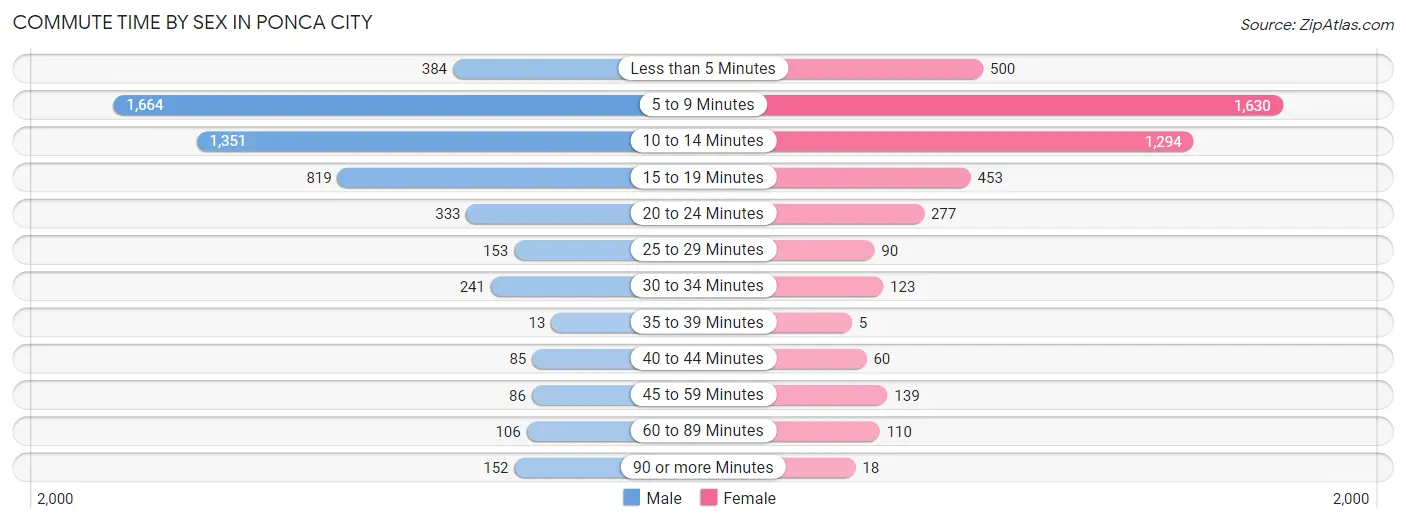
| Commute Time | Male | Female |
| Less than 5 Minutes | 384 (7.1%) | 500 (10.6%) |
| 5 to 9 Minutes | 1,664 (30.9%) | 1,630 (34.7%) |
| 10 to 14 Minutes | 1,351 (25.1%) | 1,294 (27.5%) |
| 15 to 19 Minutes | 819 (15.2%) | 453 (9.6%) |
| 20 to 24 Minutes | 333 (6.2%) | 277 (5.9%) |
| 25 to 29 Minutes | 153 (2.8%) | 90 (1.9%) |
| 30 to 34 Minutes | 241 (4.5%) | 123 (2.6%) |
| 35 to 39 Minutes | 13 (0.2%) | 5 (0.1%) |
| 40 to 44 Minutes | 85 (1.6%) | 60 (1.3%) |
| 45 to 59 Minutes | 86 (1.6%) | 139 (3.0%) |
| 60 to 89 Minutes | 106 (2.0%) | 110 (2.3%) |
| 90 or more Minutes | 152 (2.8%) | 18 (0.4%) |
Time of Departure to Work by Sex in Ponca City
The most frequent times of departure to work in Ponca City are 7:30 AM to 7:59 AM (798, 14.8%) for males and 7:30 AM to 7:59 AM (1,069, 22.8%) for females.
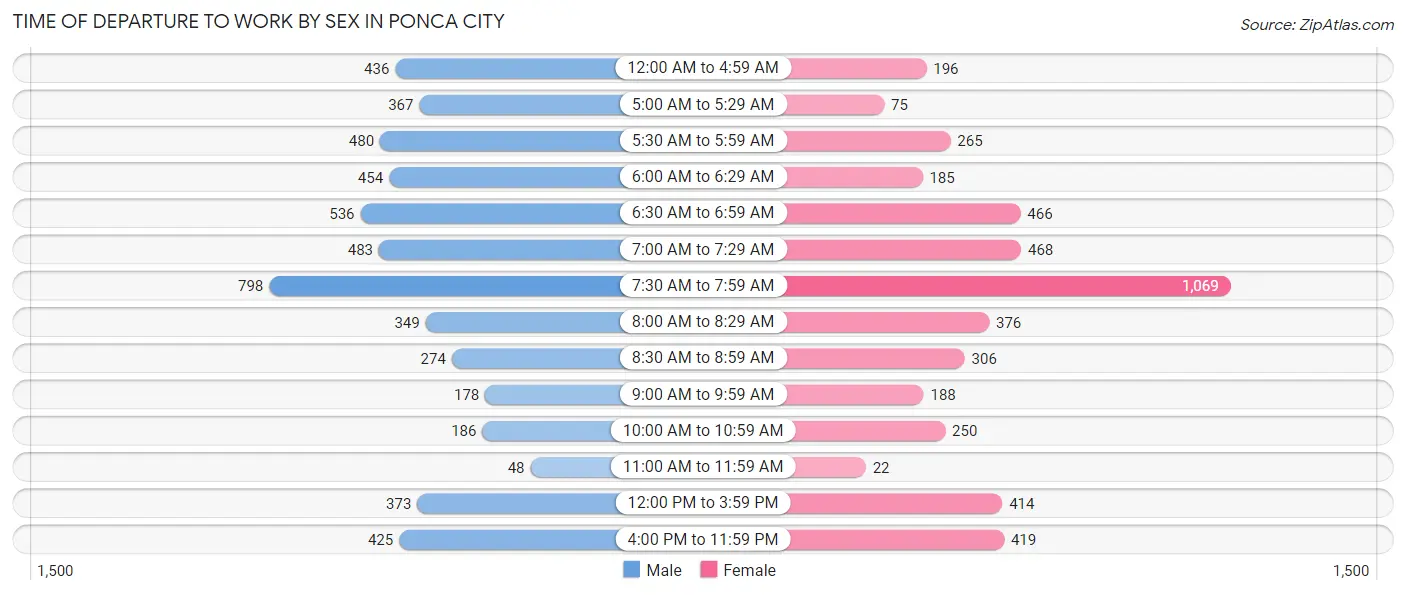
| Time of Departure | Male | Female |
| 12:00 AM to 4:59 AM | 436 (8.1%) | 196 (4.2%) |
| 5:00 AM to 5:29 AM | 367 (6.8%) | 75 (1.6%) |
| 5:30 AM to 5:59 AM | 480 (8.9%) | 265 (5.6%) |
| 6:00 AM to 6:29 AM | 454 (8.4%) | 185 (3.9%) |
| 6:30 AM to 6:59 AM | 536 (10.0%) | 466 (9.9%) |
| 7:00 AM to 7:29 AM | 483 (9.0%) | 468 (10.0%) |
| 7:30 AM to 7:59 AM | 798 (14.8%) | 1,069 (22.8%) |
| 8:00 AM to 8:29 AM | 349 (6.5%) | 376 (8.0%) |
| 8:30 AM to 8:59 AM | 274 (5.1%) | 306 (6.5%) |
| 9:00 AM to 9:59 AM | 178 (3.3%) | 188 (4.0%) |
| 10:00 AM to 10:59 AM | 186 (3.5%) | 250 (5.3%) |
| 11:00 AM to 11:59 AM | 48 (0.9%) | 22 (0.5%) |
| 12:00 PM to 3:59 PM | 373 (6.9%) | 414 (8.8%) |
| 4:00 PM to 11:59 PM | 425 (7.9%) | 419 (8.9%) |
| Total | 5,387 (100.0%) | 4,699 (100.0%) |
Housing Occupancy in Ponca City
Occupancy by Ownership in Ponca City
Of the total 9,343 dwellings in Ponca City, owner-occupied units account for 5,752 (61.6%), while renter-occupied units make up 3,591 (38.4%).
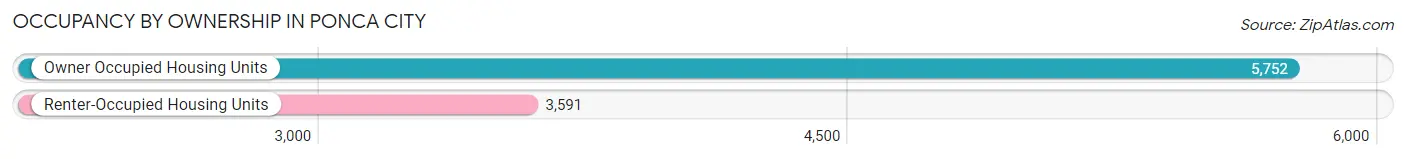
| Occupancy | # Housing Units | % Housing Units |
| Owner Occupied Housing Units | 5,752 | 61.6% |
| Renter-Occupied Housing Units | 3,591 | 38.4% |
| Total Occupied Housing Units | 9,343 | 100.0% |
Occupancy by Household Size in Ponca City
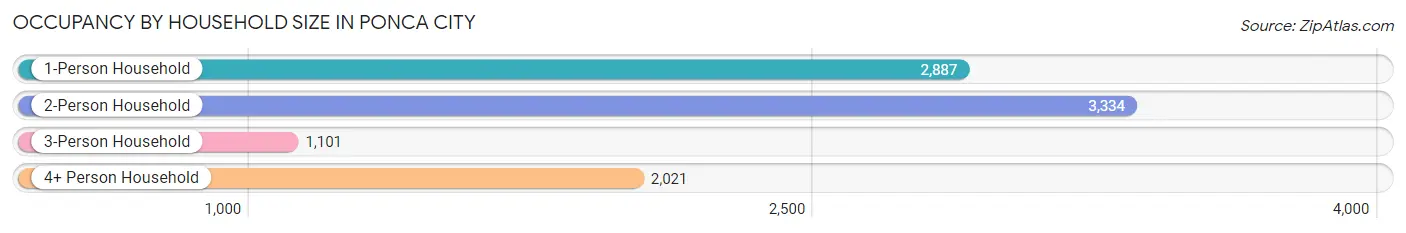
| Household Size | # Housing Units | % Housing Units |
| 1-Person Household | 2,887 | 30.9% |
| 2-Person Household | 3,334 | 35.7% |
| 3-Person Household | 1,101 | 11.8% |
| 4+ Person Household | 2,021 | 21.6% |
| Total Housing Units | 9,343 | 100.0% |
Occupancy by Ownership by Household Size in Ponca City
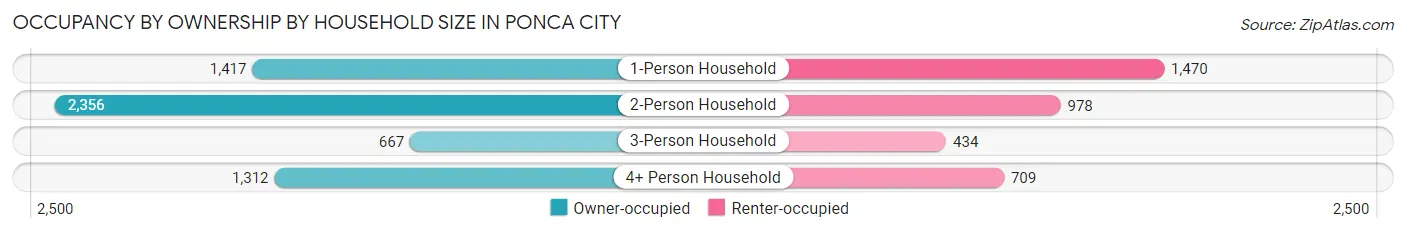
| Household Size | Owner-occupied | Renter-occupied |
| 1-Person Household | 1,417 (49.1%) | 1,470 (50.9%) |
| 2-Person Household | 2,356 (70.7%) | 978 (29.3%) |
| 3-Person Household | 667 (60.6%) | 434 (39.4%) |
| 4+ Person Household | 1,312 (64.9%) | 709 (35.1%) |
| Total Housing Units | 5,752 (61.6%) | 3,591 (38.4%) |
Occupancy by Educational Attainment in Ponca City
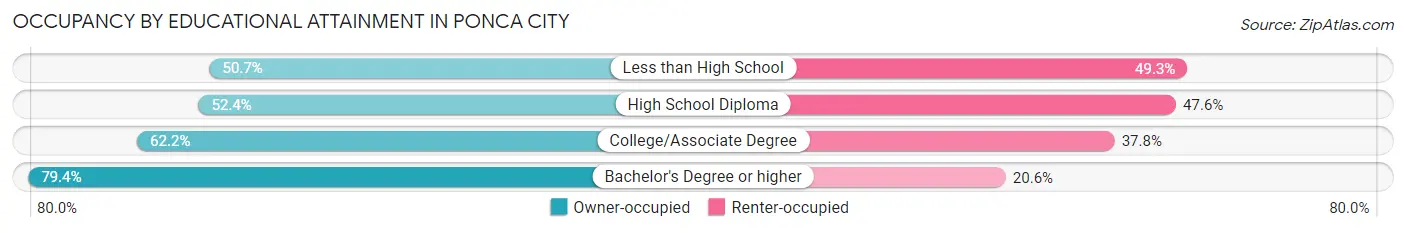
| Household Size | Owner-occupied | Renter-occupied |
| Less than High School | 410 (50.7%) | 399 (49.3%) |
| High School Diploma | 1,460 (52.4%) | 1,325 (47.6%) |
| College/Associate Degree | 2,462 (62.2%) | 1,499 (37.8%) |
| Bachelor's Degree or higher | 1,420 (79.4%) | 368 (20.6%) |
Occupancy by Age of Householder in Ponca City
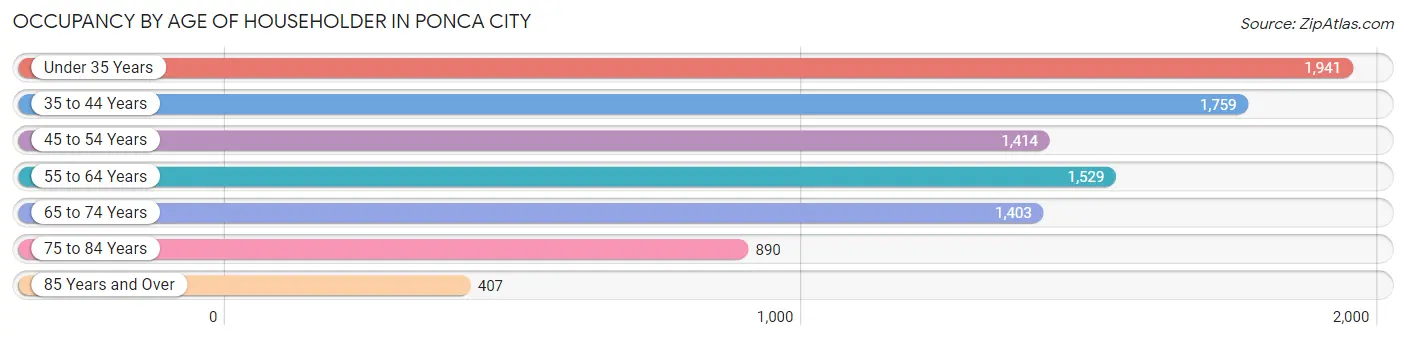
| Age Bracket | # Households | % Households |
| Under 35 Years | 1,941 | 20.8% |
| 35 to 44 Years | 1,759 | 18.8% |
| 45 to 54 Years | 1,414 | 15.1% |
| 55 to 64 Years | 1,529 | 16.4% |
| 65 to 74 Years | 1,403 | 15.0% |
| 75 to 84 Years | 890 | 9.5% |
| 85 Years and Over | 407 | 4.4% |
| Total | 9,343 | 100.0% |
Housing Finances in Ponca City
Median Income by Occupancy in Ponca City
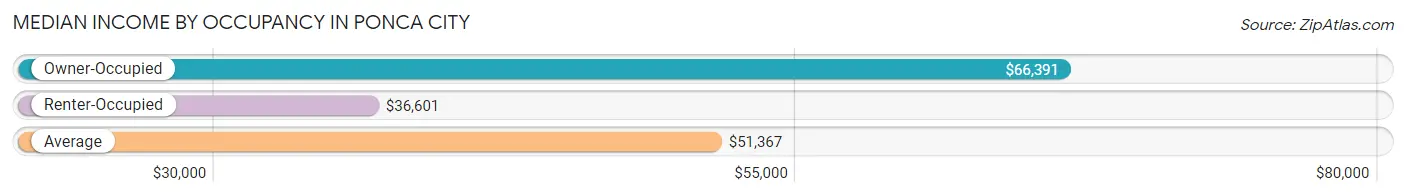
| Occupancy Type | # Households | Median Income |
| Owner-Occupied | 5,752 (61.6%) | $66,391 |
| Renter-Occupied | 3,591 (38.4%) | $36,601 |
| Average | 9,343 (100.0%) | $51,367 |
Occupancy by Householder Income Bracket in Ponca City
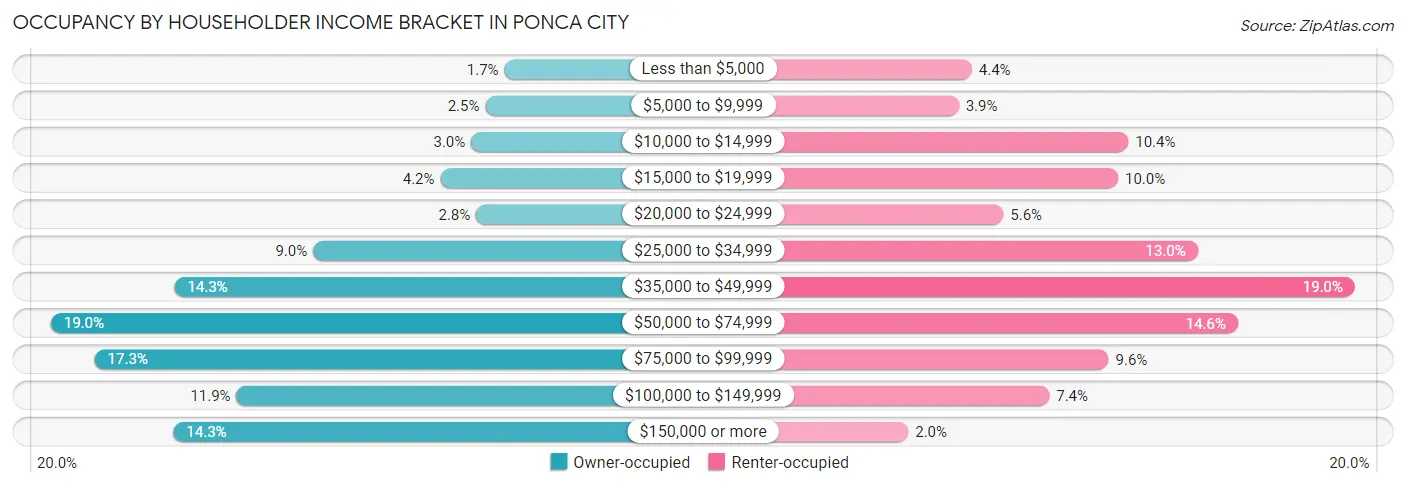
| Income Bracket | Owner-occupied | Renter-occupied |
| Less than $5,000 | 99 (1.7%) | 159 (4.4%) |
| $5,000 to $9,999 | 141 (2.5%) | 141 (3.9%) |
| $10,000 to $14,999 | 172 (3.0%) | 373 (10.4%) |
| $15,000 to $19,999 | 239 (4.2%) | 359 (10.0%) |
| $20,000 to $24,999 | 161 (2.8%) | 202 (5.6%) |
| $25,000 to $34,999 | 518 (9.0%) | 468 (13.0%) |
| $35,000 to $49,999 | 822 (14.3%) | 683 (19.0%) |
| $50,000 to $74,999 | 1,093 (19.0%) | 523 (14.6%) |
| $75,000 to $99,999 | 997 (17.3%) | 346 (9.6%) |
| $100,000 to $149,999 | 686 (11.9%) | 265 (7.4%) |
| $150,000 or more | 824 (14.3%) | 72 (2.0%) |
| Total | 5,752 (100.0%) | 3,591 (100.0%) |
Monthly Housing Cost Tiers in Ponca City
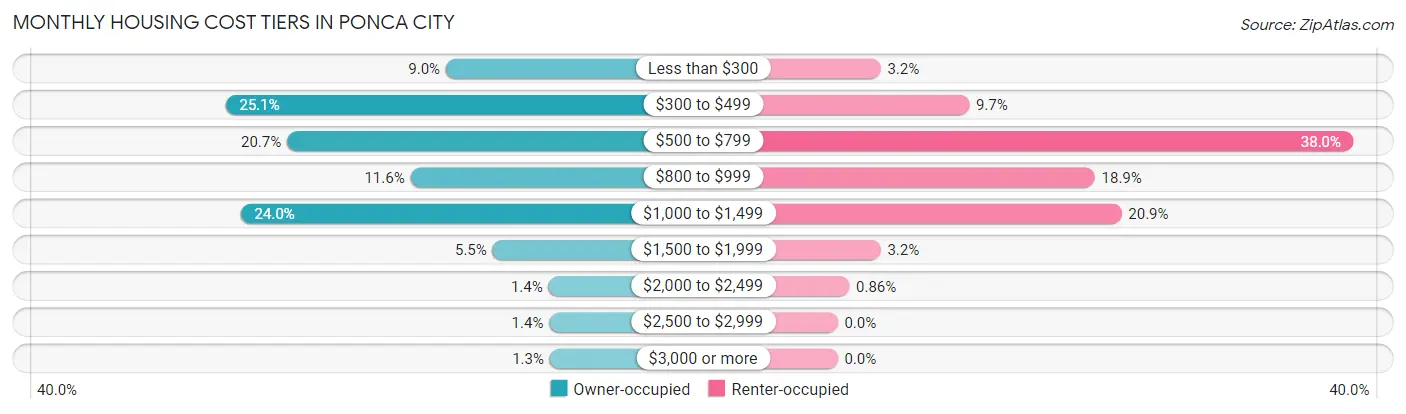
| Monthly Cost | Owner-occupied | Renter-occupied |
| Less than $300 | 516 (9.0%) | 114 (3.2%) |
| $300 to $499 | 1,446 (25.1%) | 348 (9.7%) |
| $500 to $799 | 1,189 (20.7%) | 1,363 (38.0%) |
| $800 to $999 | 666 (11.6%) | 680 (18.9%) |
| $1,000 to $1,499 | 1,382 (24.0%) | 751 (20.9%) |
| $1,500 to $1,999 | 318 (5.5%) | 114 (3.2%) |
| $2,000 to $2,499 | 81 (1.4%) | 31 (0.9%) |
| $2,500 to $2,999 | 78 (1.4%) | 0 (0.0%) |
| $3,000 or more | 76 (1.3%) | 0 (0.0%) |
| Total | 5,752 (100.0%) | 3,591 (100.0%) |
Physical Housing Characteristics in Ponca City
Housing Structures in Ponca City
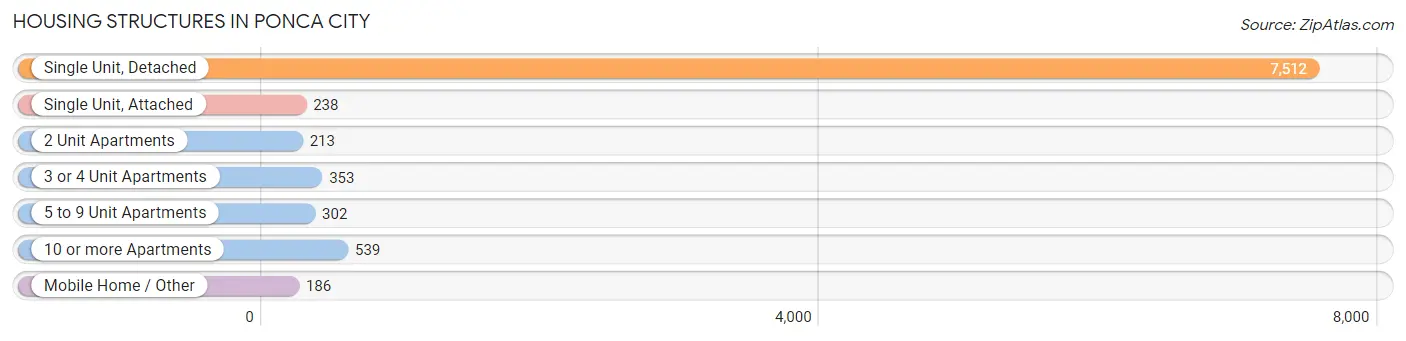
| Structure Type | # Housing Units | % Housing Units |
| Single Unit, Detached | 7,512 | 80.4% |
| Single Unit, Attached | 238 | 2.5% |
| 2 Unit Apartments | 213 | 2.3% |
| 3 or 4 Unit Apartments | 353 | 3.8% |
| 5 to 9 Unit Apartments | 302 | 3.2% |
| 10 or more Apartments | 539 | 5.8% |
| Mobile Home / Other | 186 | 2.0% |
| Total | 9,343 | 100.0% |
Housing Structures by Occupancy in Ponca City
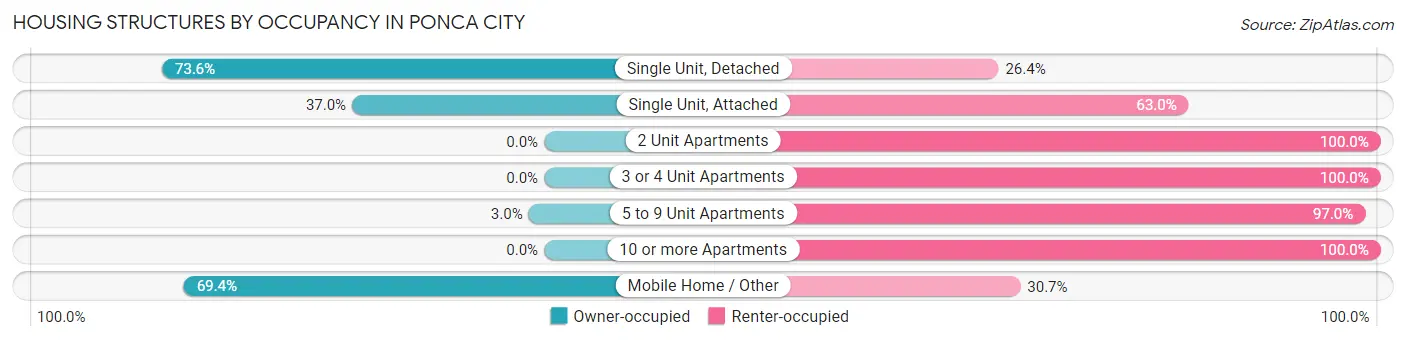
| Structure Type | Owner-occupied | Renter-occupied |
| Single Unit, Detached | 5,526 (73.6%) | 1,986 (26.4%) |
| Single Unit, Attached | 88 (37.0%) | 150 (63.0%) |
| 2 Unit Apartments | 0 (0.0%) | 213 (100.0%) |
| 3 or 4 Unit Apartments | 0 (0.0%) | 353 (100.0%) |
| 5 to 9 Unit Apartments | 9 (3.0%) | 293 (97.0%) |
| 10 or more Apartments | 0 (0.0%) | 539 (100.0%) |
| Mobile Home / Other | 129 (69.4%) | 57 (30.6%) |
| Total | 5,752 (61.6%) | 3,591 (38.4%) |
Housing Structures by Number of Rooms in Ponca City
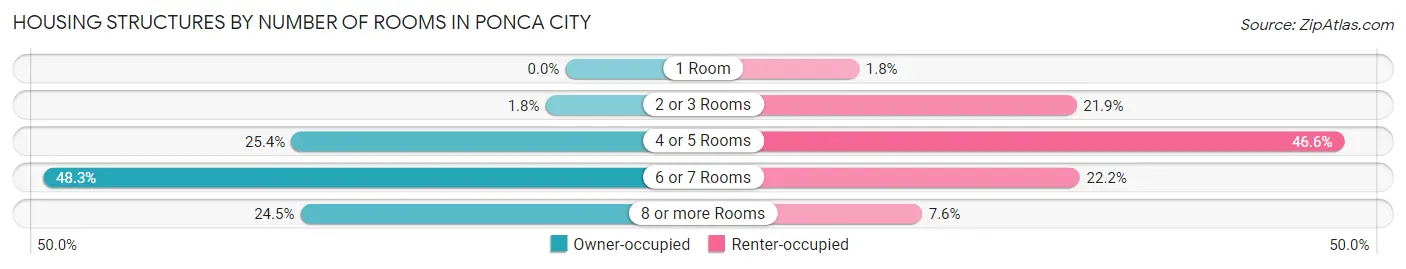
| Number of Rooms | Owner-occupied | Renter-occupied |
| 1 Room | 0 (0.0%) | 63 (1.8%) |
| 2 or 3 Rooms | 106 (1.8%) | 785 (21.9%) |
| 4 or 5 Rooms | 1,458 (25.4%) | 1,675 (46.6%) |
| 6 or 7 Rooms | 2,778 (48.3%) | 796 (22.2%) |
| 8 or more Rooms | 1,410 (24.5%) | 272 (7.6%) |
| Total | 5,752 (100.0%) | 3,591 (100.0%) |
Housing Structure by Heating Type in Ponca City
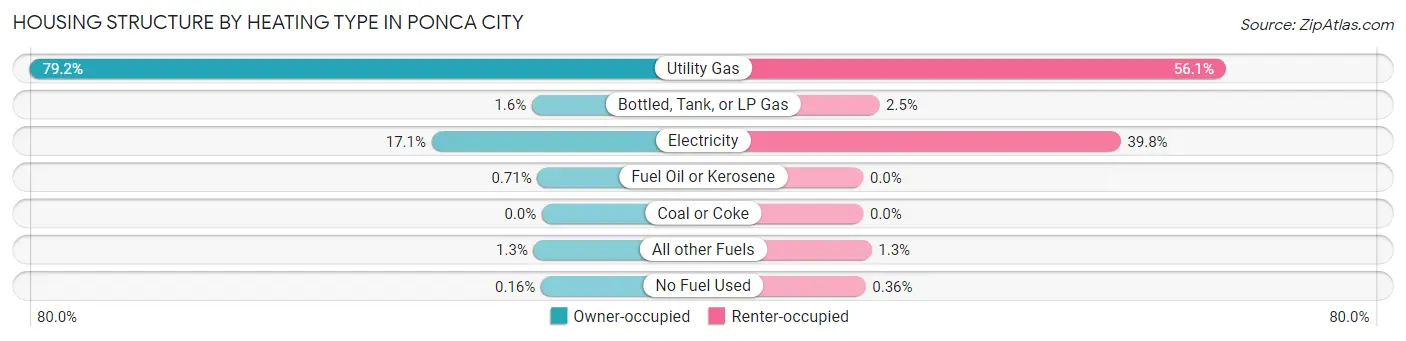
| Heating Type | Owner-occupied | Renter-occupied |
| Utility Gas | 4,558 (79.2%) | 2,014 (56.1%) |
| Bottled, Tank, or LP Gas | 89 (1.5%) | 89 (2.5%) |
| Electricity | 981 (17.1%) | 1,429 (39.8%) |
| Fuel Oil or Kerosene | 41 (0.7%) | 0 (0.0%) |
| Coal or Coke | 0 (0.0%) | 0 (0.0%) |
| All other Fuels | 74 (1.3%) | 46 (1.3%) |
| No Fuel Used | 9 (0.2%) | 13 (0.4%) |
| Total | 5,752 (100.0%) | 3,591 (100.0%) |
Household Vehicle Usage in Ponca City
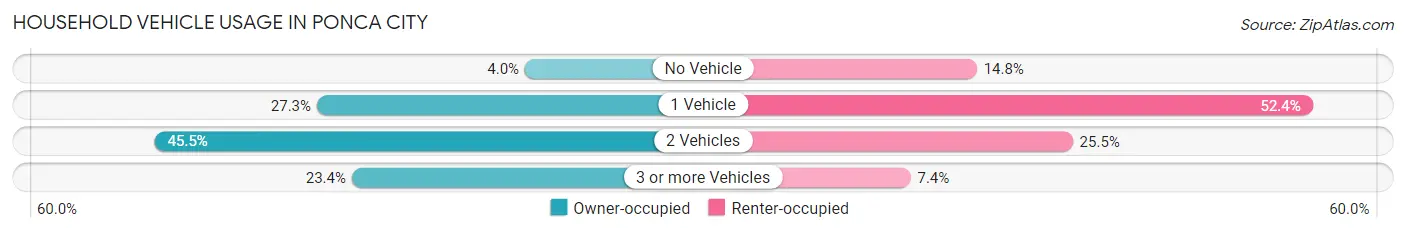
| Vehicles per Household | Owner-occupied | Renter-occupied |
| No Vehicle | 227 (4.0%) | 530 (14.8%) |
| 1 Vehicle | 1,568 (27.3%) | 1,881 (52.4%) |
| 2 Vehicles | 2,614 (45.5%) | 916 (25.5%) |
| 3 or more Vehicles | 1,343 (23.4%) | 264 (7.3%) |
| Total | 5,752 (100.0%) | 3,591 (100.0%) |
Real Estate & Mortgages in Ponca City
Real Estate and Mortgage Overview in Ponca City
| Characteristic | Without Mortgage | With Mortgage |
| Housing Units | 2,985 | 2,767 |
| Median Property Value | $110,200 | $127,900 |
| Median Household Income | $53,989 | $429 |
| Monthly Housing Costs | $440 | $76 |
| Real Estate Taxes | $753 | $105 |
Property Value by Mortgage Status in Ponca City
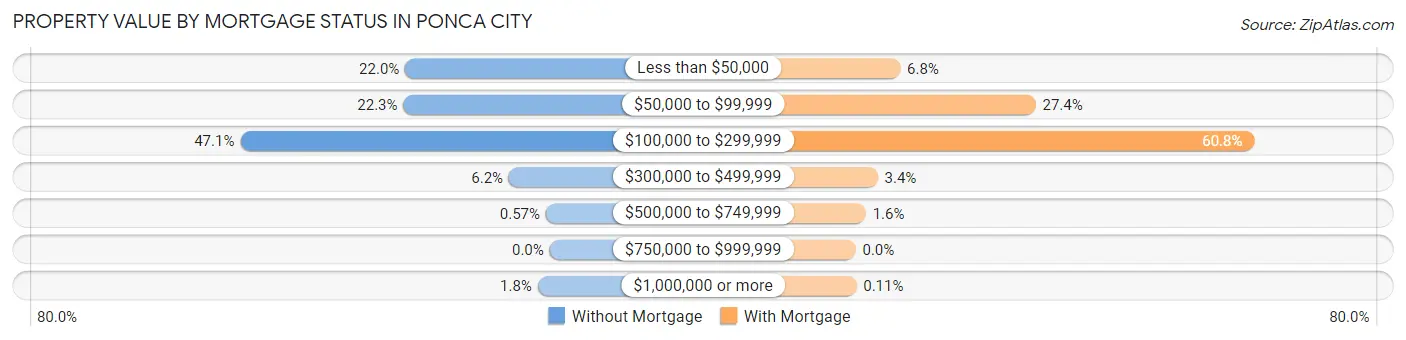
| Property Value | Without Mortgage | With Mortgage |
| Less than $50,000 | 657 (22.0%) | 188 (6.8%) |
| $50,000 to $99,999 | 665 (22.3%) | 759 (27.4%) |
| $100,000 to $299,999 | 1,407 (47.1%) | 1,681 (60.8%) |
| $300,000 to $499,999 | 185 (6.2%) | 93 (3.4%) |
| $500,000 to $749,999 | 17 (0.6%) | 43 (1.5%) |
| $750,000 to $999,999 | 0 (0.0%) | 0 (0.0%) |
| $1,000,000 or more | 54 (1.8%) | 3 (0.1%) |
| Total | 2,985 (100.0%) | 2,767 (100.0%) |
Household Income by Mortgage Status in Ponca City
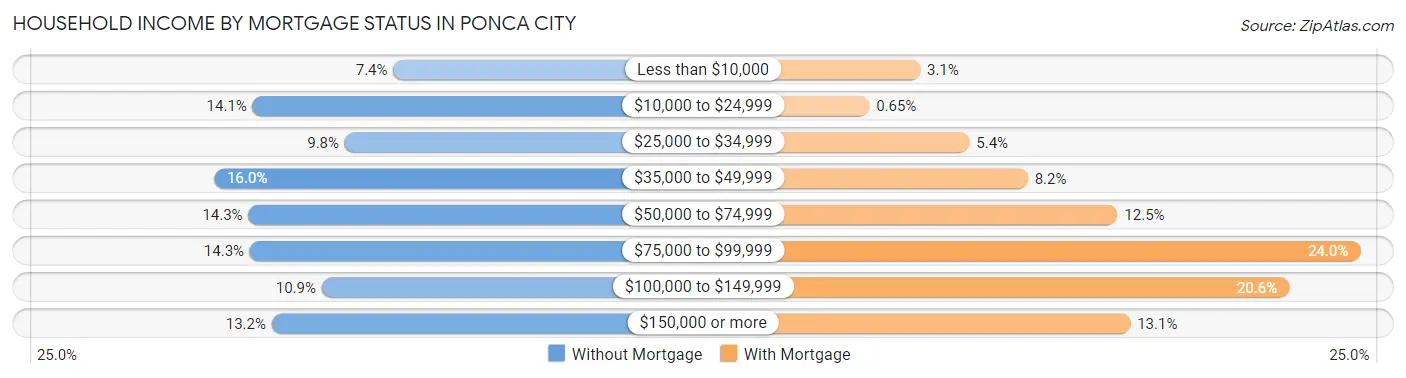
| Household Income | Without Mortgage | With Mortgage |
| Less than $10,000 | 222 (7.4%) | 85 (3.1%) |
| $10,000 to $24,999 | 422 (14.1%) | 18 (0.6%) |
| $25,000 to $34,999 | 291 (9.8%) | 150 (5.4%) |
| $35,000 to $49,999 | 477 (16.0%) | 227 (8.2%) |
| $50,000 to $74,999 | 428 (14.3%) | 345 (12.5%) |
| $75,000 to $99,999 | 426 (14.3%) | 665 (24.0%) |
| $100,000 to $149,999 | 324 (10.8%) | 571 (20.6%) |
| $150,000 or more | 395 (13.2%) | 362 (13.1%) |
| Total | 2,985 (100.0%) | 2,767 (100.0%) |
Property Value to Household Income Ratio in Ponca City
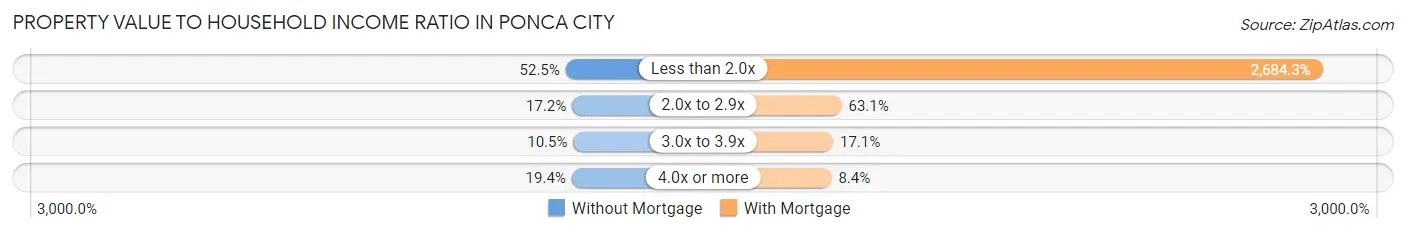
| Value-to-Income Ratio | Without Mortgage | With Mortgage |
| Less than 2.0x | 1,568 (52.5%) | 74,274 (2,684.3%) |
| 2.0x to 2.9x | 513 (17.2%) | 1,747 (63.1%) |
| 3.0x to 3.9x | 314 (10.5%) | 472 (17.1%) |
| 4.0x or more | 579 (19.4%) | 231 (8.4%) |
| Total | 2,985 (100.0%) | 2,767 (100.0%) |
Real Estate Taxes by Mortgage Status in Ponca City
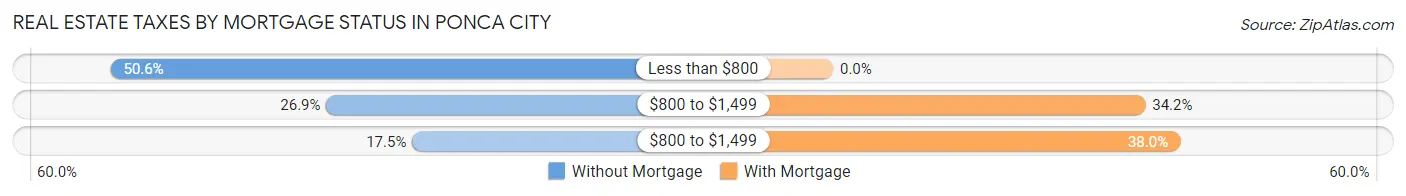
| Property Taxes | Without Mortgage | With Mortgage |
| Less than $800 | 1,510 (50.6%) | 0 (0.0%) |
| $800 to $1,499 | 804 (26.9%) | 947 (34.2%) |
| $800 to $1,499 | 523 (17.5%) | 1,052 (38.0%) |
| Total | 2,985 (100.0%) | 2,767 (100.0%) |
Health & Disability in Ponca City
Health Insurance Coverage by Age in Ponca City
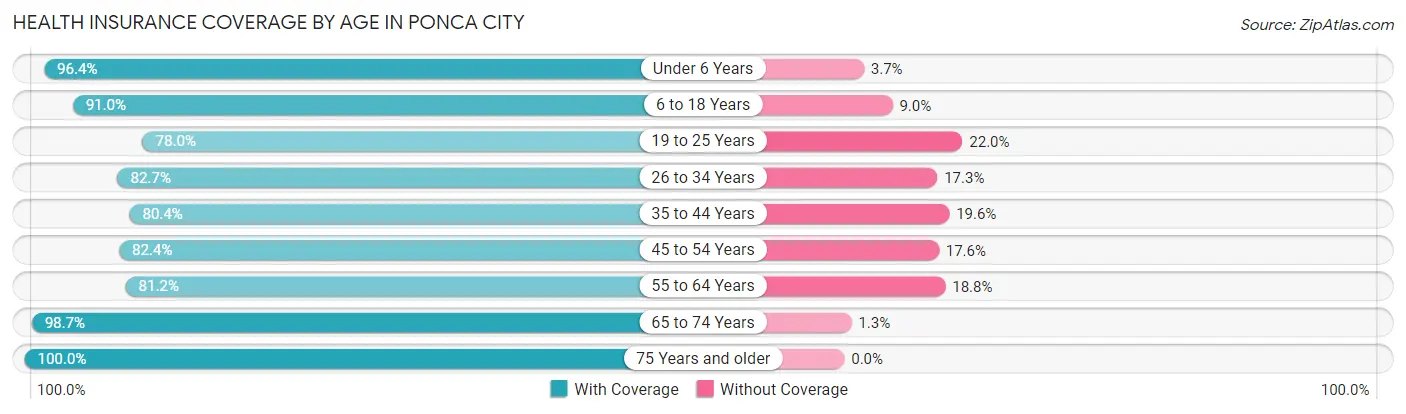
| Age Bracket | With Coverage | Without Coverage |
| Under 6 Years | 1,952 (96.4%) | 74 (3.6%) |
| 6 to 18 Years | 3,982 (91.0%) | 393 (9.0%) |
| 19 to 25 Years | 1,753 (78.0%) | 495 (22.0%) |
| 26 to 34 Years | 2,347 (82.7%) | 492 (17.3%) |
| 35 to 44 Years | 2,504 (80.4%) | 609 (19.6%) |
| 45 to 54 Years | 1,997 (82.4%) | 427 (17.6%) |
| 55 to 64 Years | 2,275 (81.2%) | 528 (18.8%) |
| 65 to 74 Years | 2,293 (98.7%) | 31 (1.3%) |
| 75 Years and older | 1,806 (100.0%) | 0 (0.0%) |
| Total | 20,909 (87.3%) | 3,049 (12.7%) |
Health Insurance Coverage by Citizenship Status in Ponca City
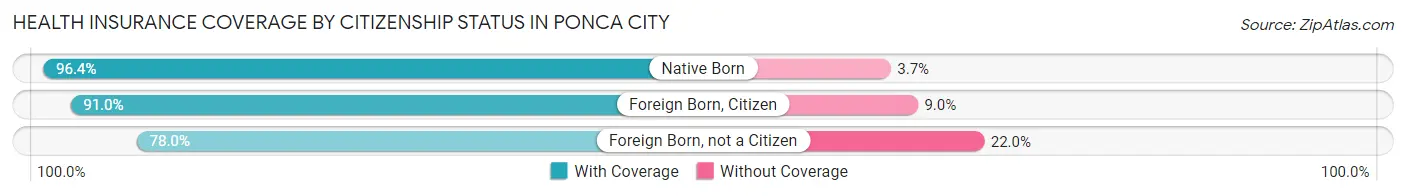
| Citizenship Status | With Coverage | Without Coverage |
| Native Born | 1,952 (96.4%) | 74 (3.6%) |
| Foreign Born, Citizen | 3,982 (91.0%) | 393 (9.0%) |
| Foreign Born, not a Citizen | 1,753 (78.0%) | 495 (22.0%) |
Health Insurance Coverage by Household Income in Ponca City
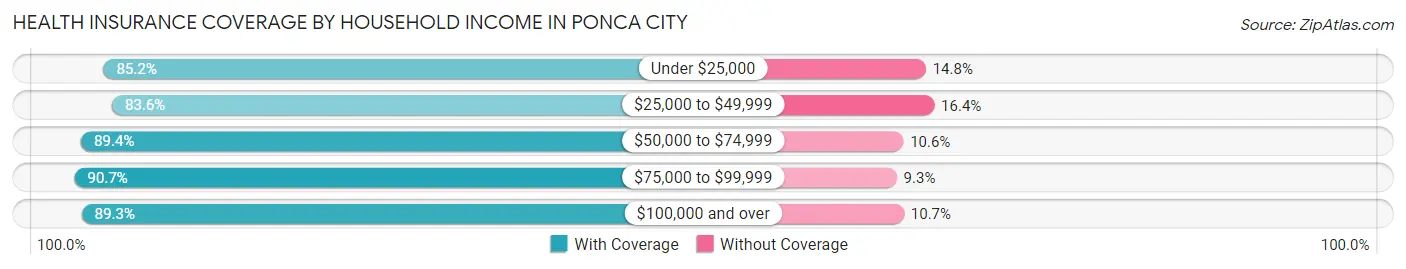
| Household Income | With Coverage | Without Coverage |
| Under $25,000 | 3,162 (85.2%) | 549 (14.8%) |
| $25,000 to $49,999 | 4,717 (83.6%) | 923 (16.4%) |
| $50,000 to $74,999 | 3,781 (89.4%) | 447 (10.6%) |
| $75,000 to $99,999 | 3,515 (90.7%) | 362 (9.3%) |
| $100,000 and over | 5,604 (89.3%) | 671 (10.7%) |
Public vs Private Health Insurance Coverage by Age in Ponca City
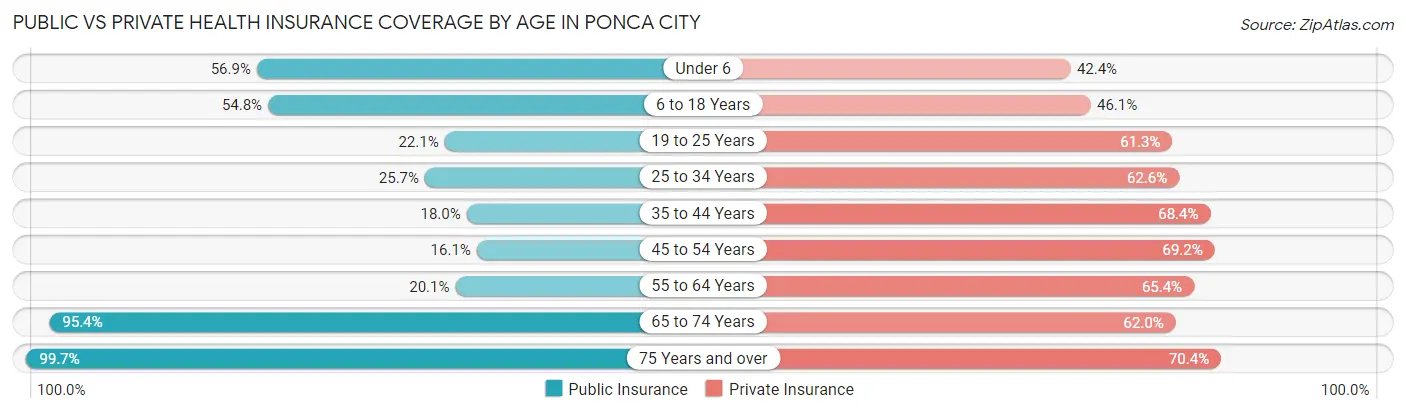
| Age Bracket | Public Insurance | Private Insurance |
| Under 6 | 1,153 (56.9%) | 858 (42.3%) |
| 6 to 18 Years | 2,399 (54.8%) | 2,016 (46.1%) |
| 19 to 25 Years | 496 (22.1%) | 1,379 (61.3%) |
| 25 to 34 Years | 730 (25.7%) | 1,777 (62.6%) |
| 35 to 44 Years | 559 (18.0%) | 2,129 (68.4%) |
| 45 to 54 Years | 390 (16.1%) | 1,677 (69.2%) |
| 55 to 64 Years | 562 (20.1%) | 1,832 (65.4%) |
| 65 to 74 Years | 2,217 (95.4%) | 1,440 (62.0%) |
| 75 Years and over | 1,800 (99.7%) | 1,271 (70.4%) |
| Total | 10,306 (43.0%) | 14,379 (60.0%) |
Disability Status by Sex by Age in Ponca City
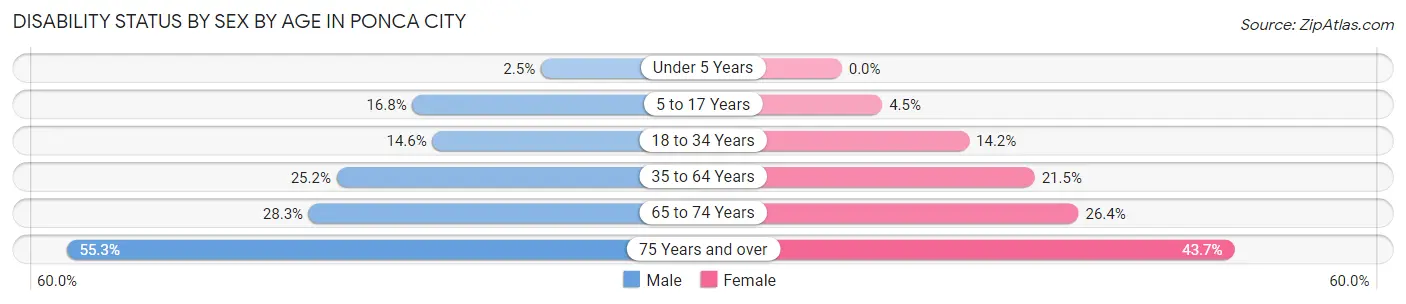
| Age Bracket | Male | Female |
| Under 5 Years | 21 (2.5%) | 0 (0.0%) |
| 5 to 17 Years | 365 (16.8%) | 98 (4.5%) |
| 18 to 34 Years | 376 (14.6%) | 405 (14.2%) |
| 35 to 64 Years | 1,081 (25.2%) | 872 (21.5%) |
| 65 to 74 Years | 276 (28.3%) | 356 (26.4%) |
| 75 Years and over | 436 (55.3%) | 445 (43.7%) |
Disability Class by Sex by Age in Ponca City
Disability Class: Hearing Difficulty
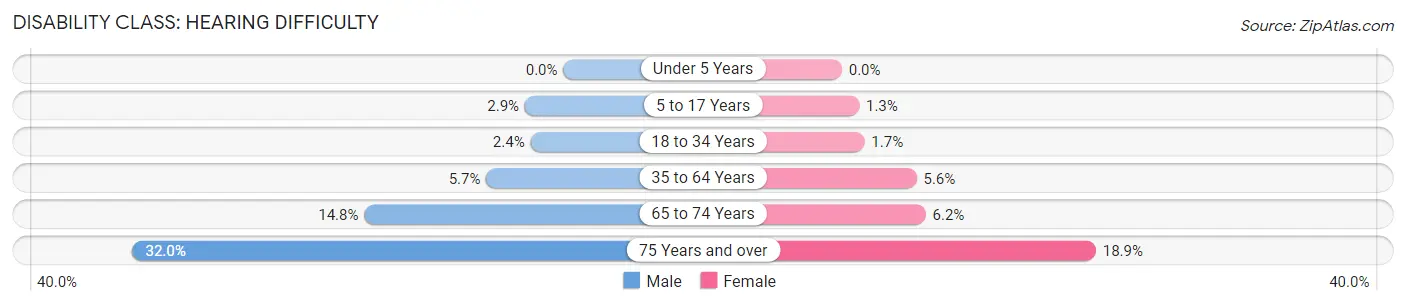
| Age Bracket | Male | Female |
| Under 5 Years | 0 (0.0%) | 0 (0.0%) |
| 5 to 17 Years | 62 (2.9%) | 28 (1.3%) |
| 18 to 34 Years | 63 (2.4%) | 48 (1.7%) |
| 35 to 64 Years | 245 (5.7%) | 225 (5.6%) |
| 65 to 74 Years | 144 (14.8%) | 84 (6.2%) |
| 75 Years and over | 252 (32.0%) | 192 (18.9%) |
Disability Class: Vision Difficulty
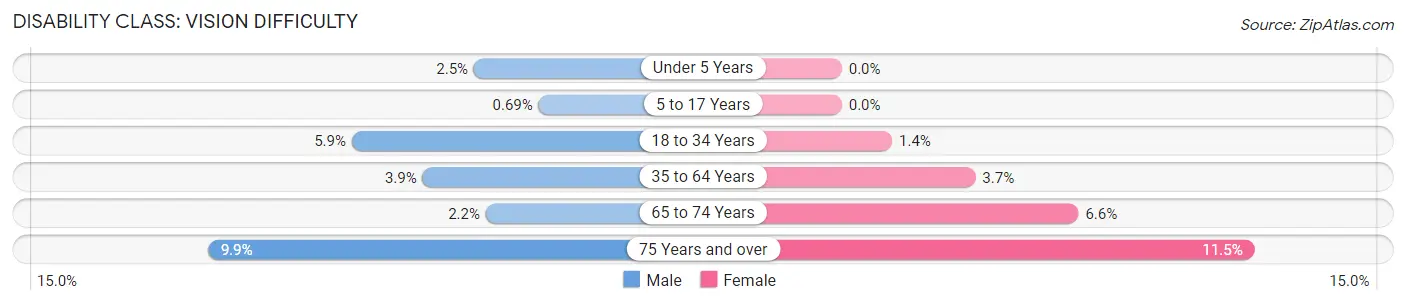
| Age Bracket | Male | Female |
| Under 5 Years | 21 (2.5%) | 0 (0.0%) |
| 5 to 17 Years | 15 (0.7%) | 0 (0.0%) |
| 18 to 34 Years | 152 (5.9%) | 40 (1.4%) |
| 35 to 64 Years | 168 (3.9%) | 151 (3.7%) |
| 65 to 74 Years | 21 (2.2%) | 89 (6.6%) |
| 75 Years and over | 78 (9.9%) | 117 (11.5%) |
Disability Class: Cognitive Difficulty
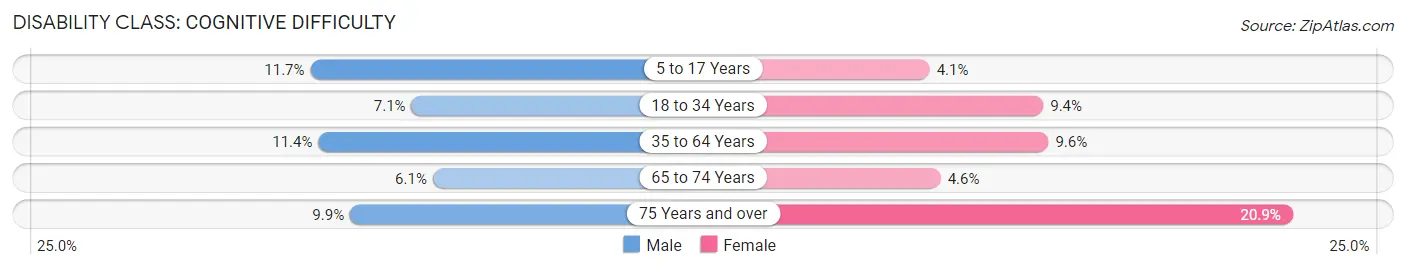
| Age Bracket | Male | Female |
| 5 to 17 Years | 255 (11.7%) | 89 (4.1%) |
| 18 to 34 Years | 182 (7.0%) | 267 (9.3%) |
| 35 to 64 Years | 487 (11.4%) | 389 (9.6%) |
| 65 to 74 Years | 59 (6.1%) | 62 (4.6%) |
| 75 Years and over | 78 (9.9%) | 213 (20.9%) |
Disability Class: Ambulatory Difficulty
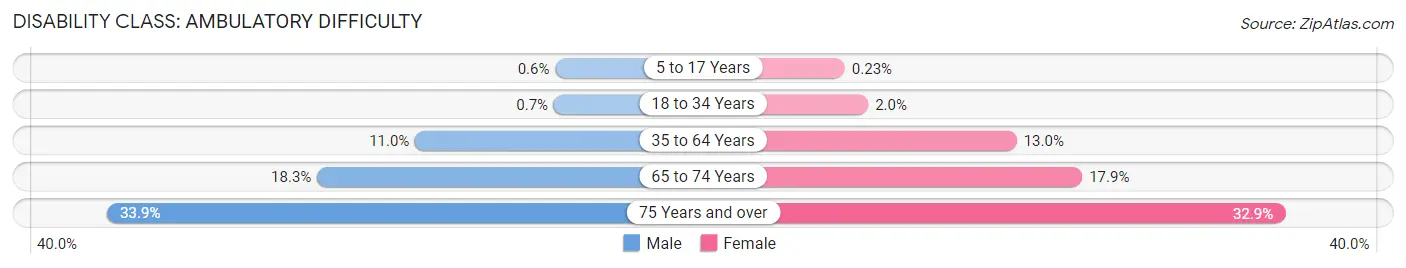
| Age Bracket | Male | Female |
| 5 to 17 Years | 13 (0.6%) | 5 (0.2%) |
| 18 to 34 Years | 18 (0.7%) | 56 (2.0%) |
| 35 to 64 Years | 471 (11.0%) | 527 (13.0%) |
| 65 to 74 Years | 178 (18.3%) | 241 (17.8%) |
| 75 Years and over | 267 (33.9%) | 335 (32.9%) |
Disability Class: Self-Care Difficulty
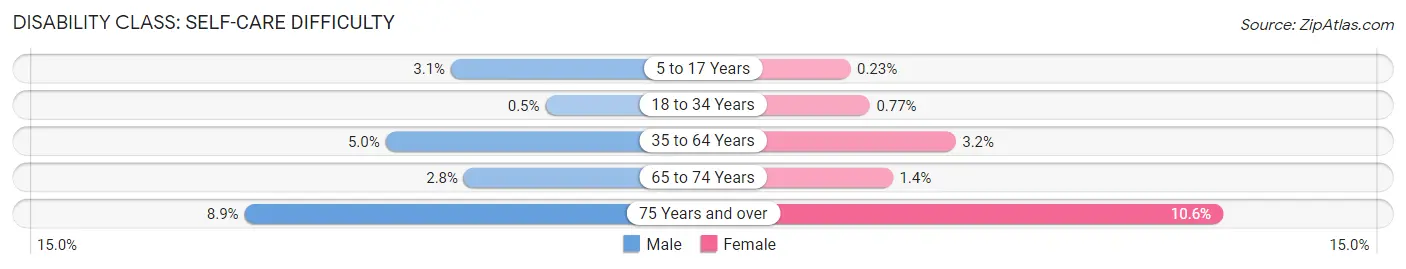
| Age Bracket | Male | Female |
| 5 to 17 Years | 68 (3.1%) | 5 (0.2%) |
| 18 to 34 Years | 13 (0.5%) | 22 (0.8%) |
| 35 to 64 Years | 212 (5.0%) | 128 (3.2%) |
| 65 to 74 Years | 27 (2.8%) | 19 (1.4%) |
| 75 Years and over | 70 (8.9%) | 108 (10.6%) |
Technology Access in Ponca City
Computing Device Access in Ponca City
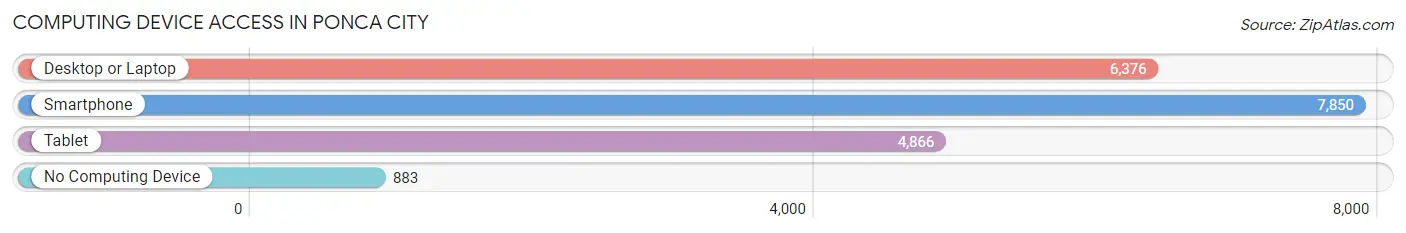
| Device Type | # Households | % Households |
| Desktop or Laptop | 6,376 | 68.2% |
| Smartphone | 7,850 | 84.0% |
| Tablet | 4,866 | 52.1% |
| No Computing Device | 883 | 9.5% |
| Total | 9,343 | 100.0% |
Internet Access in Ponca City
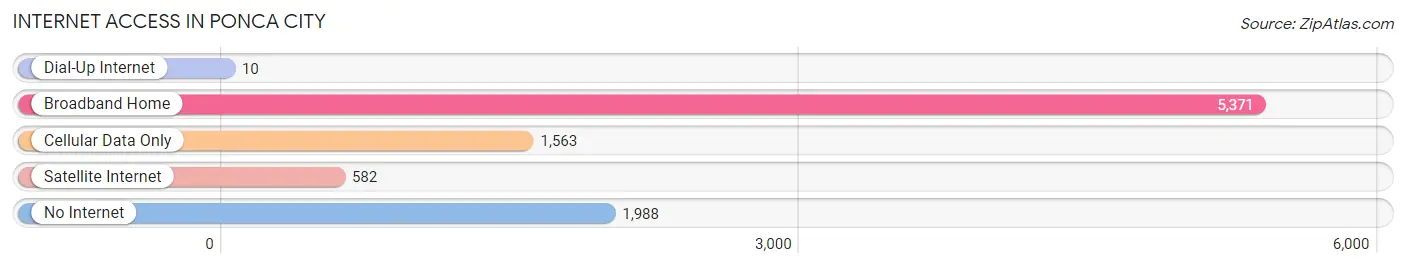
| Internet Type | # Households | % Households |
| Dial-Up Internet | 10 | 0.1% |
| Broadband Home | 5,371 | 57.5% |
| Cellular Data Only | 1,563 | 16.7% |
| Satellite Internet | 582 | 6.2% |
| No Internet | 1,988 | 21.3% |
| Total | 9,343 | 100.0% |
Ponca City Summary
Ponca City is a city located in Kay County, Oklahoma, United States. It is the county seat of Kay County and is located in the north-central part of the state. The population was 25,387 at the 2010 census, making it the eleventh largest city in Oklahoma.
History
Ponca City was founded in 1893 by the Ponca Tribe of Native Americans. The tribe had been relocated to Oklahoma from Nebraska in 1877. The city was named after the Ponca Tribe, and the name is derived from the Ponca word for "hill people." The city was incorporated in 1893 and was the first city in Oklahoma to be incorporated by Native Americans.
The city was originally a trading post for the Ponca Tribe, and it quickly grew into a bustling town. The city was home to a variety of businesses, including a flour mill, a sawmill, a brickyard, and a hotel. The city also had a variety of churches, schools, and other institutions.
In the early 1900s, the city began to experience a period of growth and prosperity. The city was home to a variety of industries, including oil and gas production, manufacturing, and agriculture. The city was also home to a variety of cultural and educational institutions, including the Ponca City Public Library, the Ponca City Art Center, and the Ponca City Museum.
Geography
Ponca City is located in north-central Oklahoma, in Kay County. The city is situated on the Arkansas River, and is located approximately 90 miles north of Oklahoma City. The city has a total area of 16.2 square miles, of which 16.1 square miles is land and 0.1 square miles is water.
The city is located in a region of rolling hills and prairies. The climate is characterized by hot, humid summers and cold, dry winters. The average annual temperature is 61 degrees Fahrenheit, and the average annual precipitation is 33 inches.
Economy
Ponca City is home to a variety of industries, including oil and gas production, manufacturing, and agriculture. The city is also home to a variety of retail and service businesses. The city is home to a variety of educational and cultural institutions, including the Ponca City Public Library, the Ponca City Art Center, and the Ponca City Museum.
The city is home to a variety of major employers, including ConocoPhillips, the largest employer in the city. Other major employers include the Ponca City Public Schools, the Kay County Courthouse, and the Ponca City Medical Center.
Demographics
As of the 2010 census, the population of Ponca City was 25,387. The racial makeup of the city was 79.3% White, 8.2% African American, 5.3% Native American, 1.2% Asian, 0.1% Pacific Islander, and 4.9% from other races. The median household income was $37,945, and the median family income was $45,945. The per capita income was $20,945.
Conclusion
Ponca City is a city located in Kay County, Oklahoma, United States. It is the county seat of Kay County and is located in the north-central part of the state. The city was founded in 1893 by the Ponca Tribe of Native Americans, and it quickly grew into a bustling town. The city is home to a variety of industries, including oil and gas production, manufacturing, and agriculture. The population of Ponca City was 25,387 at the 2010 census, making it the eleventh largest city in Oklahoma. The city is home to a variety of major employers, including ConocoPhillips, the largest employer in the city. The median household income was $37,945, and the median family income was $45,945.
Common Questions
What is Per Capita Income in Ponca City?
Per Capita income in Ponca City is $29,976.
What is the Median Family Income in Ponca City?
Median Family Income in Ponca City is $64,708.
What is the Median Household income in Ponca City?
Median Household Income in Ponca City is $51,367.
What is Income or Wage Gap in Ponca City?
Income or Wage Gap in Ponca City is 24.7%.
Women in Ponca City earn 75.3 cents for every dollar earned by a man.
What is Family Income Deficit in Ponca City?
Family Income Deficit in Ponca City is $11,819.
Families that are below poverty line in Ponca City earn $11,819 less on average than the poverty threshold level.
What is Inequality or Gini Index in Ponca City?
Inequality or Gini Index in Ponca City is 0.47.
What is the Total Population of Ponca City?
Total Population of Ponca City is 24,441.
What is the Total Male Population of Ponca City?
Total Male Population of Ponca City is 11,905.
What is the Total Female Population of Ponca City?
Total Female Population of Ponca City is 12,536.
What is the Ratio of Males per 100 Females in Ponca City?
There are 94.97 Males per 100 Females in Ponca City.
What is the Ratio of Females per 100 Males in Ponca City?
There are 105.30 Females per 100 Males in Ponca City.
What is the Median Population Age in Ponca City?
Median Population Age in Ponca City is 37.0 Years.
What is the Average Family Size in Ponca City
Average Family Size in Ponca City is 3.2 People.
What is the Average Household Size in Ponca City
Average Household Size in Ponca City is 2.5 People.
How Large is the Labor Force in Ponca City?
There are 11,384 People in the Labor Forcein in Ponca City.
What is the Percentage of People in the Labor Force in Ponca City?
60.2% of People are in the Labor Force in Ponca City.
What is the Unemployment Rate in Ponca City?
Unemployment Rate in Ponca City is 6.7%.