Miami, OK Map & Demographics
Miami Map
Miami Overview
$22,385
PER CAPITA INCOME
$53,338
AVG FAMILY INCOME
$44,010
AVG HOUSEHOLD INCOME
29.0%
WAGE / INCOME GAP [ % ]
71.0¢/ $1
WAGE / INCOME GAP [ $ ]
$11,284
FAMILY INCOME DEFICIT
0.45
INEQUALITY / GINI INDEX
12,995
TOTAL POPULATION
6,451
MALE POPULATION
6,544
FEMALE POPULATION
98.58
MALES / 100 FEMALES
101.44
FEMALES / 100 MALES
32.7
MEDIAN AGE
3.1
AVG FAMILY SIZE
2.5
AVG HOUSEHOLD SIZE
5,425
LABOR FORCE [ PEOPLE ]
54.3%
PERCENT IN LABOR FORCE
3.3%
UNEMPLOYMENT RATE
Miami Zip Codes
Miami Area Codes
Income in Miami
Income Overview in Miami
Per Capita Income in Miami is $22,385, while median incomes of families and households are $53,338 and $44,010 respectively.
| Characteristic | Number | Measure |
| Per Capita Income | 12,995 | $22,385 |
| Median Family Income | 2,987 | $53,338 |
| Mean Family Income | 2,987 | $65,313 |
| Median Household Income | 4,868 | $44,010 |
| Mean Household Income | 4,868 | $57,041 |
| Income Deficit | 2,987 | $11,284 |
| Wage / Income Gap (%) | 12,995 | 29.02% |
| Wage / Income Gap ($) | 12,995 | 70.98¢ per $1 |
| Gini / Inequality Index | 12,995 | 0.45 |
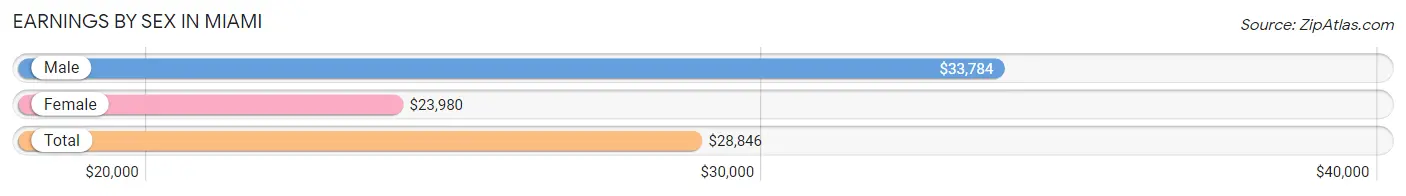
Earnings by Sex in Miami
Average Earnings in Miami are $28,846, $33,784 for men and $23,980 for women, a difference of 29.0%.
| Sex | Number | Average Earnings |
| Male | 3,000 (50.9%) | $33,784 |
| Female | 2,888 (49.0%) | $23,980 |
| Total | 5,888 (100.0%) | $28,846 |
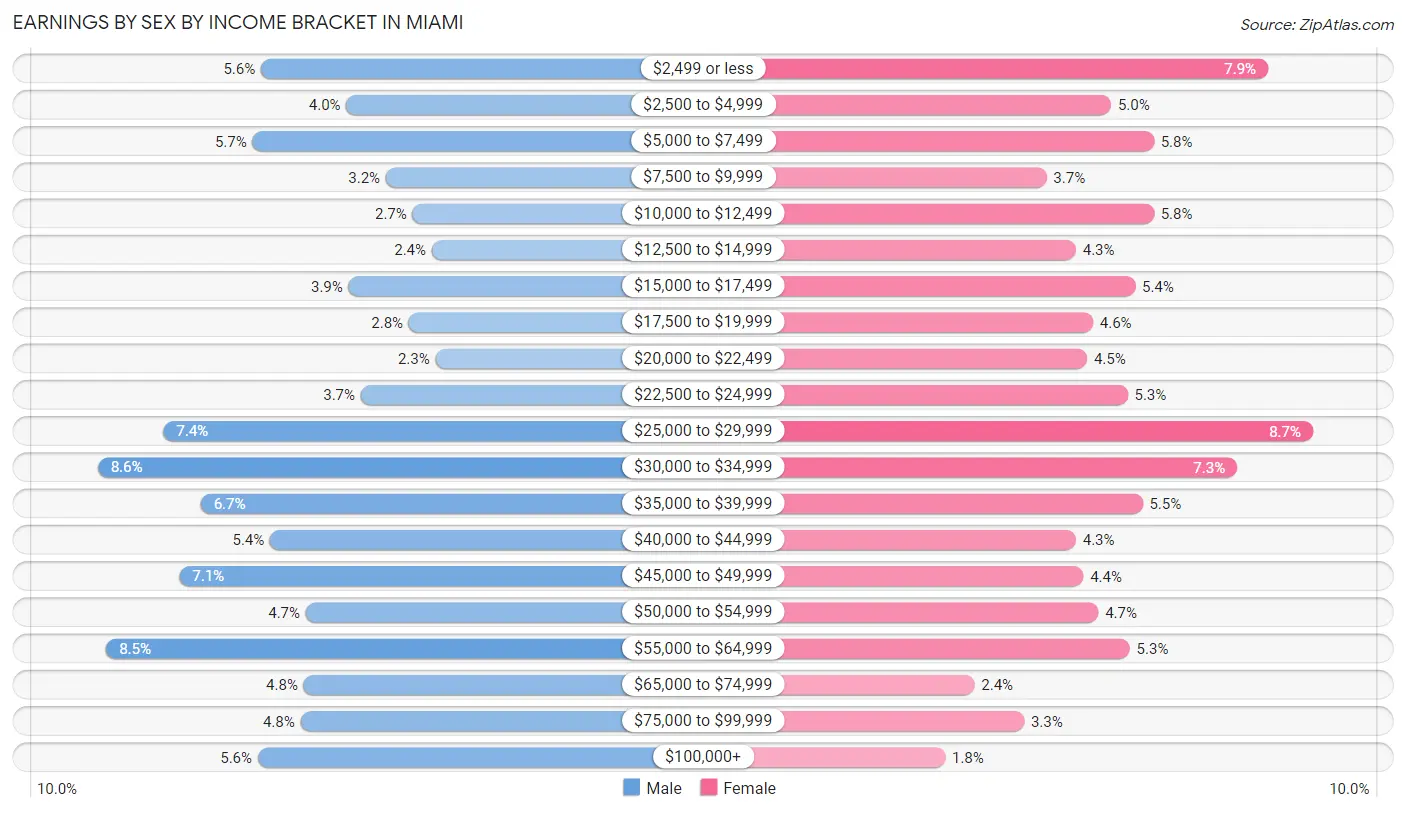
Earnings by Sex by Income Bracket in Miami
The most common earnings brackets in Miami are $30,000 to $34,999 for men (259 | 8.6%) and $25,000 to $29,999 for women (252 | 8.7%).
| Income | Male | Female |
| $2,499 or less | 167 (5.6%) | 228 (7.9%) |
| $2,500 to $4,999 | 119 (4.0%) | 143 (5.0%) |
| $5,000 to $7,499 | 172 (5.7%) | 166 (5.8%) |
| $7,500 to $9,999 | 97 (3.2%) | 108 (3.7%) |
| $10,000 to $12,499 | 82 (2.7%) | 166 (5.8%) |
| $12,500 to $14,999 | 71 (2.4%) | 124 (4.3%) |
| $15,000 to $17,499 | 118 (3.9%) | 156 (5.4%) |
| $17,500 to $19,999 | 84 (2.8%) | 133 (4.6%) |
| $20,000 to $22,499 | 69 (2.3%) | 130 (4.5%) |
| $22,500 to $24,999 | 111 (3.7%) | 152 (5.3%) |
| $25,000 to $29,999 | 222 (7.4%) | 252 (8.7%) |
| $30,000 to $34,999 | 259 (8.6%) | 211 (7.3%) |
| $35,000 to $39,999 | 201 (6.7%) | 160 (5.5%) |
| $40,000 to $44,999 | 162 (5.4%) | 124 (4.3%) |
| $45,000 to $49,999 | 213 (7.1%) | 128 (4.4%) |
| $50,000 to $54,999 | 142 (4.7%) | 136 (4.7%) |
| $55,000 to $64,999 | 254 (8.5%) | 153 (5.3%) |
| $65,000 to $74,999 | 143 (4.8%) | 69 (2.4%) |
| $75,000 to $99,999 | 145 (4.8%) | 96 (3.3%) |
| $100,000+ | 169 (5.6%) | 53 (1.8%) |
| Total | 3,000 (100.0%) | 2,888 (100.0%) |
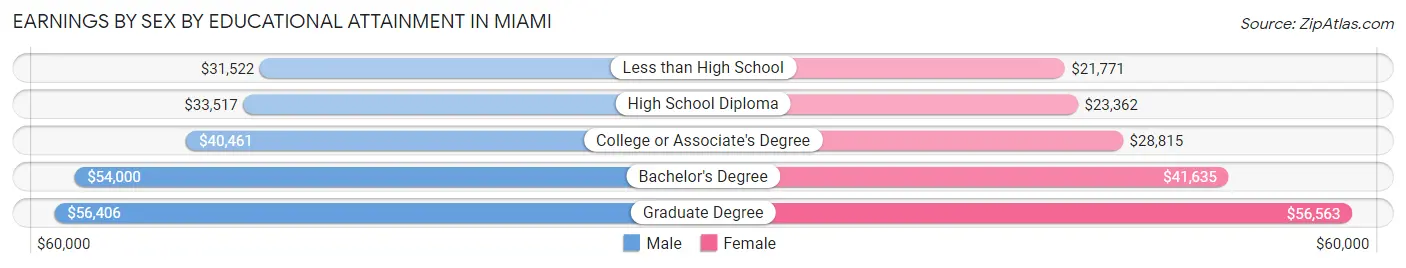
Earnings by Sex by Educational Attainment in Miami
Average earnings in Miami are $39,156 for men and $29,280 for women, a difference of 25.2%. Men with an educational attainment of graduate degree enjoy the highest average annual earnings of $56,406, while those with less than high school education earn the least with $31,522. Women with an educational attainment of graduate degree earn the most with the average annual earnings of $56,563, while those with less than high school education have the smallest earnings of $21,771.
| Educational Attainment | Male Income | Female Income |
| Less than High School | $31,522 | $21,771 |
| High School Diploma | $33,517 | $23,362 |
| College or Associate's Degree | $40,461 | $28,815 |
| Bachelor's Degree | $54,000 | $41,635 |
| Graduate Degree | $56,406 | $56,563 |
| Total | $39,156 | $29,280 |
Family Income in Miami
Family Income Brackets in Miami
According to the Miami family income data, there are 657 families falling into the $50,000 to $74,999 income range, which is the most common income bracket and makes up 22.0% of all families. Conversely, the $200,000+ income bracket is the least frequent group with only 48 families (1.6%) belonging to this category.
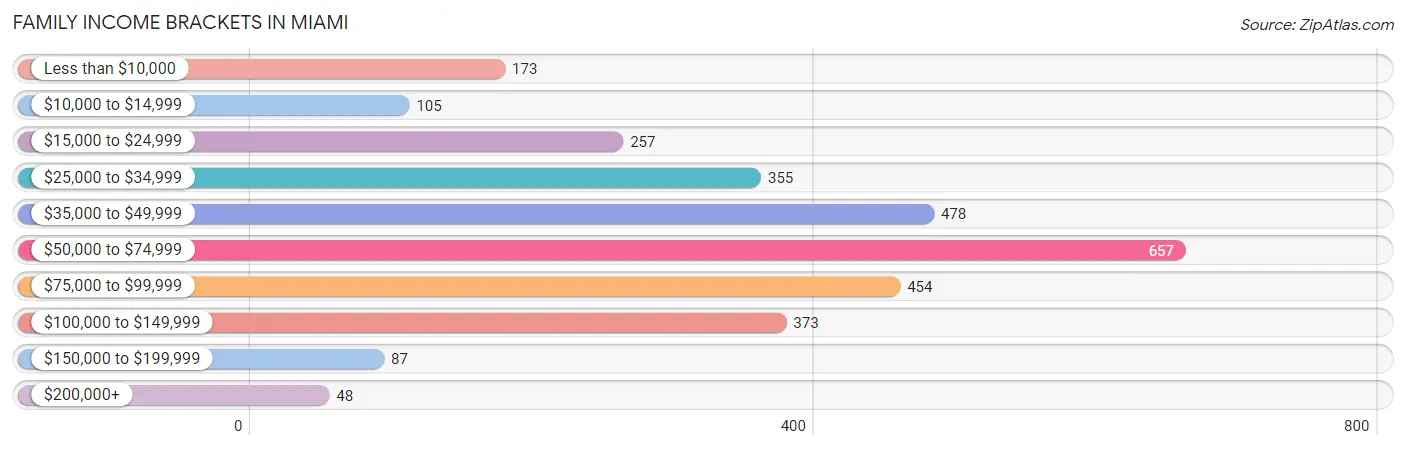
| Income Bracket | # Families | % Families |
| Less than $10,000 | 173 | 5.8% |
| $10,000 to $14,999 | 105 | 3.5% |
| $15,000 to $24,999 | 257 | 8.6% |
| $25,000 to $34,999 | 355 | 11.9% |
| $35,000 to $49,999 | 478 | 16.0% |
| $50,000 to $74,999 | 657 | 22.0% |
| $75,000 to $99,999 | 454 | 15.2% |
| $100,000 to $149,999 | 373 | 12.5% |
| $150,000 to $199,999 | 87 | 2.9% |
| $200,000+ | 48 | 1.6% |
Family Income by Famaliy Size in Miami
6-person families (91 | 3.0%) account for the highest median family income in Miami with $65,795 per family, while 2-person families (1,456 | 48.7%) have the highest median income of $25,968 per family member.
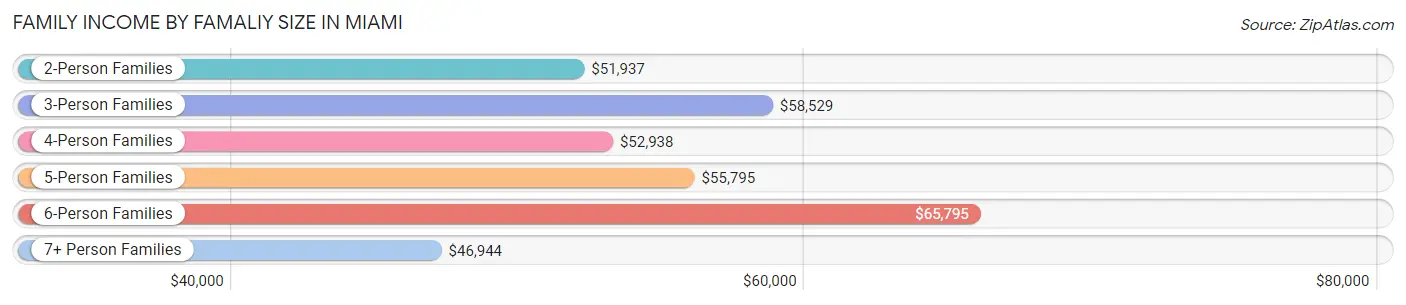
| Income Bracket | # Families | Median Income |
| 2-Person Families | 1,456 (48.7%) | $51,937 |
| 3-Person Families | 700 (23.4%) | $58,529 |
| 4-Person Families | 467 (15.6%) | $52,938 |
| 5-Person Families | 221 (7.4%) | $55,795 |
| 6-Person Families | 91 (3.0%) | $65,795 |
| 7+ Person Families | 52 (1.7%) | $46,944 |
| Total | 2,987 (100.0%) | $53,338 |
Family Income by Number of Earners in Miami
The median family income in Miami is $53,338, with families comprising 3+ earners (175) having the highest median family income of $94,886, while families with no earners (586) have the lowest median family income of $33,269, accounting for 5.9% and 19.6% of families, respectively.
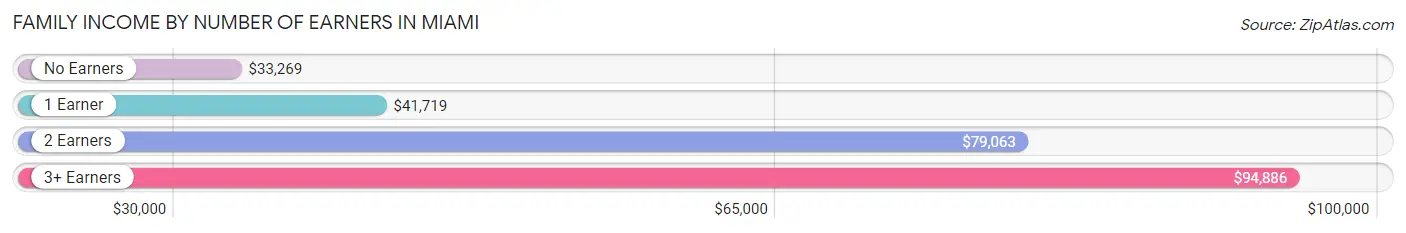
| Number of Earners | # Families | Median Income |
| No Earners | 586 (19.6%) | $33,269 |
| 1 Earner | 1,160 (38.8%) | $41,719 |
| 2 Earners | 1,066 (35.7%) | $79,063 |
| 3+ Earners | 175 (5.9%) | $94,886 |
| Total | 2,987 (100.0%) | $53,338 |
Household Income in Miami
Household Income Brackets in Miami
With 940 households falling in the category, the $50,000 to $74,999 income range is the most frequent in Miami, accounting for 19.3% of all households. In contrast, only 73 households (1.5%) fall into the $200,000+ income bracket, making it the least populous group.
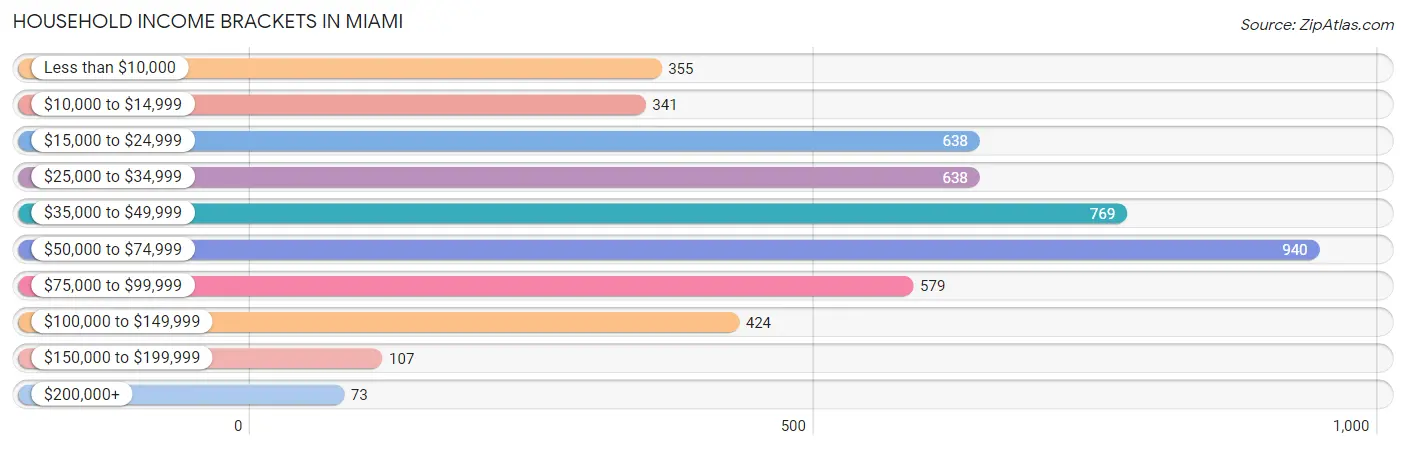
| Income Bracket | # Households | % Households |
| Less than $10,000 | 355 | 7.3% |
| $10,000 to $14,999 | 341 | 7.0% |
| $15,000 to $24,999 | 638 | 13.1% |
| $25,000 to $34,999 | 638 | 13.1% |
| $35,000 to $49,999 | 769 | 15.8% |
| $50,000 to $74,999 | 940 | 19.3% |
| $75,000 to $99,999 | 579 | 11.9% |
| $100,000 to $149,999 | 424 | 8.7% |
| $150,000 to $199,999 | 107 | 2.2% |
| $200,000+ | 73 | 1.5% |
Household Income by Householder Age in Miami
The median household income in Miami is $44,010, with the highest median household income of $52,473 found in the 45 to 64 years age bracket for the primary householder. A total of 1,601 households (32.9%) fall into this category. Meanwhile, the 65+ years age bracket for the primary householder has the lowest median household income of $33,859, with 1,302 households (26.8%) in this group.
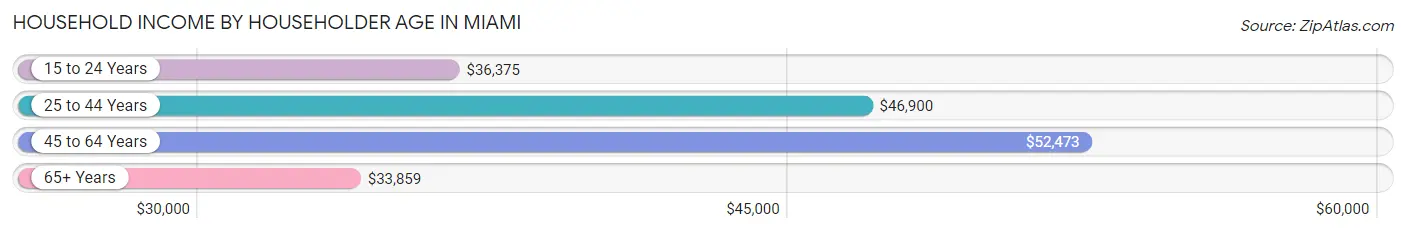
| Income Bracket | # Households | Median Income |
| 15 to 24 Years | 325 (6.7%) | $36,375 |
| 25 to 44 Years | 1,640 (33.7%) | $46,900 |
| 45 to 64 Years | 1,601 (32.9%) | $52,473 |
| 65+ Years | 1,302 (26.8%) | $33,859 |
| Total | 4,868 (100.0%) | $44,010 |
Poverty in Miami
Income Below Poverty by Sex and Age in Miami
With 20.6% poverty level for males and 24.9% for females among the residents of Miami, 6 to 11 year old males and under 5 year old females are the most vulnerable to poverty, with 200 males (35.4%) and 184 females (40.5%) in their respective age groups living below the poverty level.
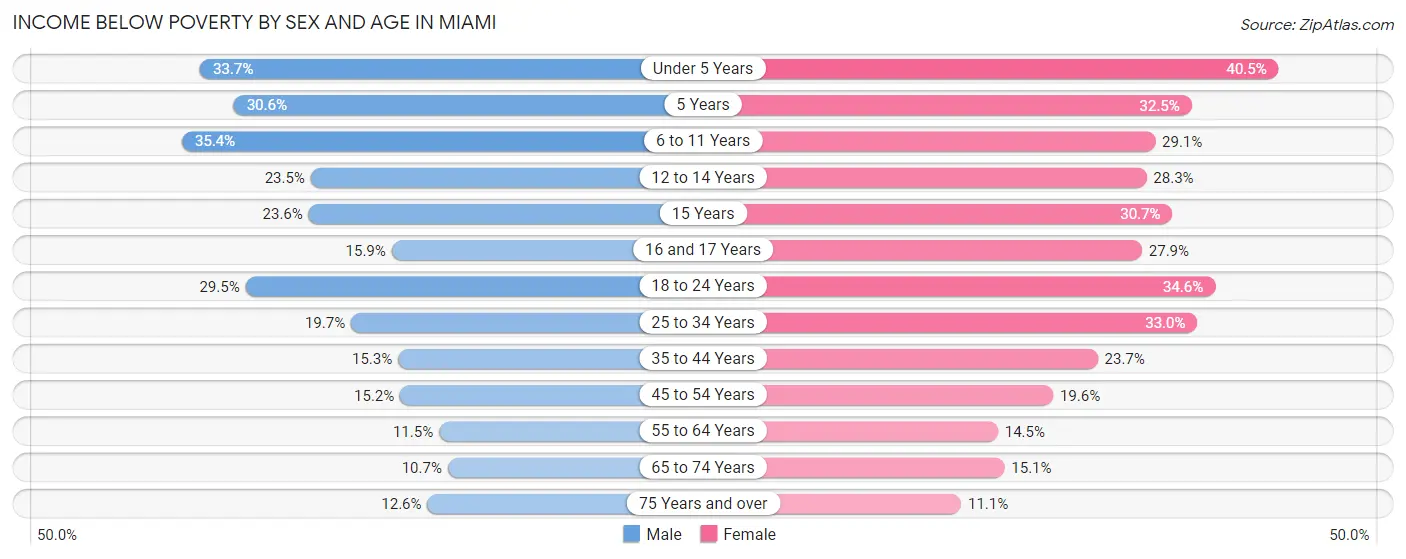
| Age Bracket | Male | Female |
| Under 5 Years | 174 (33.7%) | 184 (40.5%) |
| 5 Years | 26 (30.6%) | 37 (32.5%) |
| 6 to 11 Years | 200 (35.4%) | 164 (29.1%) |
| 12 to 14 Years | 72 (23.4%) | 54 (28.3%) |
| 15 Years | 13 (23.6%) | 27 (30.7%) |
| 16 and 17 Years | 22 (15.9%) | 44 (27.9%) |
| 18 to 24 Years | 172 (29.5%) | 194 (34.6%) |
| 25 to 34 Years | 175 (19.7%) | 287 (33.0%) |
| 35 to 44 Years | 96 (15.3%) | 155 (23.7%) |
| 45 to 54 Years | 95 (15.1%) | 126 (19.6%) |
| 55 to 64 Years | 84 (11.5%) | 107 (14.5%) |
| 65 to 74 Years | 50 (10.7%) | 86 (15.1%) |
| 75 Years and over | 41 (12.6%) | 55 (11.1%) |
| Total | 1,220 (20.6%) | 1,520 (24.9%) |
Income Above Poverty by Sex and Age in Miami
According to the poverty statistics in Miami, males aged 65 to 74 years and females aged 75 years and over are the age groups that are most secure financially, with 89.3% of males and 88.9% of females in these age groups living above the poverty line.
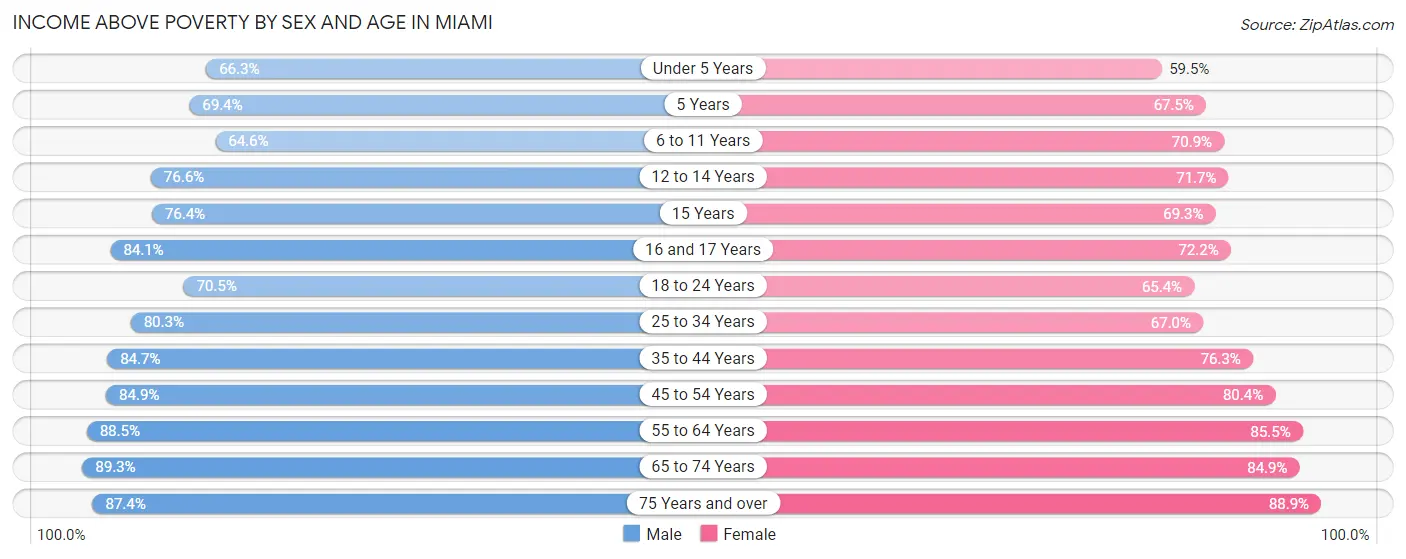
| Age Bracket | Male | Female |
| Under 5 Years | 342 (66.3%) | 270 (59.5%) |
| 5 Years | 59 (69.4%) | 77 (67.5%) |
| 6 to 11 Years | 365 (64.6%) | 400 (70.9%) |
| 12 to 14 Years | 235 (76.5%) | 137 (71.7%) |
| 15 Years | 42 (76.4%) | 61 (69.3%) |
| 16 and 17 Years | 116 (84.1%) | 114 (72.2%) |
| 18 to 24 Years | 411 (70.5%) | 366 (65.4%) |
| 25 to 34 Years | 713 (80.3%) | 583 (67.0%) |
| 35 to 44 Years | 530 (84.7%) | 498 (76.3%) |
| 45 to 54 Years | 532 (84.9%) | 517 (80.4%) |
| 55 to 64 Years | 644 (88.5%) | 632 (85.5%) |
| 65 to 74 Years | 416 (89.3%) | 484 (84.9%) |
| 75 Years and over | 284 (87.4%) | 442 (88.9%) |
| Total | 4,689 (79.3%) | 4,581 (75.1%) |
Income Below Poverty Among Married-Couple Families in Miami
The poverty statistics for married-couple families in Miami show that 8.3% or 156 of the total 1,875 families live below the poverty line. Families with 3 or 4 children have the highest poverty rate of 26.6%, comprising of 41 families. On the other hand, families with no children have the lowest poverty rate of 3.1%, which includes 34 families.
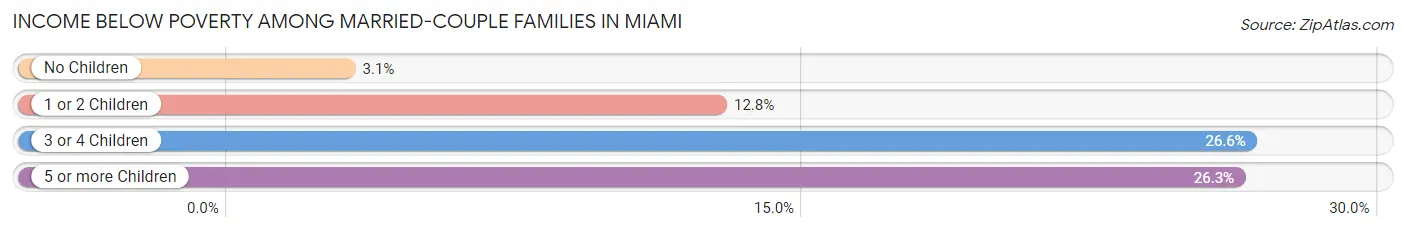
| Children | Above Poverty | Below Poverty |
| No Children | 1,073 (96.9%) | 34 (3.1%) |
| 1 or 2 Children | 519 (87.2%) | 76 (12.8%) |
| 3 or 4 Children | 113 (73.4%) | 41 (26.6%) |
| 5 or more Children | 14 (73.7%) | 5 (26.3%) |
| Total | 1,719 (91.7%) | 156 (8.3%) |
Income Below Poverty Among Single-Parent Households in Miami
According to the poverty data in Miami, 19.8% or 78 single-father households and 40.7% or 292 single-mother households are living below the poverty line. Among single-father households, those with 1 or 2 children have the highest poverty rate, with 58 households (29.1%) experiencing poverty. Likewise, among single-mother households, those with 5 or more children have the highest poverty rate, with 20 households (100.0%) falling below the poverty line.
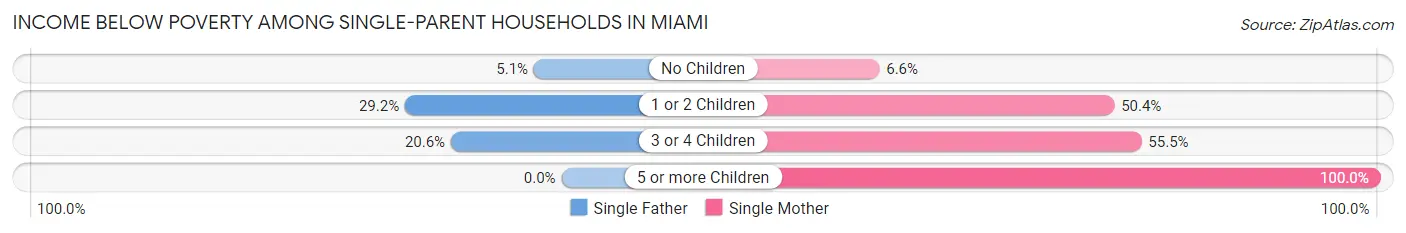
| Children | Single Father | Single Mother |
| No Children | 6 (5.1%) | 13 (6.6%) |
| 1 or 2 Children | 58 (29.1%) | 193 (50.4%) |
| 3 or 4 Children | 14 (20.6%) | 66 (55.5%) |
| 5 or more Children | 0 (0.0%) | 20 (100.0%) |
| Total | 78 (19.8%) | 292 (40.7%) |
Income Below Poverty Among Married-Couple vs Single-Parent Households in Miami
The poverty data for Miami shows that 156 of the married-couple family households (8.3%) and 370 of the single-parent households (33.3%) are living below the poverty level. Within the married-couple family households, those with 3 or 4 children have the highest poverty rate, with 41 households (26.6%) falling below the poverty line. Among the single-parent households, those with 5 or more children have the highest poverty rate, with 20 household (66.7%) living below poverty.
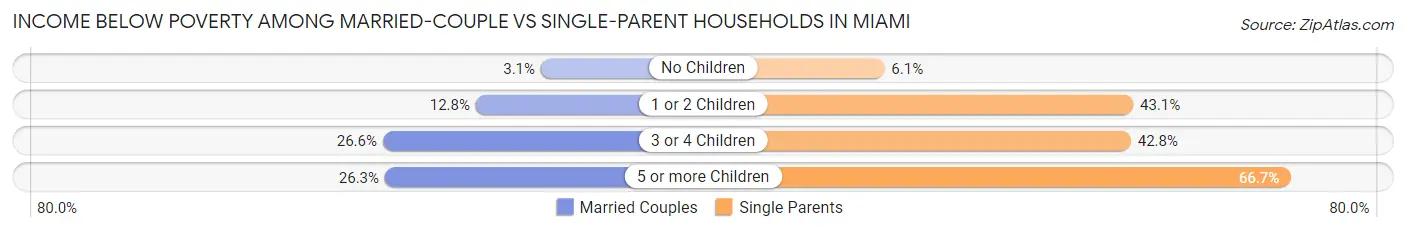
| Children | Married-Couple Families | Single-Parent Households |
| No Children | 34 (3.1%) | 19 (6.1%) |
| 1 or 2 Children | 76 (12.8%) | 251 (43.1%) |
| 3 or 4 Children | 41 (26.6%) | 80 (42.8%) |
| 5 or more Children | 5 (26.3%) | 20 (66.7%) |
| Total | 156 (8.3%) | 370 (33.3%) |
Race in Miami
The most populous races in Miami are White / Caucasian (8,295 | 63.8%), Native / Alaskan (2,440 | 18.8%), and Two or more Races (1,365 | 10.5%).
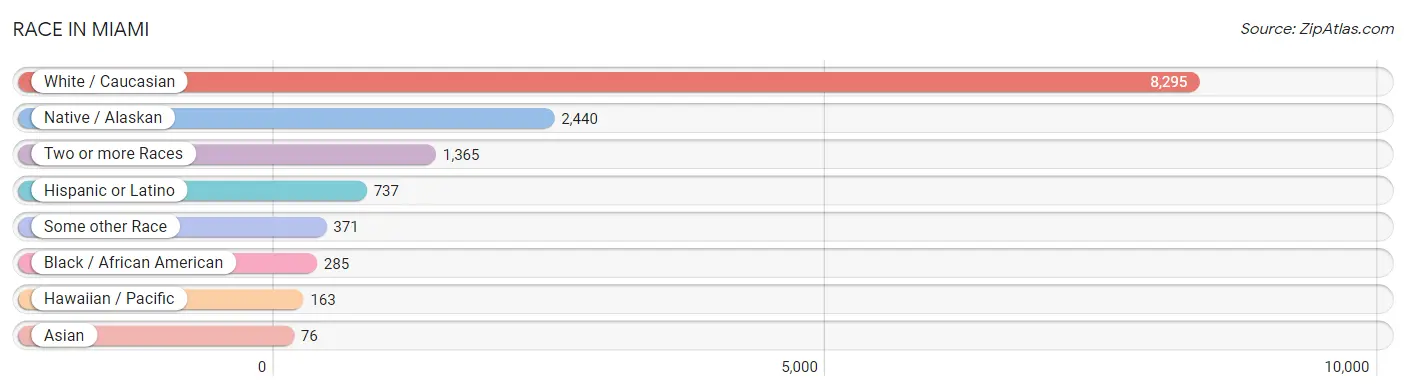
| Race | # Population | % Population |
| Asian | 76 | 0.6% |
| Black / African American | 285 | 2.2% |
| Hawaiian / Pacific | 163 | 1.3% |
| Hispanic or Latino | 737 | 5.7% |
| Native / Alaskan | 2,440 | 18.8% |
| White / Caucasian | 8,295 | 63.8% |
| Two or more Races | 1,365 | 10.5% |
| Some other Race | 371 | 2.9% |
| Total | 12,995 | 100.0% |
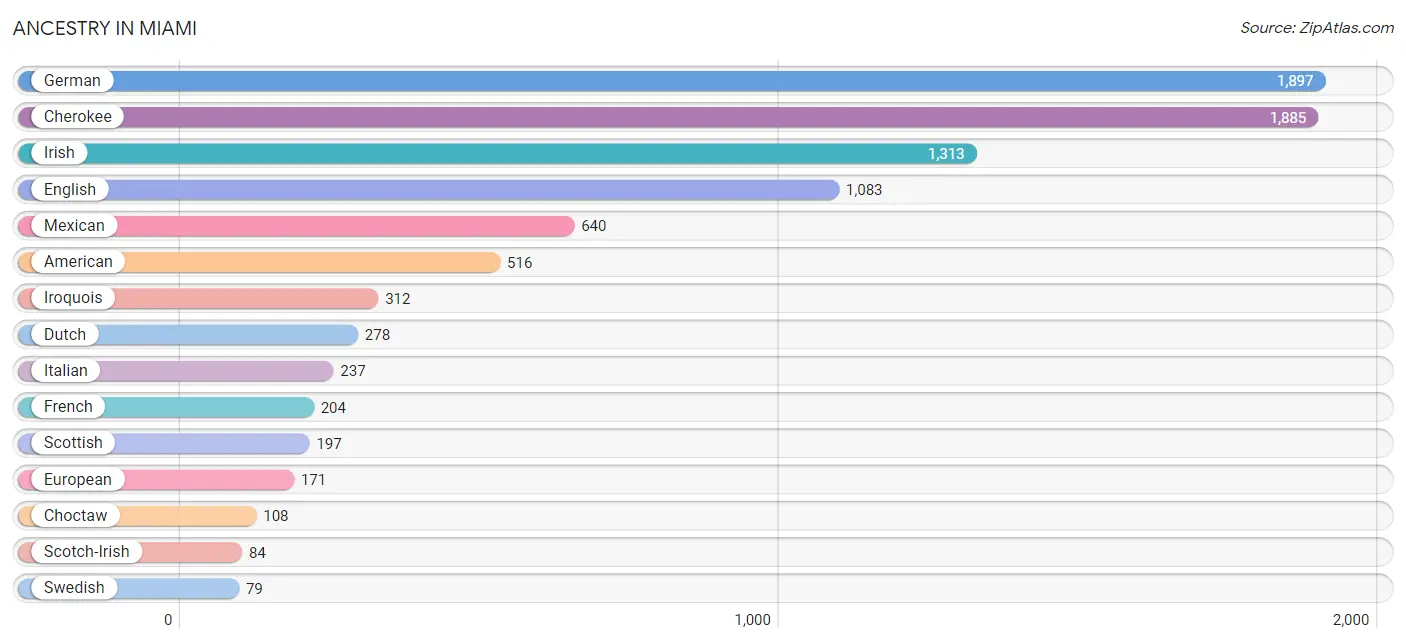
Ancestry in Miami
The most populous ancestries reported in Miami are German (1,897 | 14.6%), Cherokee (1,885 | 14.5%), Irish (1,313 | 10.1%), English (1,083 | 8.3%), and Mexican (640 | 4.9%), together accounting for 52.5% of all Miami residents.
| Ancestry | # Population | % Population |
| African | 16 | 0.1% |
| American | 516 | 4.0% |
| Apache | 9 | 0.1% |
| Arab | 6 | 0.1% |
| Arapaho | 4 | 0.0% |
| Austrian | 10 | 0.1% |
| Bangladeshi | 13 | 0.1% |
| Bhutanese | 19 | 0.2% |
| Blackfeet | 13 | 0.1% |
| British | 21 | 0.2% |
| Bulgarian | 3 | 0.0% |
| Burmese | 26 | 0.2% |
| Canadian | 22 | 0.2% |
| Central American | 29 | 0.2% |
| Cherokee | 1,885 | 14.5% |
| Chickasaw | 20 | 0.2% |
| Chippewa | 5 | 0.0% |
| Choctaw | 108 | 0.8% |
| Comanche | 13 | 0.1% |
| Creek | 50 | 0.4% |
| Croatian | 10 | 0.1% |
| Czech | 7 | 0.1% |
| Czechoslovakian | 13 | 0.1% |
| Danish | 19 | 0.2% |
| Delaware | 23 | 0.2% |
| Dutch | 278 | 2.1% |
| Dutch West Indian | 20 | 0.2% |
| Eastern European | 11 | 0.1% |
| Ecuadorian | 9 | 0.1% |
| English | 1,083 | 8.3% |
| European | 171 | 1.3% |
| Finnish | 5 | 0.0% |
| French | 204 | 1.6% |
| French American Indian | 3 | 0.0% |
| French Canadian | 11 | 0.1% |
| German | 1,897 | 14.6% |
| Ghanaian | 1 | 0.0% |
| Guamanian / Chamorro | 2 | 0.0% |
| Guatemalan | 26 | 0.2% |
| Honduran | 3 | 0.0% |
| Hungarian | 18 | 0.1% |
| Indian (Asian) | 27 | 0.2% |
| Irish | 1,313 | 10.1% |
| Iroquois | 312 | 2.4% |
| Italian | 237 | 1.8% |
| Jamaican | 4 | 0.0% |
| Korean | 13 | 0.1% |
| Lithuanian | 5 | 0.0% |
| Malaysian | 1 | 0.0% |
| Mexican | 640 | 4.9% |
| Mexican American Indian | 7 | 0.1% |
| Moroccan | 4 | 0.0% |
| Native Hawaiian | 20 | 0.2% |
| Navajo | 20 | 0.2% |
| Nigerian | 7 | 0.1% |
| Northern European | 3 | 0.0% |
| Norwegian | 73 | 0.6% |
| Osage | 43 | 0.3% |
| Ottawa | 76 | 0.6% |
| Paraguayan | 8 | 0.1% |
| Pennsylvania German | 2 | 0.0% |
| Polish | 61 | 0.5% |
| Portuguese | 5 | 0.0% |
| Potawatomi | 20 | 0.2% |
| Pueblo | 3 | 0.0% |
| Puerto Rican | 12 | 0.1% |
| Romanian | 6 | 0.1% |
| Russian | 9 | 0.1% |
| Scandinavian | 58 | 0.4% |
| Scotch-Irish | 84 | 0.6% |
| Scottish | 197 | 1.5% |
| Seminole | 33 | 0.3% |
| Senegalese | 9 | 0.1% |
| Sioux | 15 | 0.1% |
| Slavic | 7 | 0.1% |
| South American | 25 | 0.2% |
| South American Indian | 8 | 0.1% |
| Spaniard | 15 | 0.1% |
| Spanish | 3 | 0.0% |
| Sri Lankan | 17 | 0.1% |
| Subsaharan African | 33 | 0.3% |
| Swedish | 79 | 0.6% |
| Swiss | 11 | 0.1% |
| Thai | 7 | 0.1% |
| Venezuelan | 8 | 0.1% |
| Welsh | 25 | 0.2% |
| Yugoslavian | 4 | 0.0% | View All 87 Rows |
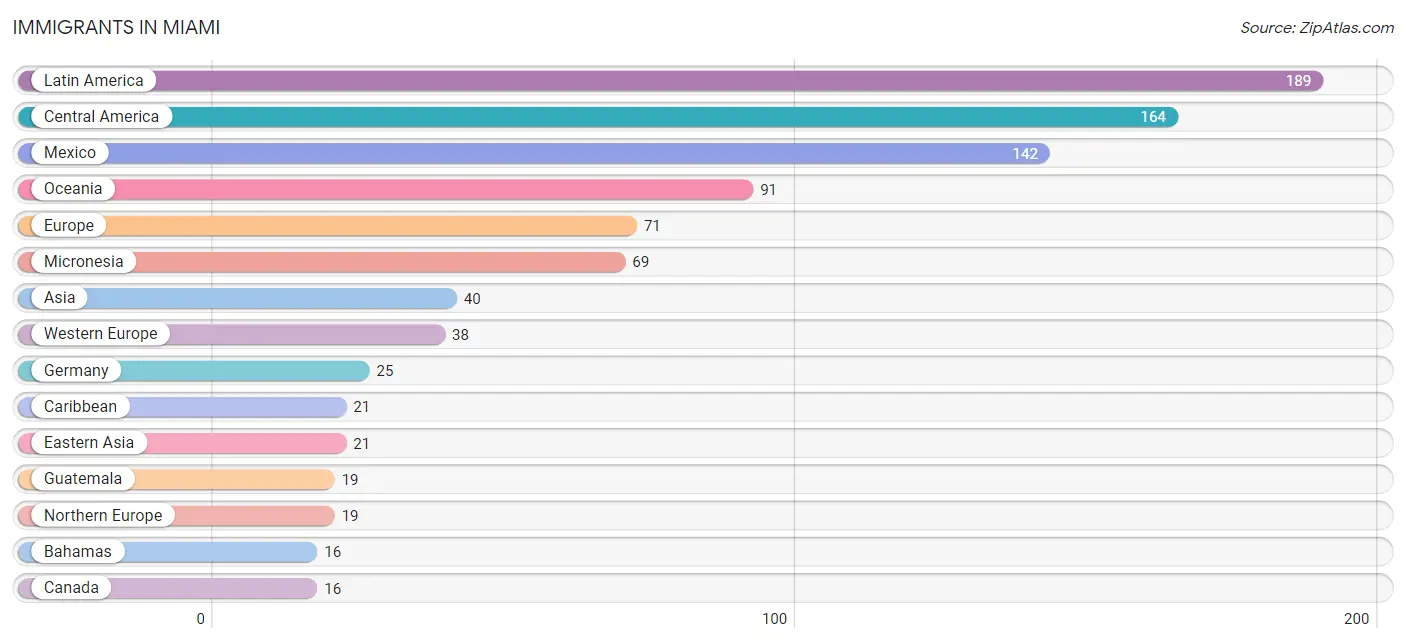
Immigrants in Miami
The most numerous immigrant groups reported in Miami came from Latin America (189 | 1.5%), Central America (164 | 1.3%), Mexico (142 | 1.1%), Oceania (91 | 0.7%), and Europe (71 | 0.5%), together accounting for 5.0% of all Miami residents.
| Immigration Origin | # Population | % Population |
| Africa | 14 | 0.1% |
| Asia | 40 | 0.3% |
| Bahamas | 16 | 0.1% |
| Bangladesh | 2 | 0.0% |
| Belgium | 13 | 0.1% |
| Canada | 16 | 0.1% |
| Caribbean | 21 | 0.2% |
| Central America | 164 | 1.3% |
| China | 8 | 0.1% |
| Croatia | 10 | 0.1% |
| Denmark | 8 | 0.1% |
| Eastern Africa | 4 | 0.0% |
| Eastern Asia | 21 | 0.2% |
| Eastern Europe | 10 | 0.1% |
| England | 6 | 0.1% |
| Europe | 71 | 0.5% |
| Germany | 25 | 0.2% |
| Ghana | 1 | 0.0% |
| Guatemala | 19 | 0.2% |
| Honduras | 3 | 0.0% |
| Iraq | 2 | 0.0% |
| Jamaica | 2 | 0.0% |
| Korea | 13 | 0.1% |
| Laos | 1 | 0.0% |
| Latin America | 189 | 1.5% |
| Mexico | 142 | 1.1% |
| Micronesia | 69 | 0.5% |
| Morocco | 4 | 0.0% |
| Northern Africa | 4 | 0.0% |
| Northern Europe | 19 | 0.2% |
| Oceania | 91 | 0.7% |
| Philippines | 6 | 0.1% |
| South Africa | 5 | 0.0% |
| South America | 4 | 0.0% |
| South Central Asia | 2 | 0.0% |
| South Eastern Asia | 15 | 0.1% |
| Southern Europe | 4 | 0.0% |
| Spain | 4 | 0.0% |
| Trinidad and Tobago | 3 | 0.0% |
| Venezuela | 4 | 0.0% |
| Vietnam | 8 | 0.1% |
| Western Africa | 1 | 0.0% |
| Western Asia | 2 | 0.0% |
| Western Europe | 38 | 0.3% | View All 44 Rows |
Sex and Age in Miami
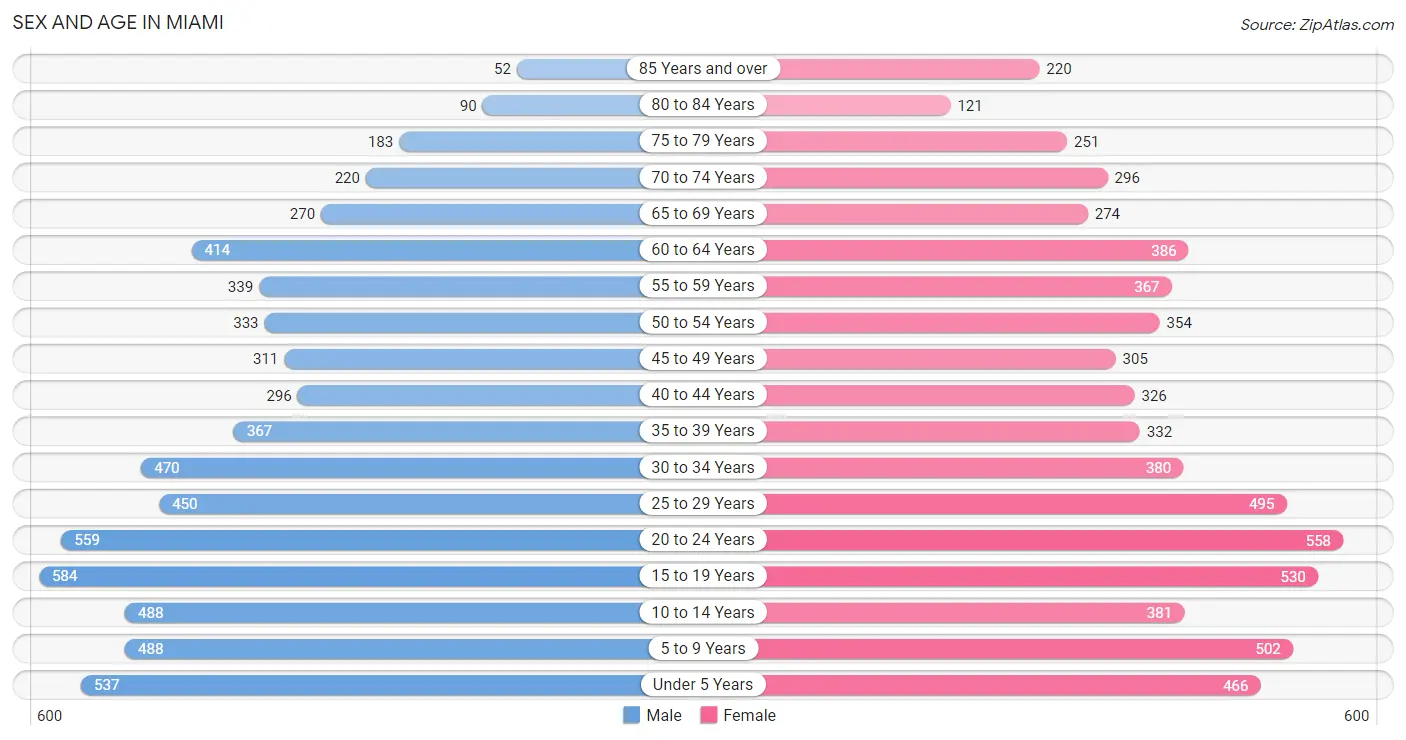
Sex and Age in Miami
The most populous age groups in Miami are 15 to 19 Years (584 | 9.0%) for men and 20 to 24 Years (558 | 8.5%) for women.
| Age Bracket | Male | Female |
| Under 5 Years | 537 (8.3%) | 466 (7.1%) |
| 5 to 9 Years | 488 (7.6%) | 502 (7.7%) |
| 10 to 14 Years | 488 (7.6%) | 381 (5.8%) |
| 15 to 19 Years | 584 (9.0%) | 530 (8.1%) |
| 20 to 24 Years | 559 (8.7%) | 558 (8.5%) |
| 25 to 29 Years | 450 (7.0%) | 495 (7.6%) |
| 30 to 34 Years | 470 (7.3%) | 380 (5.8%) |
| 35 to 39 Years | 367 (5.7%) | 332 (5.1%) |
| 40 to 44 Years | 296 (4.6%) | 326 (5.0%) |
| 45 to 49 Years | 311 (4.8%) | 305 (4.7%) |
| 50 to 54 Years | 333 (5.2%) | 354 (5.4%) |
| 55 to 59 Years | 339 (5.2%) | 367 (5.6%) |
| 60 to 64 Years | 414 (6.4%) | 386 (5.9%) |
| 65 to 69 Years | 270 (4.2%) | 274 (4.2%) |
| 70 to 74 Years | 220 (3.4%) | 296 (4.5%) |
| 75 to 79 Years | 183 (2.8%) | 251 (3.8%) |
| 80 to 84 Years | 90 (1.4%) | 121 (1.8%) |
| 85 Years and over | 52 (0.8%) | 220 (3.4%) |
| Total | 6,451 (100.0%) | 6,544 (100.0%) |
Families and Households in Miami
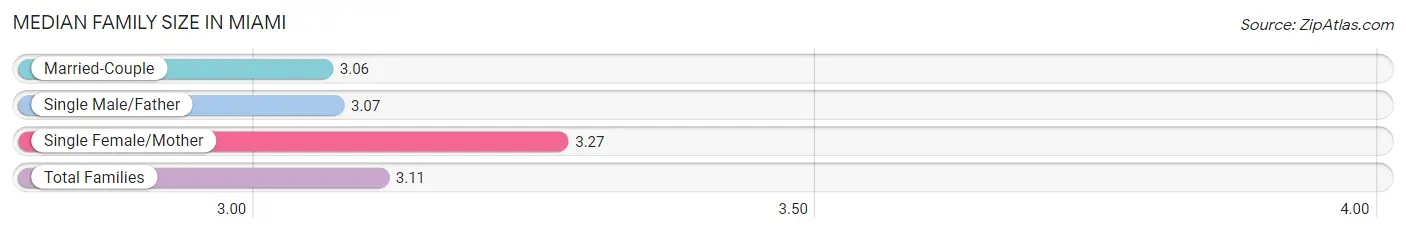
Median Family Size in Miami
The median family size in Miami is 3.11 persons per family, with single female/mother families (718 | 24.0%) accounting for the largest median family size of 3.27 persons per family. On the other hand, married-couple families (1,875 | 62.8%) represent the smallest median family size with 3.06 persons per family.
| Family Type | # Families | Family Size |
| Married-Couple | 1,875 (62.8%) | 3.06 |
| Single Male/Father | 394 (13.2%) | 3.07 |
| Single Female/Mother | 718 (24.0%) | 3.27 |
| Total Families | 2,987 (100.0%) | 3.11 |
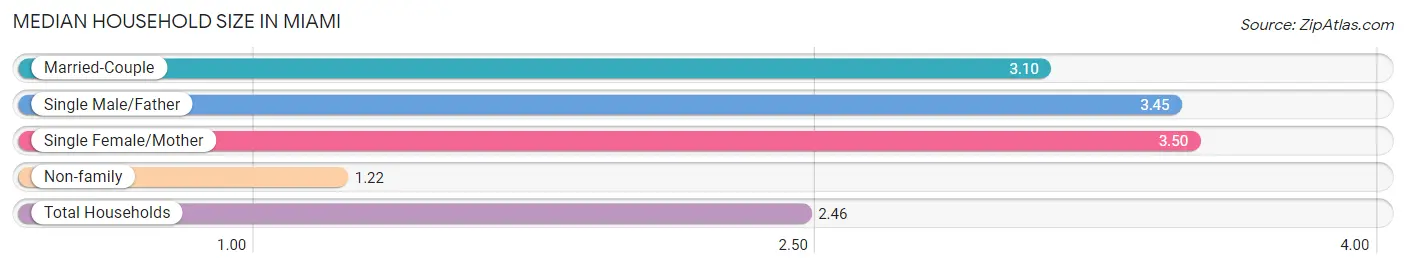
Median Household Size in Miami
The median household size in Miami is 2.46 persons per household, with single female/mother households (718 | 14.7%) accounting for the largest median household size of 3.5 persons per household. non-family households (1,881 | 38.6%) represent the smallest median household size with 1.22 persons per household.
| Household Type | # Households | Household Size |
| Married-Couple | 1,875 (38.5%) | 3.10 |
| Single Male/Father | 394 (8.1%) | 3.45 |
| Single Female/Mother | 718 (14.7%) | 3.50 |
| Non-family | 1,881 (38.6%) | 1.22 |
| Total Households | 4,868 (100.0%) | 2.46 |
Household Size by Marriage Status in Miami
Out of a total of 4,868 households in Miami, 2,987 (61.4%) are family households, while 1,881 (38.6%) are nonfamily households. The most numerous type of family households are 2-person households, comprising 1,321, and the most common type of nonfamily households are 1-person households, comprising 1,553.
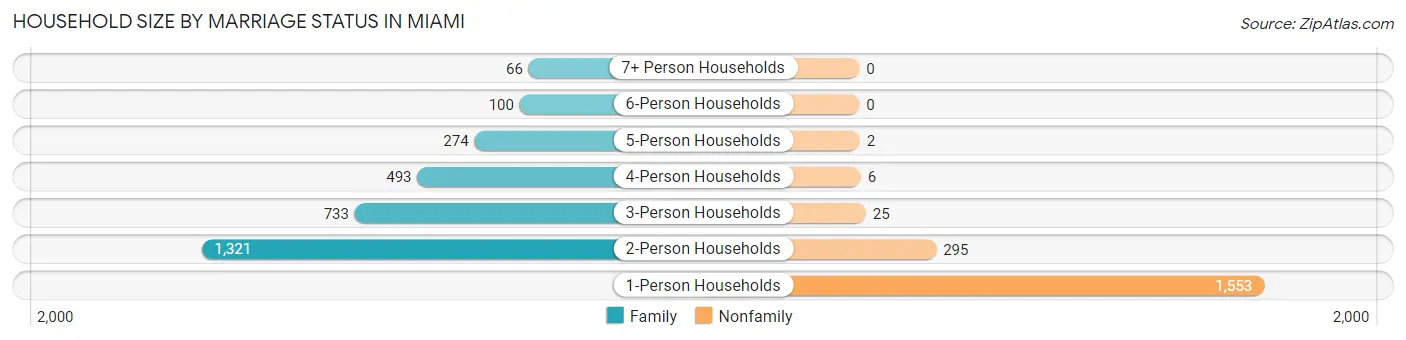
| Household Size | Family Households | Nonfamily Households |
| 1-Person Households | - | 1,553 (31.9%) |
| 2-Person Households | 1,321 (27.1%) | 295 (6.1%) |
| 3-Person Households | 733 (15.1%) | 25 (0.5%) |
| 4-Person Households | 493 (10.1%) | 6 (0.1%) |
| 5-Person Households | 274 (5.6%) | 2 (0.0%) |
| 6-Person Households | 100 (2.1%) | 0 (0.0%) |
| 7+ Person Households | 66 (1.4%) | 0 (0.0%) |
| Total | 2,987 (61.4%) | 1,881 (38.6%) |
Female Fertility in Miami
Fertility by Age in Miami
Average fertility rate in Miami is 67.0 births per 1,000 women. Women in the age bracket of 20 to 34 years have the highest fertility rate with 112.0 births per 1,000 women. Women in the age bracket of 20 to 34 years acount for 80.1% of all women with births.
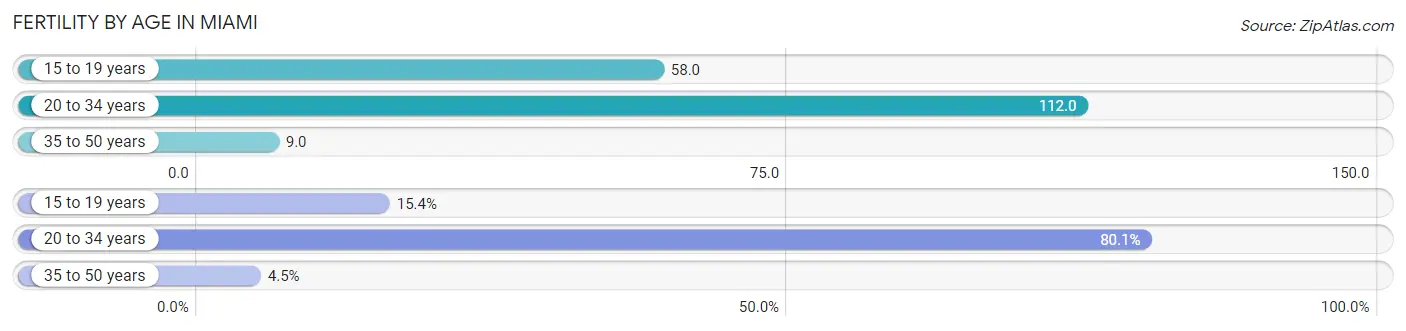
| Age Bracket | Women with Births | Births / 1,000 Women |
| 15 to 19 years | 31 (15.4%) | 58.0 |
| 20 to 34 years | 161 (80.1%) | 112.0 |
| 35 to 50 years | 9 (4.5%) | 9.0 |
| Total | 201 (100.0%) | 67.0 |
Fertility by Age by Marriage Status in Miami
52.7% of women with births (201) in Miami are married. The highest percentage of unmarried women with births falls into 15 to 19 years age bracket with 74.2% of them unmarried at the time of birth, while the lowest percentage of unmarried women with births belong to 35 to 50 years age bracket with 22.2% of them unmarried.
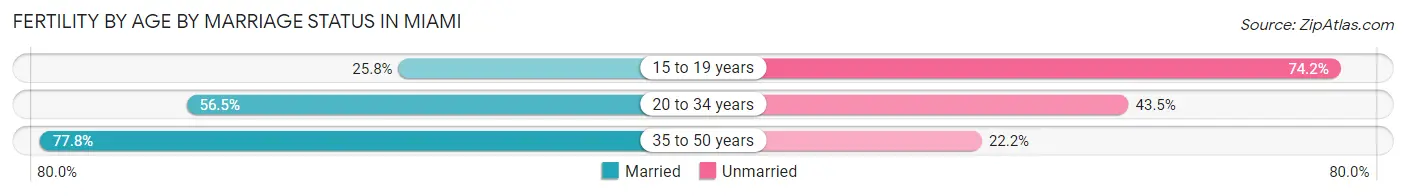
| Age Bracket | Married | Unmarried |
| 15 to 19 years | 8 (25.8%) | 23 (74.2%) |
| 20 to 34 years | 91 (56.5%) | 70 (43.5%) |
| 35 to 50 years | 7 (77.8%) | 2 (22.2%) |
| Total | 106 (52.7%) | 95 (47.3%) |
Fertility by Education in Miami
Average fertility rate in Miami is 67.0 births per 1,000 women. Women with the education attainment of high school diploma have the highest fertility rate of 109.0 births per 1,000 women, while women with the education attainment of graduate degree have the lowest fertility at 24.0 births per 1,000 women. Women with the education attainment of high school diploma represent 42.3% of all women with births.
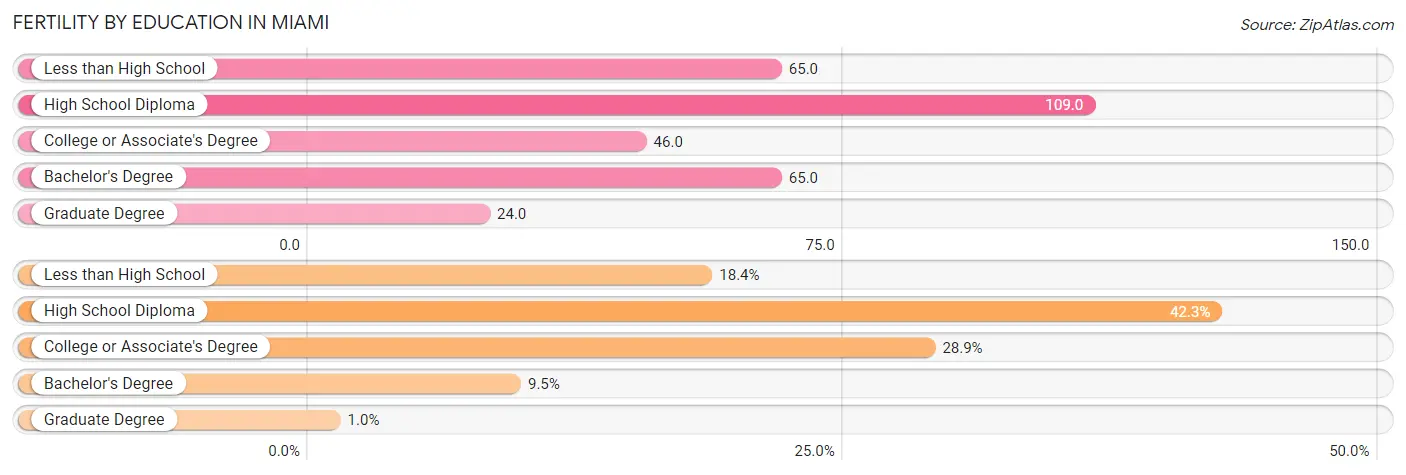
| Educational Attainment | Women with Births | Births / 1,000 Women |
| Less than High School | 37 (18.4%) | 65.0 |
| High School Diploma | 85 (42.3%) | 109.0 |
| College or Associate's Degree | 58 (28.9%) | 46.0 |
| Bachelor's Degree | 19 (9.5%) | 65.0 |
| Graduate Degree | 2 (1.0%) | 24.0 |
| Total | 201 (100.0%) | 67.0 |
Fertility by Education by Marriage Status in Miami
47.3% of women with births in Miami are unmarried. Women with the educational attainment of bachelor's degree are most likely to be married with 100.0% of them married at childbirth, while women with the educational attainment of less than high school are least likely to be married with 73.0% of them unmarried at childbirth.
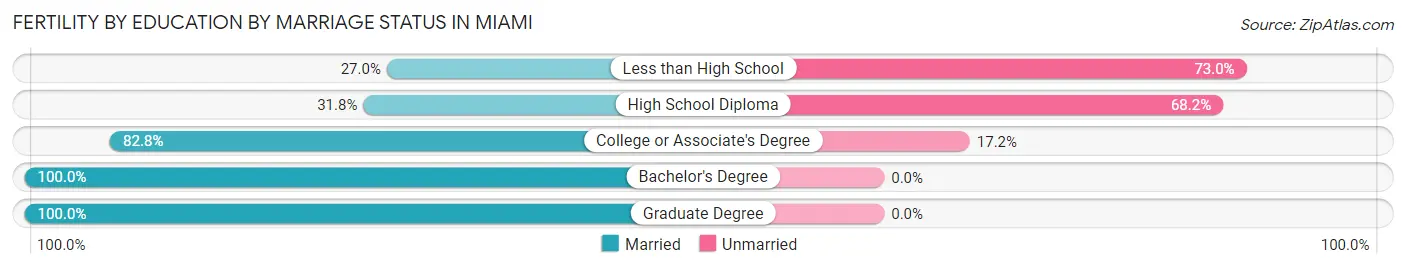
| Educational Attainment | Married | Unmarried |
| Less than High School | 10 (27.0%) | 27 (73.0%) |
| High School Diploma | 27 (31.8%) | 58 (68.2%) |
| College or Associate's Degree | 48 (82.8%) | 10 (17.2%) |
| Bachelor's Degree | 19 (100.0%) | 0 (0.0%) |
| Graduate Degree | 2 (100.0%) | 0 (0.0%) |
| Total | 106 (52.7%) | 95 (47.3%) |
Employment Characteristics in Miami
Employment by Class of Employer in Miami
Among the 5,149 employed individuals in Miami, private company employees (3,293 | 63.9%), state government employees (450 | 8.7%), and not-for-profit organizations (407 | 7.9%) make up the most common classes of employment.
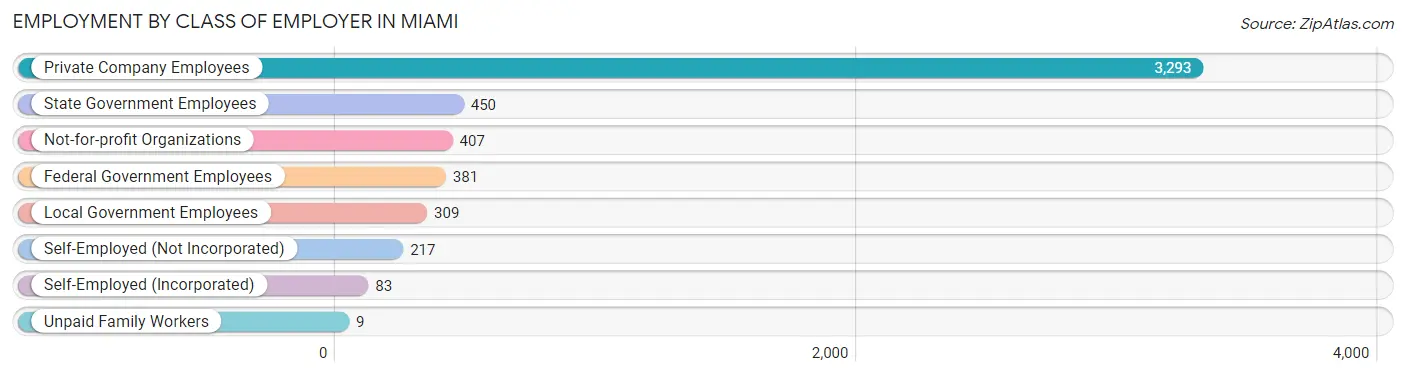
| Employer Class | # Employees | % Employees |
| Private Company Employees | 3,293 | 63.9% |
| Self-Employed (Incorporated) | 83 | 1.6% |
| Self-Employed (Not Incorporated) | 217 | 4.2% |
| Not-for-profit Organizations | 407 | 7.9% |
| Local Government Employees | 309 | 6.0% |
| State Government Employees | 450 | 8.7% |
| Federal Government Employees | 381 | 7.4% |
| Unpaid Family Workers | 9 | 0.2% |
| Total | 5,149 | 100.0% |
Employment Status by Age in Miami
According to the labor force statistics for Miami, out of the total population over 16 years of age (9,990), 54.3% or 5,425 individuals are in the labor force, with 3.3% or 179 of them unemployed. The age group with the highest labor force participation rate is 30 to 34 years, with 78.7% or 669 individuals in the labor force. Within the labor force, the 30 to 34 years age range has the highest percentage of unemployed individuals, with 6.3% or 42 of them being unemployed.
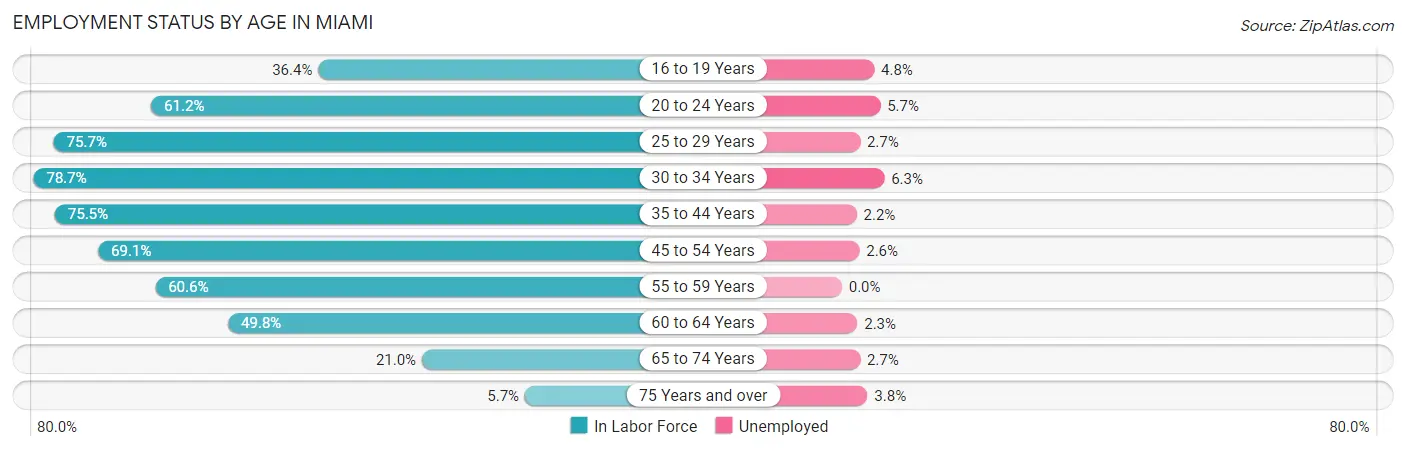
| Age Bracket | In Labor Force | Unemployed |
| 16 to 19 Years | 353 (36.4%) | 17 (4.8%) |
| 20 to 24 Years | 684 (61.2%) | 39 (5.7%) |
| 25 to 29 Years | 715 (75.7%) | 19 (2.7%) |
| 30 to 34 Years | 669 (78.7%) | 42 (6.3%) |
| 35 to 44 Years | 997 (75.5%) | 22 (2.2%) |
| 45 to 54 Years | 900 (69.1%) | 23 (2.6%) |
| 55 to 59 Years | 428 (60.6%) | 0 (0.0%) |
| 60 to 64 Years | 398 (49.8%) | 9 (2.3%) |
| 65 to 74 Years | 223 (21.0%) | 6 (2.7%) |
| 75 Years and over | 52 (5.7%) | 2 (3.8%) |
| Total | 5,425 (54.3%) | 179 (3.3%) |
Employment Status by Educational Attainment in Miami
According to labor force statistics for Miami, 69.4% of individuals (4,112) out of the total population between 25 and 64 years of age (5,925) are in the labor force, with 2.8% or 115 of them being unemployed. The group with the highest labor force participation rate are those with the educational attainment of bachelor's degree or higher, with 88.7% or 890 individuals in the labor force. Within the labor force, individuals with high school diploma education have the highest percentage of unemployment, with 4.6% or 59 of them being unemployed.
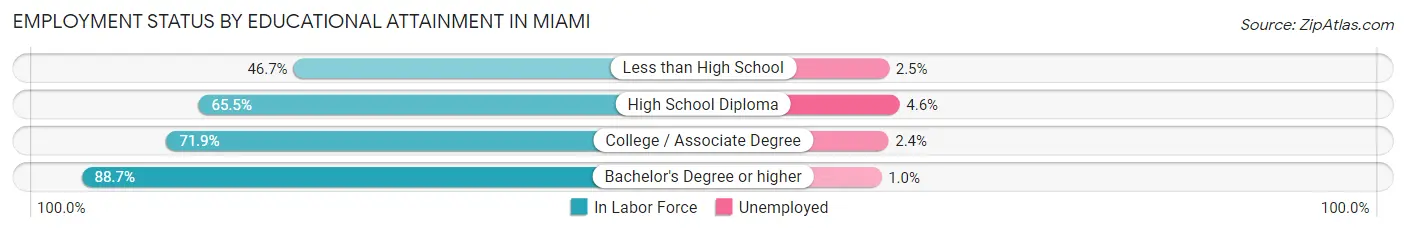
| Educational Attainment | In Labor Force | Unemployed |
| Less than High School | 359 (46.7%) | 19 (2.5%) |
| High School Diploma | 1,284 (65.5%) | 90 (4.6%) |
| College / Associate Degree | 1,577 (71.9%) | 53 (2.4%) |
| Bachelor's Degree or higher | 890 (88.7%) | 10 (1.0%) |
| Total | 4,112 (69.4%) | 166 (2.8%) |
Employment Occupations by Sex in Miami
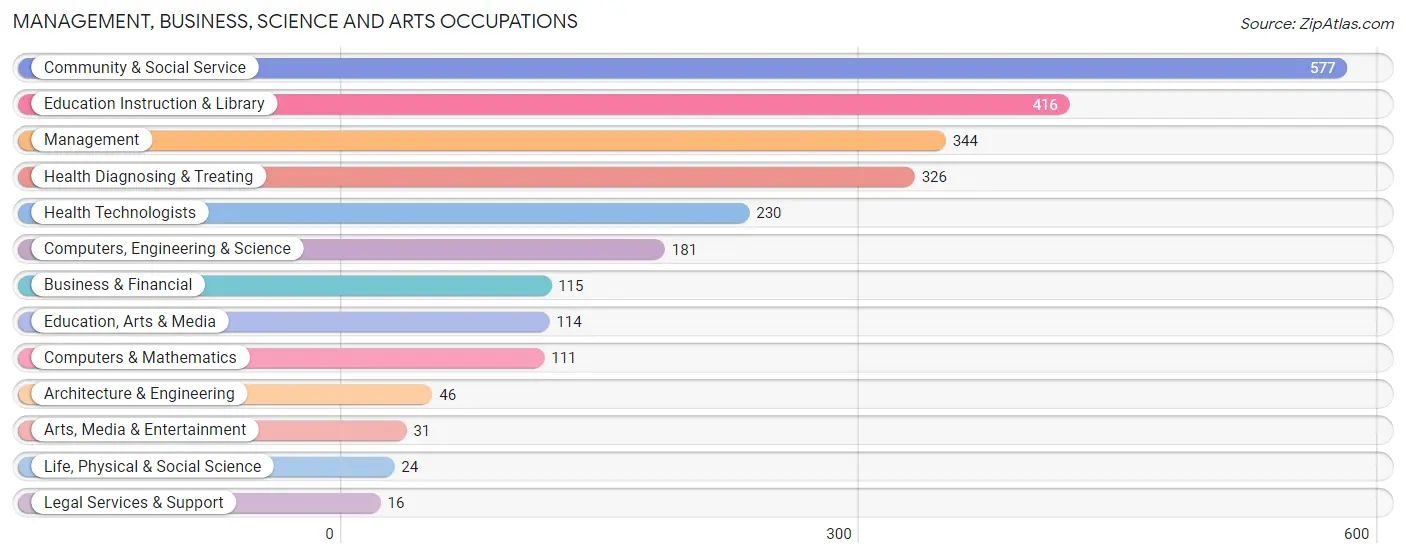
Management, Business, Science and Arts Occupations
The most common Management, Business, Science and Arts occupations in Miami are Community & Social Service (577 | 11.0%), Education Instruction & Library (416 | 7.9%), Management (344 | 6.6%), Health Diagnosing & Treating (326 | 6.2%), and Health Technologists (230 | 4.4%).
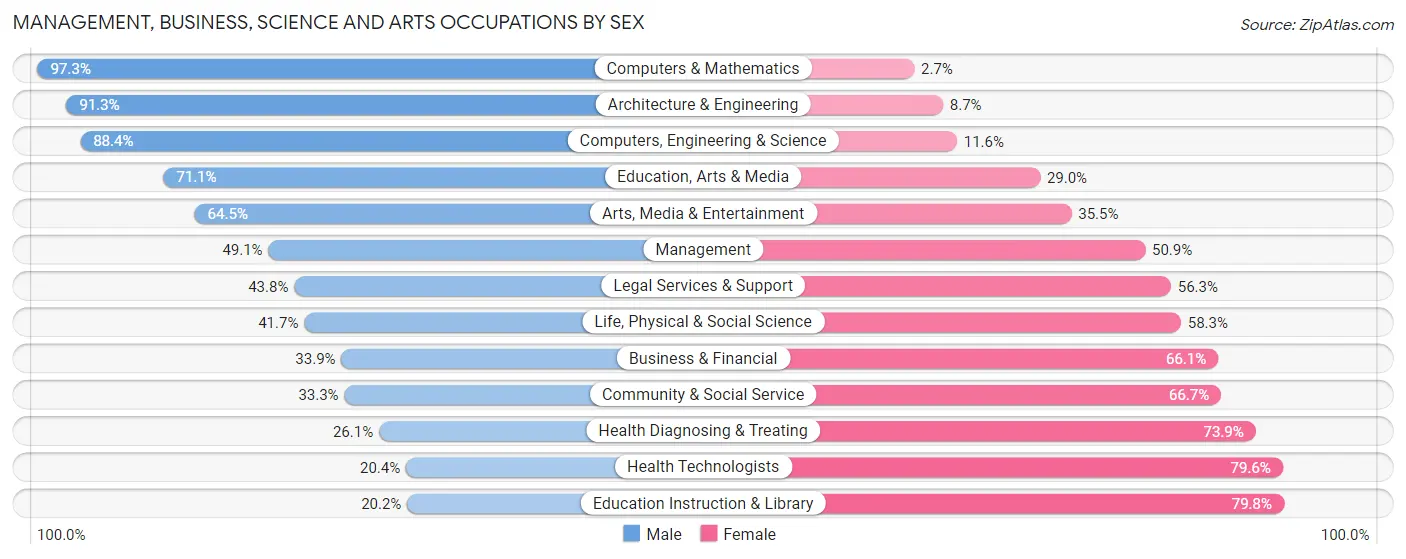
Management, Business, Science and Arts Occupations by Sex
Within the Management, Business, Science and Arts occupations in Miami, the most male-oriented occupations are Computers & Mathematics (97.3%), Architecture & Engineering (91.3%), and Computers, Engineering & Science (88.4%), while the most female-oriented occupations are Education Instruction & Library (79.8%), Health Technologists (79.6%), and Health Diagnosing & Treating (73.9%).
| Occupation | Male | Female |
| Management | 169 (49.1%) | 175 (50.9%) |
| Business & Financial | 39 (33.9%) | 76 (66.1%) |
| Computers, Engineering & Science | 160 (88.4%) | 21 (11.6%) |
| Computers & Mathematics | 108 (97.3%) | 3 (2.7%) |
| Architecture & Engineering | 42 (91.3%) | 4 (8.7%) |
| Life, Physical & Social Science | 10 (41.7%) | 14 (58.3%) |
| Community & Social Service | 192 (33.3%) | 385 (66.7%) |
| Education, Arts & Media | 81 (71.1%) | 33 (28.9%) |
| Legal Services & Support | 7 (43.8%) | 9 (56.2%) |
| Education Instruction & Library | 84 (20.2%) | 332 (79.8%) |
| Arts, Media & Entertainment | 20 (64.5%) | 11 (35.5%) |
| Health Diagnosing & Treating | 85 (26.1%) | 241 (73.9%) |
| Health Technologists | 47 (20.4%) | 183 (79.6%) |
| Total (Category) | 645 (41.8%) | 898 (58.2%) |
| Total (Overall) | 2,670 (50.9%) | 2,570 (49.0%) |
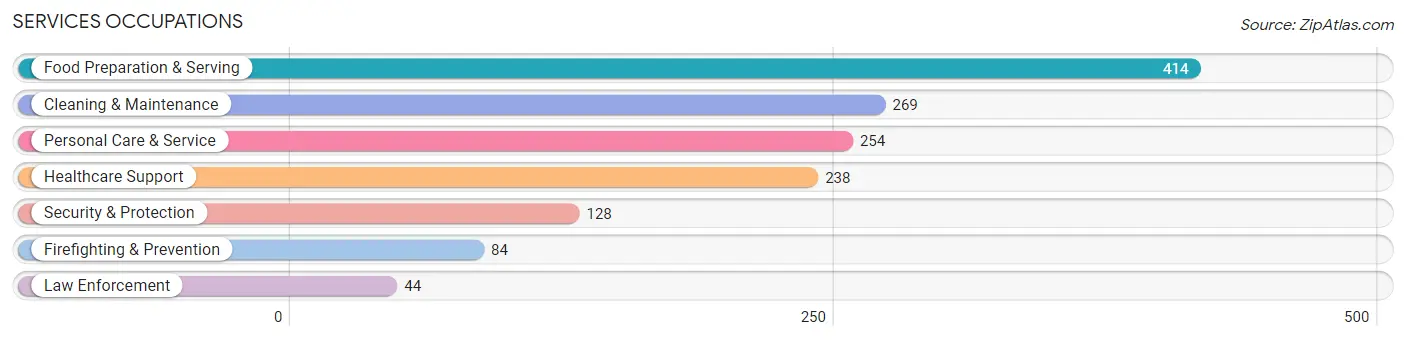
Services Occupations
The most common Services occupations in Miami are Food Preparation & Serving (414 | 7.9%), Cleaning & Maintenance (269 | 5.1%), Personal Care & Service (254 | 4.9%), Healthcare Support (238 | 4.5%), and Security & Protection (128 | 2.4%).
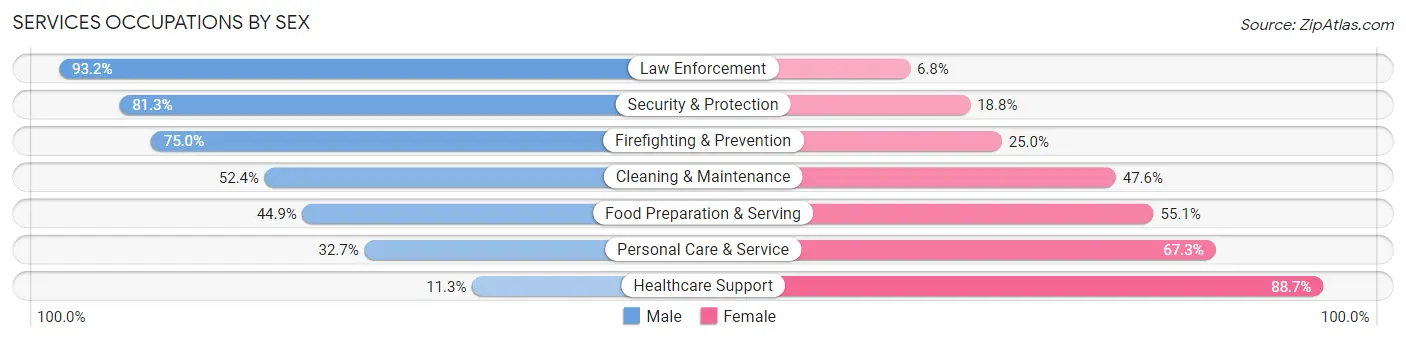
Services Occupations by Sex
Within the Services occupations in Miami, the most male-oriented occupations are Law Enforcement (93.2%), Security & Protection (81.2%), and Firefighting & Prevention (75.0%), while the most female-oriented occupations are Healthcare Support (88.7%), Personal Care & Service (67.3%), and Food Preparation & Serving (55.1%).
| Occupation | Male | Female |
| Healthcare Support | 27 (11.3%) | 211 (88.7%) |
| Security & Protection | 104 (81.2%) | 24 (18.8%) |
| Firefighting & Prevention | 63 (75.0%) | 21 (25.0%) |
| Law Enforcement | 41 (93.2%) | 3 (6.8%) |
| Food Preparation & Serving | 186 (44.9%) | 228 (55.1%) |
| Cleaning & Maintenance | 141 (52.4%) | 128 (47.6%) |
| Personal Care & Service | 83 (32.7%) | 171 (67.3%) |
| Total (Category) | 541 (41.5%) | 762 (58.5%) |
| Total (Overall) | 2,670 (50.9%) | 2,570 (49.0%) |
Sales and Office Occupations
The most common Sales and Office occupations in Miami are Sales & Related (511 | 9.8%), and Office & Administration (471 | 9.0%).

Sales and Office Occupations by Sex
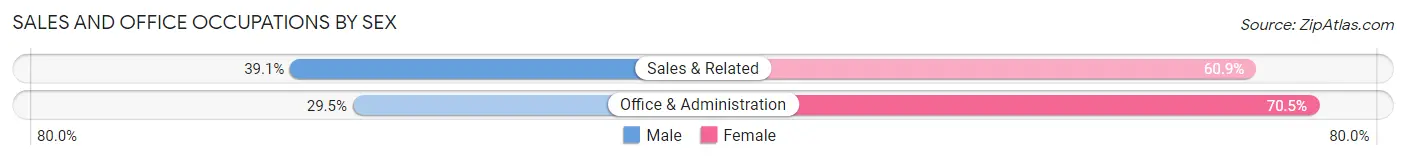
| Occupation | Male | Female |
| Sales & Related | 200 (39.1%) | 311 (60.9%) |
| Office & Administration | 139 (29.5%) | 332 (70.5%) |
| Total (Category) | 339 (34.5%) | 643 (65.5%) |
| Total (Overall) | 2,670 (50.9%) | 2,570 (49.0%) |
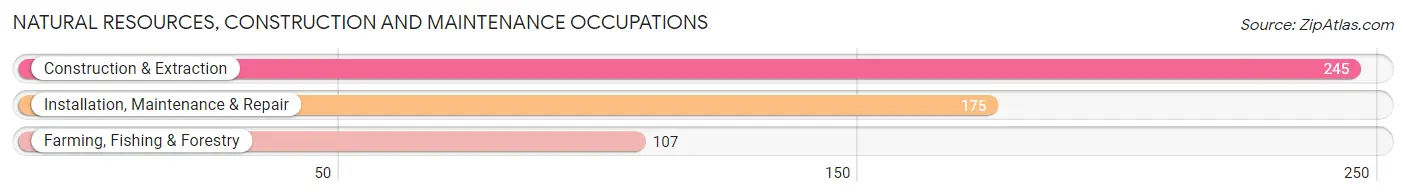
Natural Resources, Construction and Maintenance Occupations
The most common Natural Resources, Construction and Maintenance occupations in Miami are Construction & Extraction (245 | 4.7%), Installation, Maintenance & Repair (175 | 3.3%), and Farming, Fishing & Forestry (107 | 2.0%).
Natural Resources, Construction and Maintenance Occupations by Sex
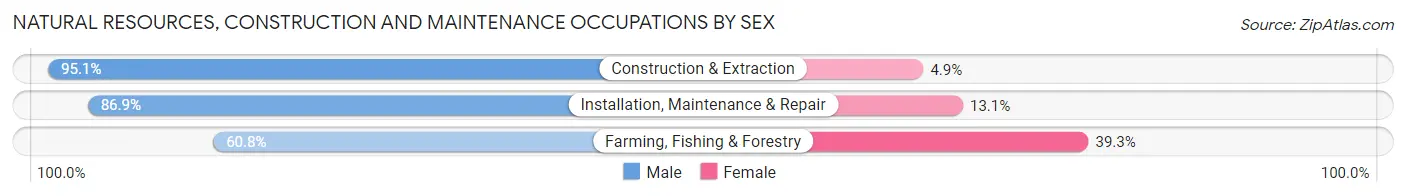
| Occupation | Male | Female |
| Farming, Fishing & Forestry | 65 (60.8%) | 42 (39.3%) |
| Construction & Extraction | 233 (95.1%) | 12 (4.9%) |
| Installation, Maintenance & Repair | 152 (86.9%) | 23 (13.1%) |
| Total (Category) | 450 (85.4%) | 77 (14.6%) |
| Total (Overall) | 2,670 (50.9%) | 2,570 (49.0%) |
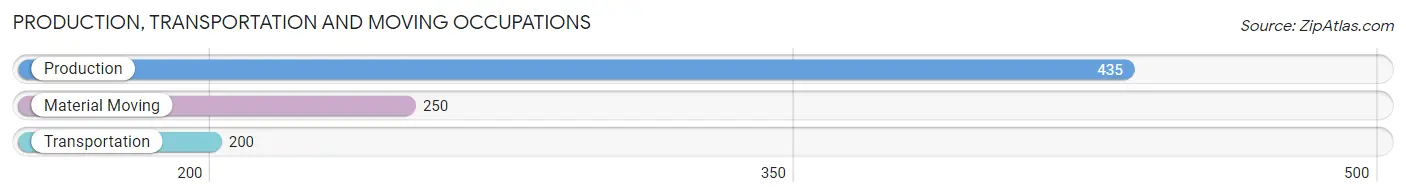
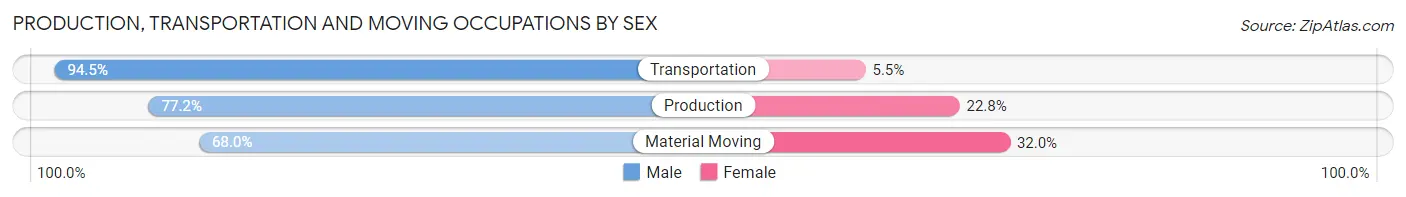
Production, Transportation and Moving Occupations
The most common Production, Transportation and Moving occupations in Miami are Production (435 | 8.3%), Material Moving (250 | 4.8%), and Transportation (200 | 3.8%).
Production, Transportation and Moving Occupations by Sex
| Occupation | Male | Female |
| Production | 336 (77.2%) | 99 (22.8%) |
| Transportation | 189 (94.5%) | 11 (5.5%) |
| Material Moving | 170 (68.0%) | 80 (32.0%) |
| Total (Category) | 695 (78.5%) | 190 (21.5%) |
| Total (Overall) | 2,670 (50.9%) | 2,570 (49.0%) |
Employment Industries by Sex in Miami
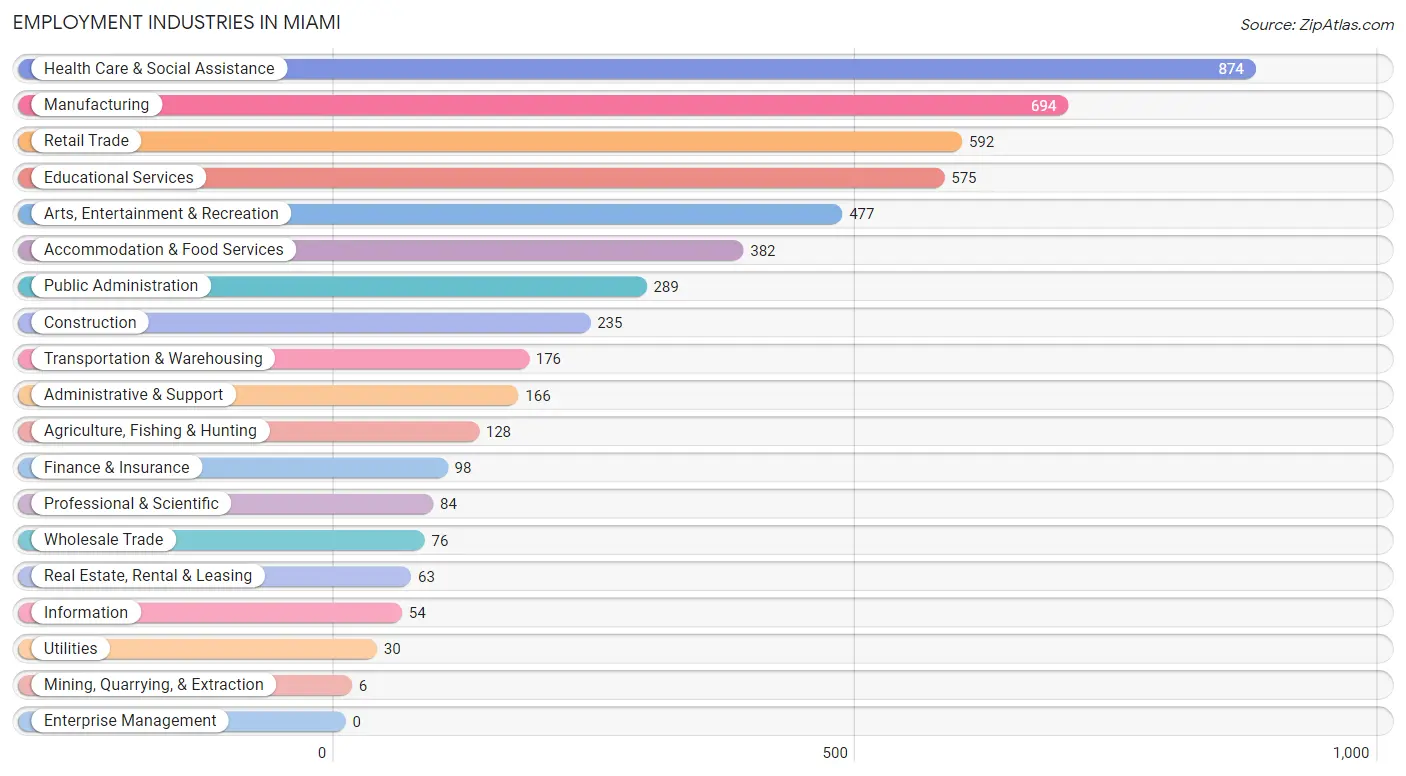
Employment Industries in Miami
The major employment industries in Miami include Health Care & Social Assistance (874 | 16.7%), Manufacturing (694 | 13.2%), Retail Trade (592 | 11.3%), Educational Services (575 | 11.0%), and Arts, Entertainment & Recreation (477 | 9.1%).
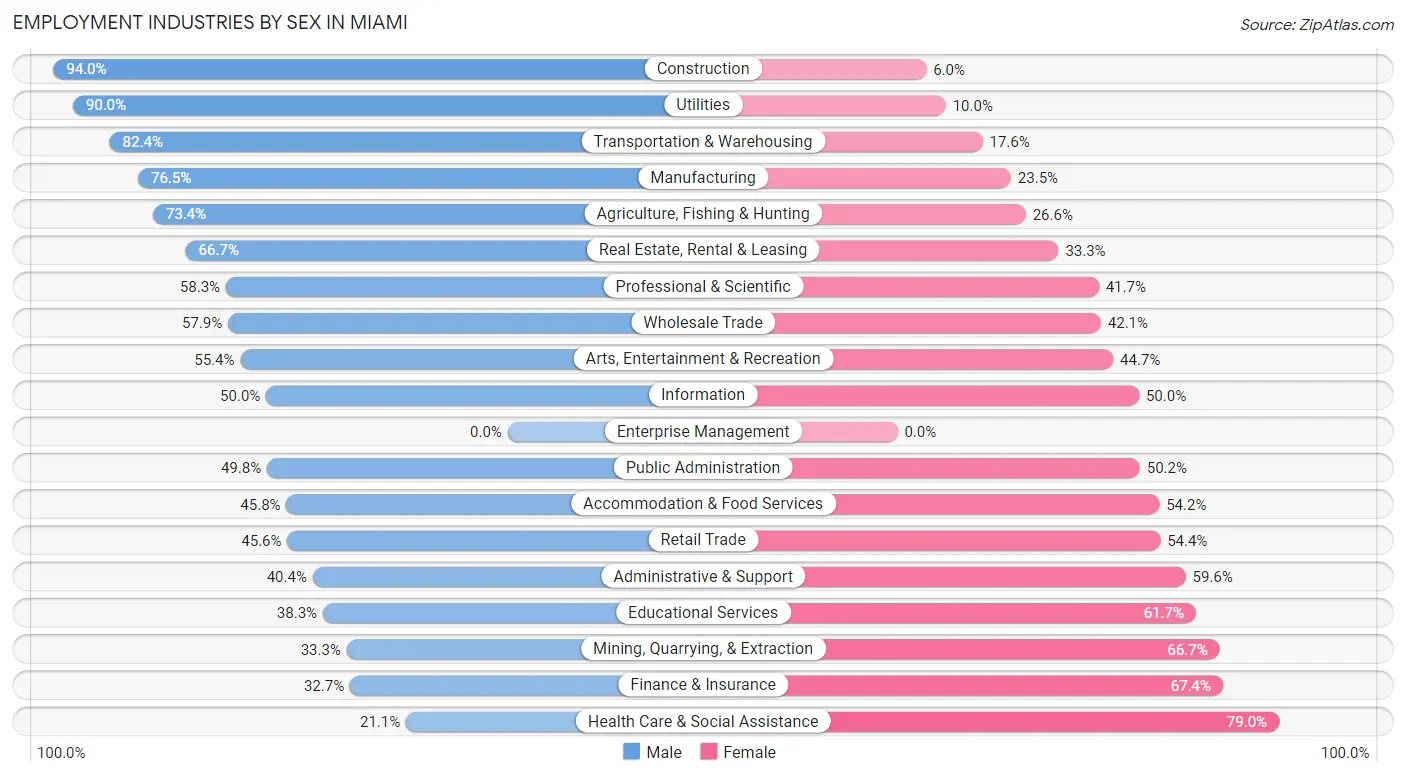
Employment Industries by Sex in Miami
The Miami industries that see more men than women are Construction (94.0%), Utilities (90.0%), and Transportation & Warehousing (82.4%), whereas the industries that tend to have a higher number of women are Health Care & Social Assistance (78.9%), Finance & Insurance (67.3%), and Mining, Quarrying, & Extraction (66.7%).
| Industry | Male | Female |
| Agriculture, Fishing & Hunting | 94 (73.4%) | 34 (26.6%) |
| Mining, Quarrying, & Extraction | 2 (33.3%) | 4 (66.7%) |
| Construction | 221 (94.0%) | 14 (6.0%) |
| Manufacturing | 531 (76.5%) | 163 (23.5%) |
| Wholesale Trade | 44 (57.9%) | 32 (42.1%) |
| Retail Trade | 270 (45.6%) | 322 (54.4%) |
| Transportation & Warehousing | 145 (82.4%) | 31 (17.6%) |
| Utilities | 27 (90.0%) | 3 (10.0%) |
| Information | 27 (50.0%) | 27 (50.0%) |
| Finance & Insurance | 32 (32.7%) | 66 (67.3%) |
| Real Estate, Rental & Leasing | 42 (66.7%) | 21 (33.3%) |
| Professional & Scientific | 49 (58.3%) | 35 (41.7%) |
| Enterprise Management | 0 (0.0%) | 0 (0.0%) |
| Administrative & Support | 67 (40.4%) | 99 (59.6%) |
| Educational Services | 220 (38.3%) | 355 (61.7%) |
| Health Care & Social Assistance | 184 (21.0%) | 690 (78.9%) |
| Arts, Entertainment & Recreation | 264 (55.3%) | 213 (44.7%) |
| Accommodation & Food Services | 175 (45.8%) | 207 (54.2%) |
| Public Administration | 144 (49.8%) | 145 (50.2%) |
| Total | 2,670 (50.9%) | 2,570 (49.0%) |
Education in Miami
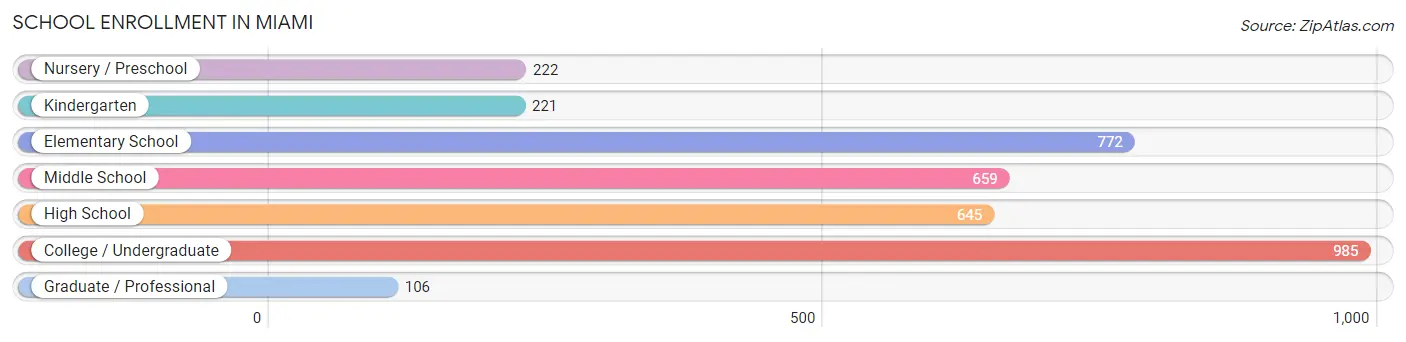
School Enrollment in Miami
The most common levels of schooling among the 3,610 students in Miami are college / undergraduate (985 | 27.3%), elementary school (772 | 21.4%), and middle school (659 | 18.2%).
| School Level | # Students | % Students |
| Nursery / Preschool | 222 | 6.1% |
| Kindergarten | 221 | 6.1% |
| Elementary School | 772 | 21.4% |
| Middle School | 659 | 18.2% |
| High School | 645 | 17.9% |
| College / Undergraduate | 985 | 27.3% |
| Graduate / Professional | 106 | 2.9% |
| Total | 3,610 | 100.0% |
School Enrollment by Age by Funding Source in Miami
Out of a total of 3,610 students who are enrolled in schools in Miami, 292 (8.1%) attend a private institution, while the remaining 3,318 (91.9%) are enrolled in public schools. The age group of 35 years and over has the highest likelihood of being enrolled in private schools, with 34 (29.6% in the age bracket) enrolled. Conversely, the age group of 20 to 24 year olds has the lowest likelihood of being enrolled in a private school, with 406 (96.4% in the age bracket) attending a public institution.
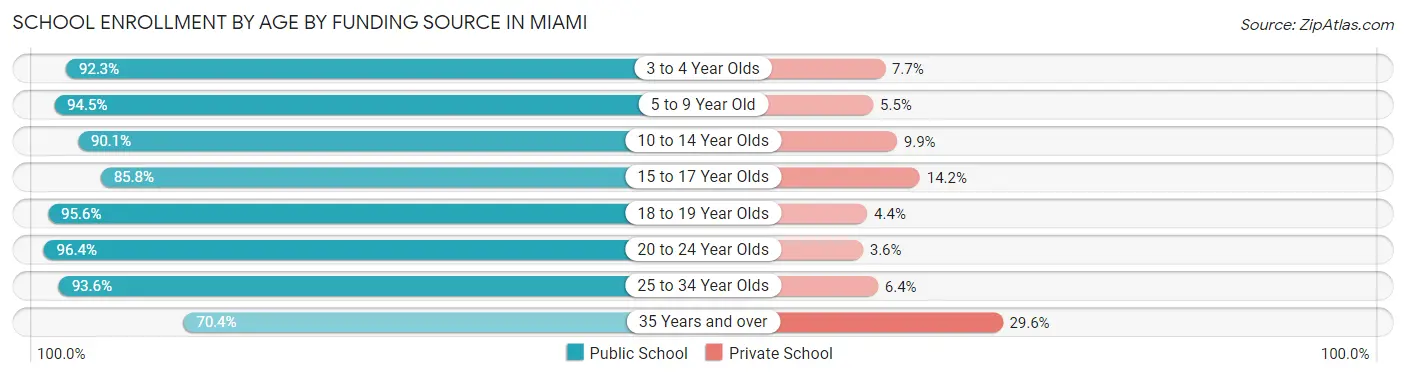
| Age Bracket | Public School | Private School |
| 3 to 4 Year Olds | 180 (92.3%) | 15 (7.7%) |
| 5 to 9 Year Old | 863 (94.5%) | 50 (5.5%) |
| 10 to 14 Year Olds | 773 (90.1%) | 85 (9.9%) |
| 15 to 17 Year Olds | 351 (85.8%) | 58 (14.2%) |
| 18 to 19 Year Olds | 503 (95.6%) | 23 (4.4%) |
| 20 to 24 Year Olds | 406 (96.4%) | 15 (3.6%) |
| 25 to 34 Year Olds | 162 (93.6%) | 11 (6.4%) |
| 35 Years and over | 81 (70.4%) | 34 (29.6%) |
| Total | 3,318 (91.9%) | 292 (8.1%) |
Educational Attainment by Field of Study in Miami
Education (415 | 29.5%), business (214 | 15.2%), science & technology (175 | 12.4%), arts & humanities (153 | 10.9%), and bio, nature & agricultural (61 | 4.3%) are the most common fields of study among 1,408 individuals in Miami who have obtained a bachelor's degree or higher.
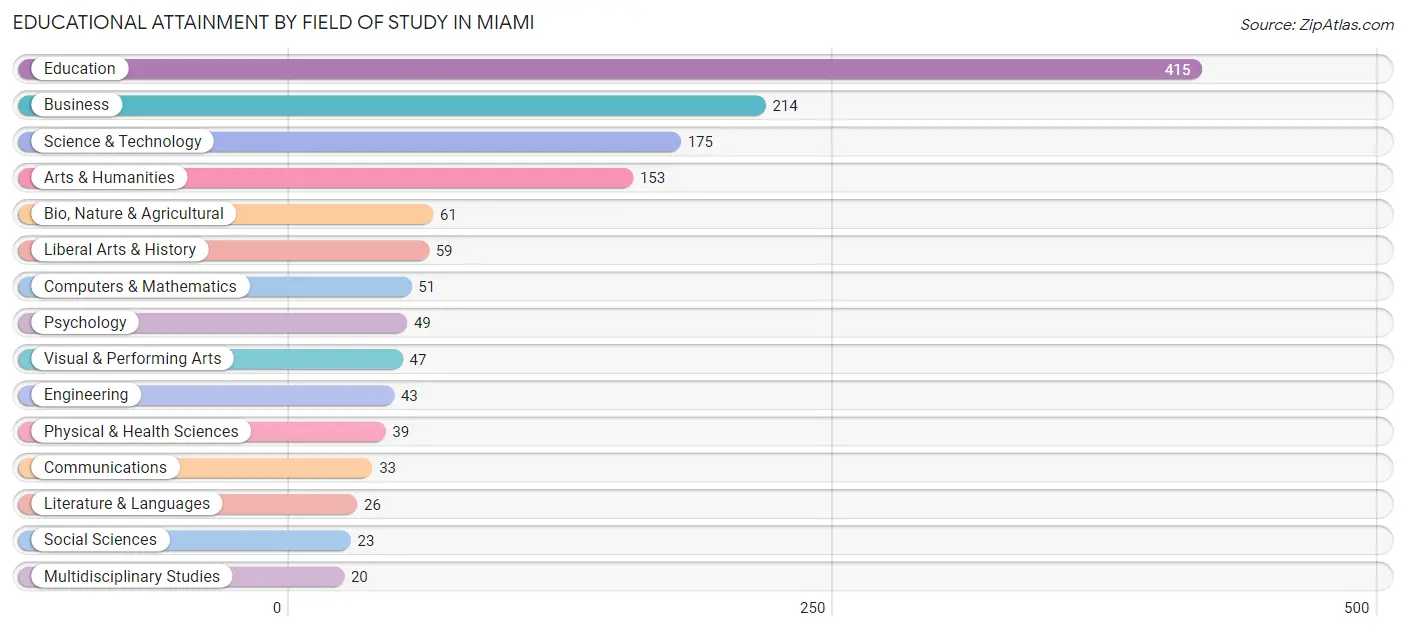
| Field of Study | # Graduates | % Graduates |
| Computers & Mathematics | 51 | 3.6% |
| Bio, Nature & Agricultural | 61 | 4.3% |
| Physical & Health Sciences | 39 | 2.8% |
| Psychology | 49 | 3.5% |
| Social Sciences | 23 | 1.6% |
| Engineering | 43 | 3.0% |
| Multidisciplinary Studies | 20 | 1.4% |
| Science & Technology | 175 | 12.4% |
| Business | 214 | 15.2% |
| Education | 415 | 29.5% |
| Literature & Languages | 26 | 1.8% |
| Liberal Arts & History | 59 | 4.2% |
| Visual & Performing Arts | 47 | 3.3% |
| Communications | 33 | 2.3% |
| Arts & Humanities | 153 | 10.9% |
| Total | 1,408 | 100.0% |
Transportation & Commute in Miami
Vehicle Availability by Sex in Miami
The most prevalent vehicle ownership categories in Miami are males with 2 vehicles (1,074, accounting for 42.7%) and females with 2 vehicles (982, making up 45.2%).
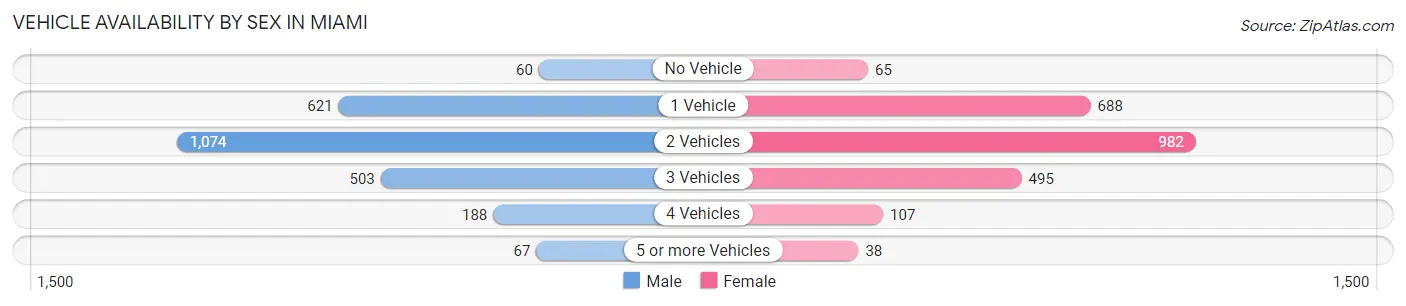
| Vehicles Available | Male | Female |
| No Vehicle | 60 (2.4%) | 65 (2.7%) |
| 1 Vehicle | 621 (24.7%) | 688 (29.0%) |
| 2 Vehicles | 1,074 (42.7%) | 982 (41.3%) |
| 3 Vehicles | 503 (20.0%) | 495 (20.8%) |
| 4 Vehicles | 188 (7.5%) | 107 (4.5%) |
| 5 or more Vehicles | 67 (2.7%) | 38 (1.6%) |
| Total | 2,513 (100.0%) | 2,375 (100.0%) |
Commute Time in Miami
The most frequently occuring commute durations in Miami are 5 to 9 minutes (1,474 commuters, 29.5%), 10 to 14 minutes (1,135 commuters, 22.7%), and 15 to 19 minutes (539 commuters, 10.8%).
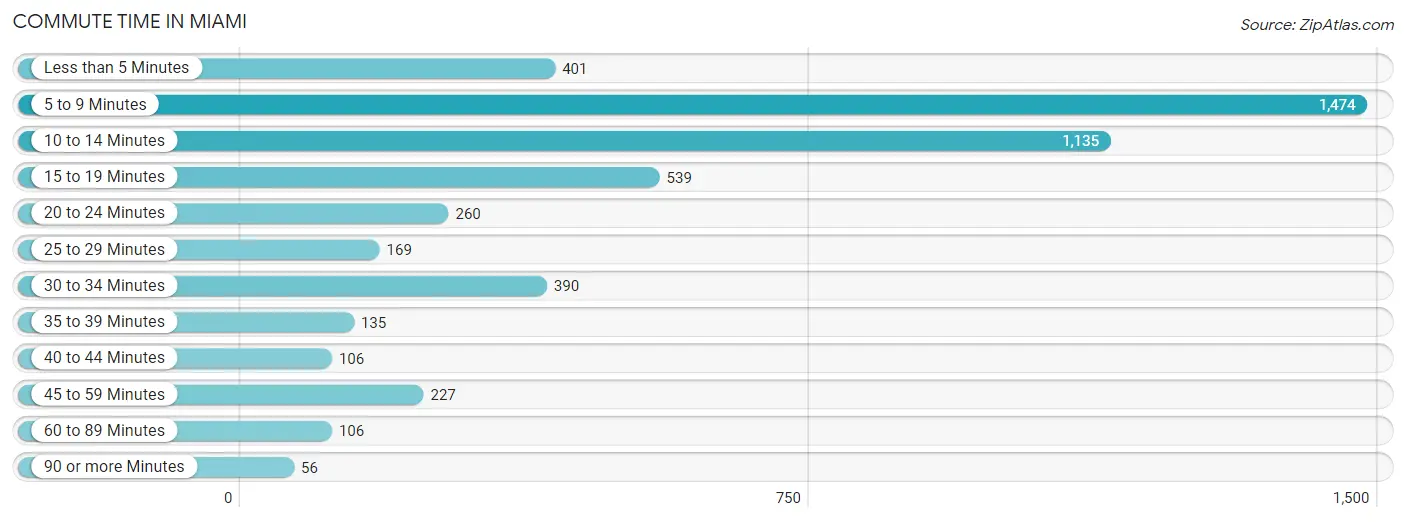
| Commute Time | # Commuters | % Commuters |
| Less than 5 Minutes | 401 | 8.0% |
| 5 to 9 Minutes | 1,474 | 29.5% |
| 10 to 14 Minutes | 1,135 | 22.7% |
| 15 to 19 Minutes | 539 | 10.8% |
| 20 to 24 Minutes | 260 | 5.2% |
| 25 to 29 Minutes | 169 | 3.4% |
| 30 to 34 Minutes | 390 | 7.8% |
| 35 to 39 Minutes | 135 | 2.7% |
| 40 to 44 Minutes | 106 | 2.1% |
| 45 to 59 Minutes | 227 | 4.5% |
| 60 to 89 Minutes | 106 | 2.1% |
| 90 or more Minutes | 56 | 1.1% |
Commute Time by Sex in Miami
The most common commute times in Miami are 5 to 9 minutes (626 commuters, 24.5%) for males and 5 to 9 minutes (848 commuters, 34.7%) for females.
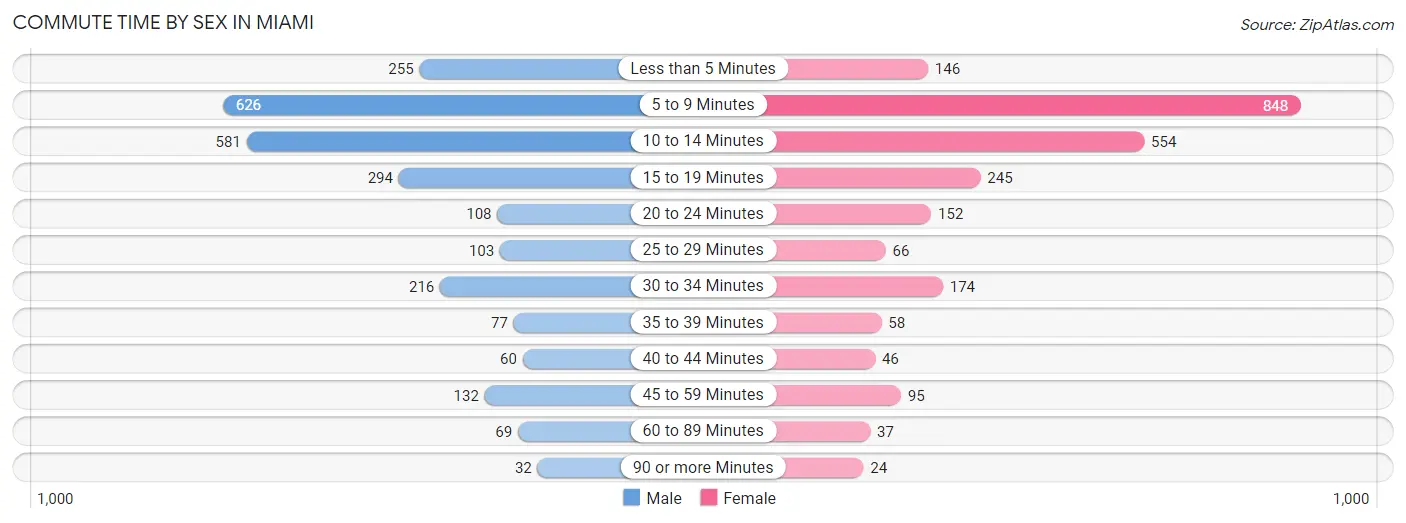
| Commute Time | Male | Female |
| Less than 5 Minutes | 255 (10.0%) | 146 (6.0%) |
| 5 to 9 Minutes | 626 (24.5%) | 848 (34.7%) |
| 10 to 14 Minutes | 581 (22.8%) | 554 (22.7%) |
| 15 to 19 Minutes | 294 (11.5%) | 245 (10.0%) |
| 20 to 24 Minutes | 108 (4.2%) | 152 (6.2%) |
| 25 to 29 Minutes | 103 (4.0%) | 66 (2.7%) |
| 30 to 34 Minutes | 216 (8.5%) | 174 (7.1%) |
| 35 to 39 Minutes | 77 (3.0%) | 58 (2.4%) |
| 40 to 44 Minutes | 60 (2.4%) | 46 (1.9%) |
| 45 to 59 Minutes | 132 (5.2%) | 95 (3.9%) |
| 60 to 89 Minutes | 69 (2.7%) | 37 (1.5%) |
| 90 or more Minutes | 32 (1.3%) | 24 (1.0%) |
Time of Departure to Work by Sex in Miami
The most frequent times of departure to work in Miami are 4:00 PM to 11:59 PM (335, 13.1%) for males and 7:30 AM to 7:59 AM (412, 16.9%) for females.
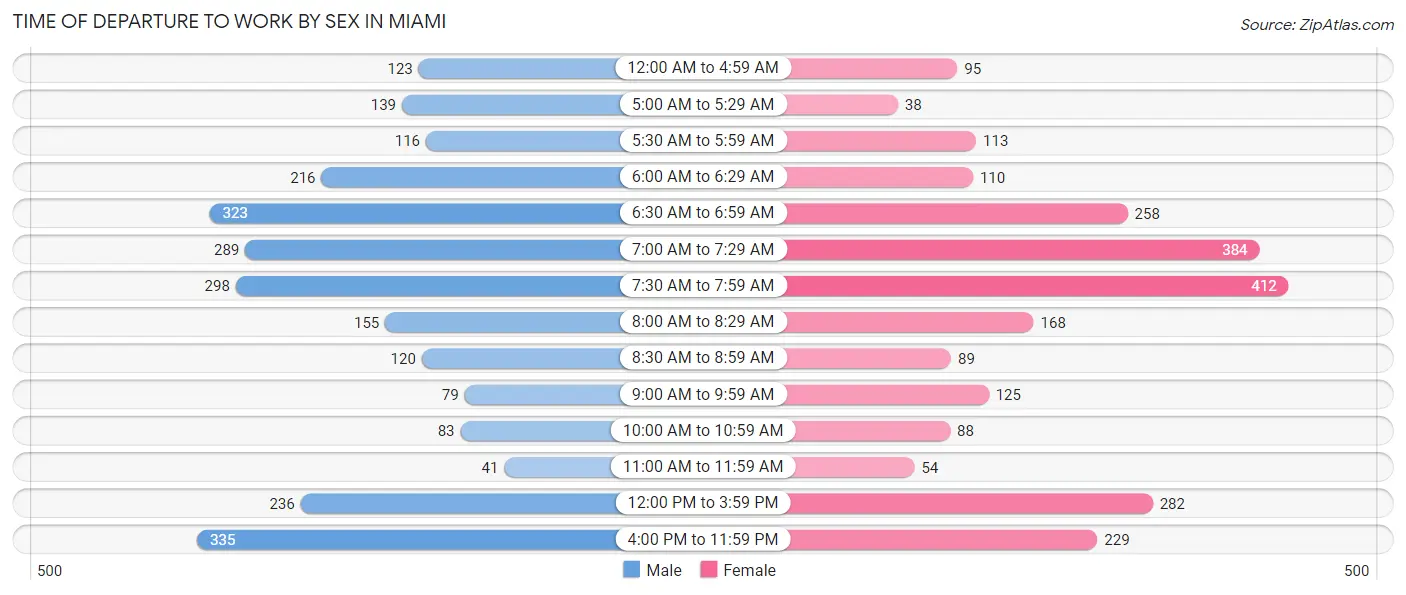
| Time of Departure | Male | Female |
| 12:00 AM to 4:59 AM | 123 (4.8%) | 95 (3.9%) |
| 5:00 AM to 5:29 AM | 139 (5.4%) | 38 (1.5%) |
| 5:30 AM to 5:59 AM | 116 (4.5%) | 113 (4.6%) |
| 6:00 AM to 6:29 AM | 216 (8.5%) | 110 (4.5%) |
| 6:30 AM to 6:59 AM | 323 (12.7%) | 258 (10.5%) |
| 7:00 AM to 7:29 AM | 289 (11.3%) | 384 (15.7%) |
| 7:30 AM to 7:59 AM | 298 (11.7%) | 412 (16.9%) |
| 8:00 AM to 8:29 AM | 155 (6.1%) | 168 (6.9%) |
| 8:30 AM to 8:59 AM | 120 (4.7%) | 89 (3.6%) |
| 9:00 AM to 9:59 AM | 79 (3.1%) | 125 (5.1%) |
| 10:00 AM to 10:59 AM | 83 (3.3%) | 88 (3.6%) |
| 11:00 AM to 11:59 AM | 41 (1.6%) | 54 (2.2%) |
| 12:00 PM to 3:59 PM | 236 (9.2%) | 282 (11.5%) |
| 4:00 PM to 11:59 PM | 335 (13.1%) | 229 (9.4%) |
| Total | 2,553 (100.0%) | 2,445 (100.0%) |
Housing Occupancy in Miami
Occupancy by Ownership in Miami
Of the total 4,868 dwellings in Miami, owner-occupied units account for 2,742 (56.3%), while renter-occupied units make up 2,126 (43.7%).
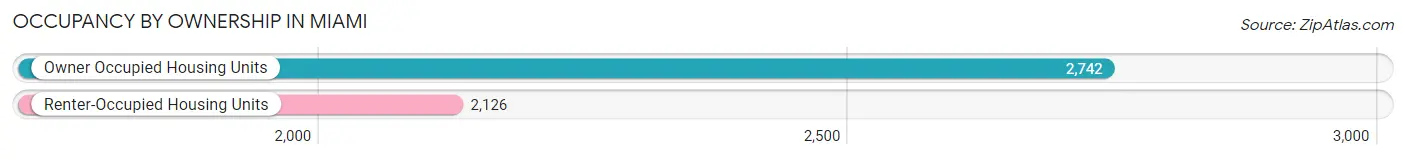
| Occupancy | # Housing Units | % Housing Units |
| Owner Occupied Housing Units | 2,742 | 56.3% |
| Renter-Occupied Housing Units | 2,126 | 43.7% |
| Total Occupied Housing Units | 4,868 | 100.0% |
Occupancy by Household Size in Miami
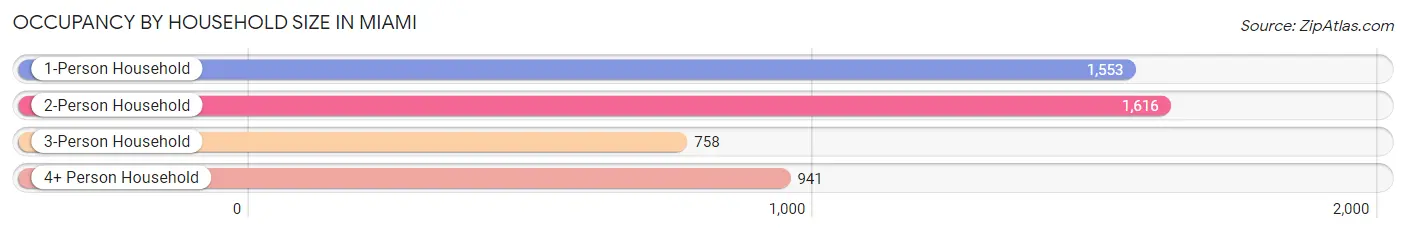
| Household Size | # Housing Units | % Housing Units |
| 1-Person Household | 1,553 | 31.9% |
| 2-Person Household | 1,616 | 33.2% |
| 3-Person Household | 758 | 15.6% |
| 4+ Person Household | 941 | 19.3% |
| Total Housing Units | 4,868 | 100.0% |
Occupancy by Ownership by Household Size in Miami
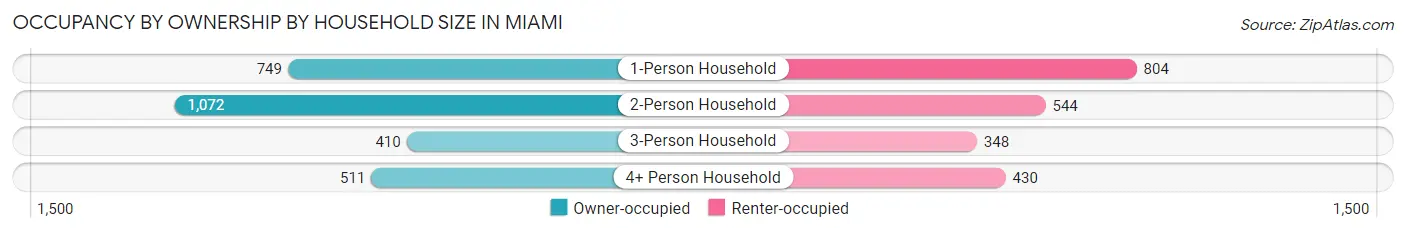
| Household Size | Owner-occupied | Renter-occupied |
| 1-Person Household | 749 (48.2%) | 804 (51.8%) |
| 2-Person Household | 1,072 (66.3%) | 544 (33.7%) |
| 3-Person Household | 410 (54.1%) | 348 (45.9%) |
| 4+ Person Household | 511 (54.3%) | 430 (45.7%) |
| Total Housing Units | 2,742 (56.3%) | 2,126 (43.7%) |
Occupancy by Educational Attainment in Miami
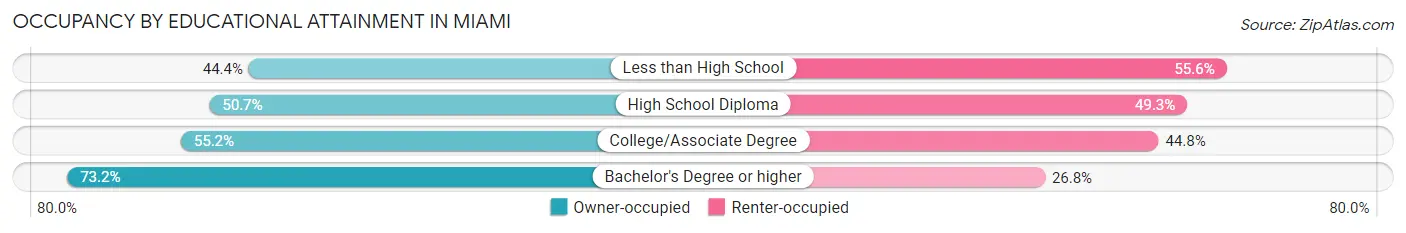
| Household Size | Owner-occupied | Renter-occupied |
| Less than High School | 244 (44.4%) | 305 (55.6%) |
| High School Diploma | 698 (50.7%) | 679 (49.3%) |
| College/Associate Degree | 1,086 (55.2%) | 881 (44.8%) |
| Bachelor's Degree or higher | 714 (73.2%) | 261 (26.8%) |
Occupancy by Age of Householder in Miami
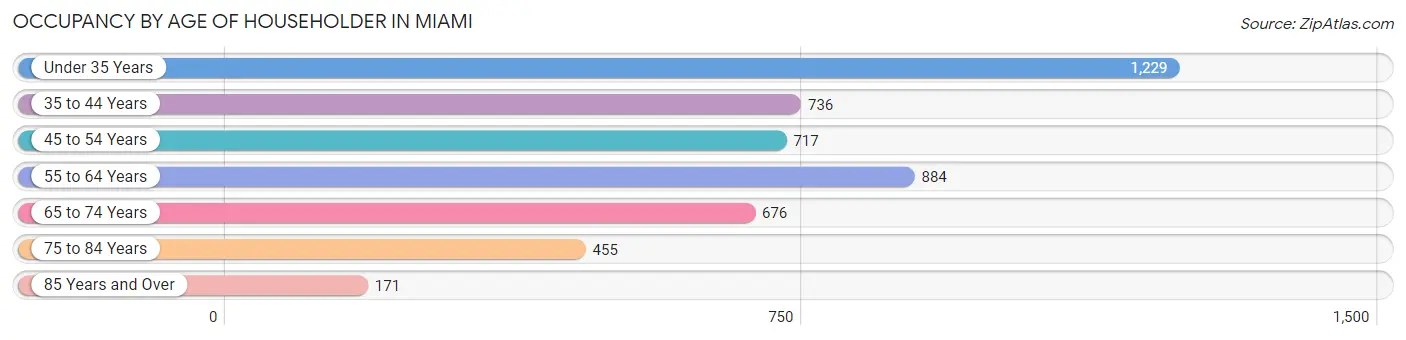
| Age Bracket | # Households | % Households |
| Under 35 Years | 1,229 | 25.3% |
| 35 to 44 Years | 736 | 15.1% |
| 45 to 54 Years | 717 | 14.7% |
| 55 to 64 Years | 884 | 18.2% |
| 65 to 74 Years | 676 | 13.9% |
| 75 to 84 Years | 455 | 9.3% |
| 85 Years and Over | 171 | 3.5% |
| Total | 4,868 | 100.0% |
Housing Finances in Miami
Median Income by Occupancy in Miami
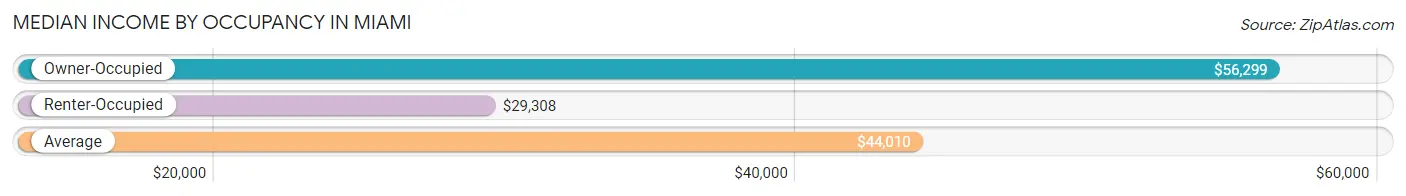
| Occupancy Type | # Households | Median Income |
| Owner-Occupied | 2,742 (56.3%) | $56,299 |
| Renter-Occupied | 2,126 (43.7%) | $29,308 |
| Average | 4,868 (100.0%) | $44,010 |
Occupancy by Householder Income Bracket in Miami
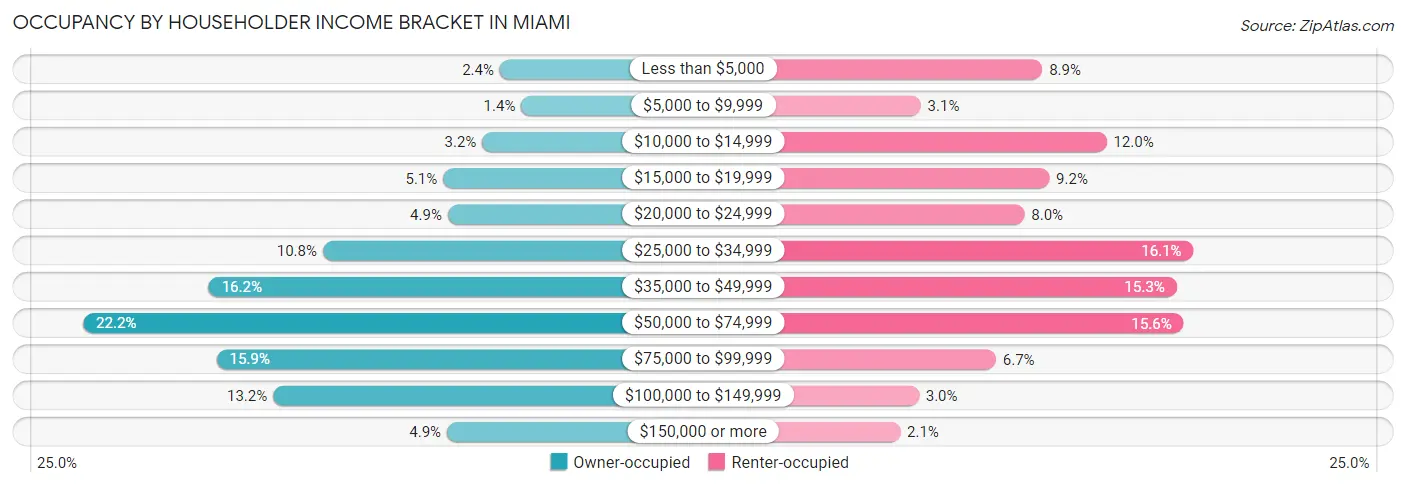
| Income Bracket | Owner-occupied | Renter-occupied |
| Less than $5,000 | 65 (2.4%) | 189 (8.9%) |
| $5,000 to $9,999 | 37 (1.3%) | 66 (3.1%) |
| $10,000 to $14,999 | 88 (3.2%) | 254 (11.9%) |
| $15,000 to $19,999 | 139 (5.1%) | 196 (9.2%) |
| $20,000 to $24,999 | 133 (4.9%) | 171 (8.0%) |
| $25,000 to $34,999 | 296 (10.8%) | 342 (16.1%) |
| $35,000 to $49,999 | 445 (16.2%) | 325 (15.3%) |
| $50,000 to $74,999 | 609 (22.2%) | 332 (15.6%) |
| $75,000 to $99,999 | 435 (15.9%) | 142 (6.7%) |
| $100,000 to $149,999 | 361 (13.2%) | 64 (3.0%) |
| $150,000 or more | 134 (4.9%) | 45 (2.1%) |
| Total | 2,742 (100.0%) | 2,126 (100.0%) |
Monthly Housing Cost Tiers in Miami
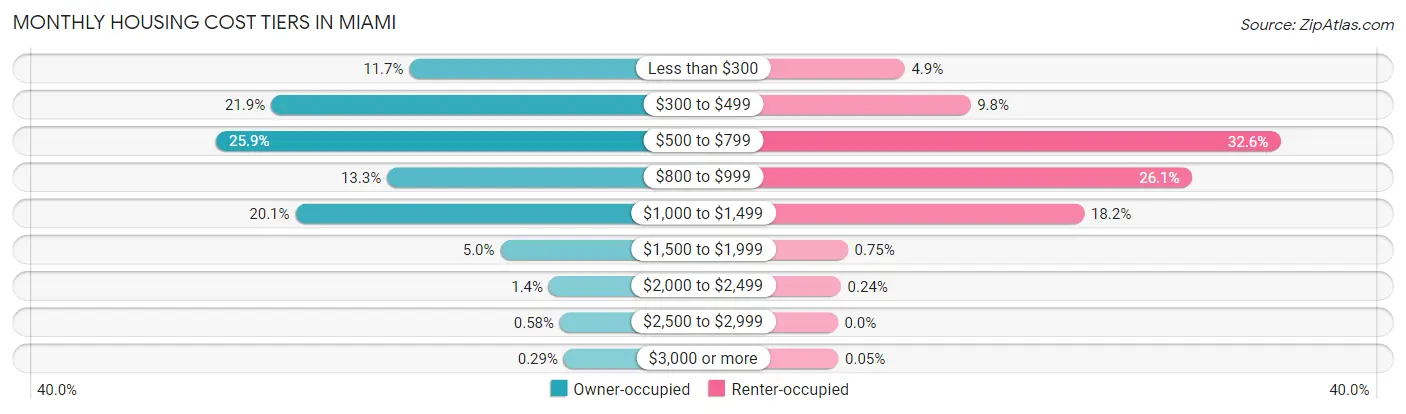
| Monthly Cost | Owner-occupied | Renter-occupied |
| Less than $300 | 320 (11.7%) | 105 (4.9%) |
| $300 to $499 | 599 (21.8%) | 208 (9.8%) |
| $500 to $799 | 710 (25.9%) | 693 (32.6%) |
| $800 to $999 | 365 (13.3%) | 554 (26.1%) |
| $1,000 to $1,499 | 550 (20.1%) | 386 (18.2%) |
| $1,500 to $1,999 | 136 (5.0%) | 16 (0.7%) |
| $2,000 to $2,499 | 38 (1.4%) | 5 (0.2%) |
| $2,500 to $2,999 | 16 (0.6%) | 0 (0.0%) |
| $3,000 or more | 8 (0.3%) | 1 (0.1%) |
| Total | 2,742 (100.0%) | 2,126 (100.0%) |
Physical Housing Characteristics in Miami
Housing Structures in Miami
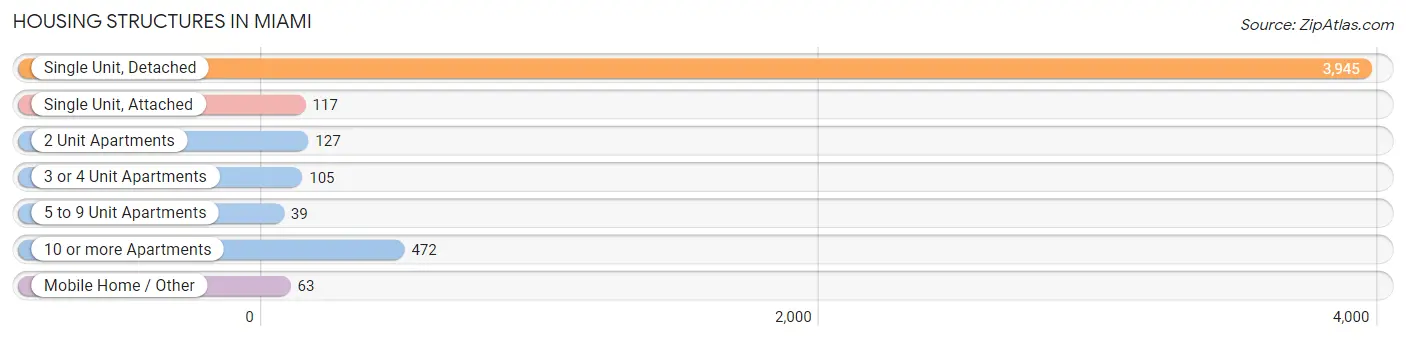
| Structure Type | # Housing Units | % Housing Units |
| Single Unit, Detached | 3,945 | 81.0% |
| Single Unit, Attached | 117 | 2.4% |
| 2 Unit Apartments | 127 | 2.6% |
| 3 or 4 Unit Apartments | 105 | 2.2% |
| 5 to 9 Unit Apartments | 39 | 0.8% |
| 10 or more Apartments | 472 | 9.7% |
| Mobile Home / Other | 63 | 1.3% |
| Total | 4,868 | 100.0% |
Housing Structures by Occupancy in Miami
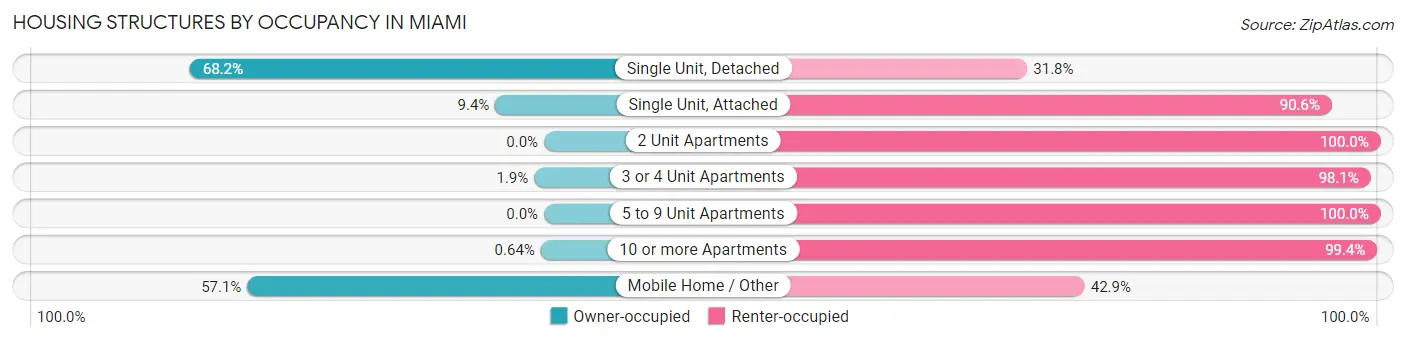
| Structure Type | Owner-occupied | Renter-occupied |
| Single Unit, Detached | 2,690 (68.2%) | 1,255 (31.8%) |
| Single Unit, Attached | 11 (9.4%) | 106 (90.6%) |
| 2 Unit Apartments | 0 (0.0%) | 127 (100.0%) |
| 3 or 4 Unit Apartments | 2 (1.9%) | 103 (98.1%) |
| 5 to 9 Unit Apartments | 0 (0.0%) | 39 (100.0%) |
| 10 or more Apartments | 3 (0.6%) | 469 (99.4%) |
| Mobile Home / Other | 36 (57.1%) | 27 (42.9%) |
| Total | 2,742 (56.3%) | 2,126 (43.7%) |
Housing Structures by Number of Rooms in Miami
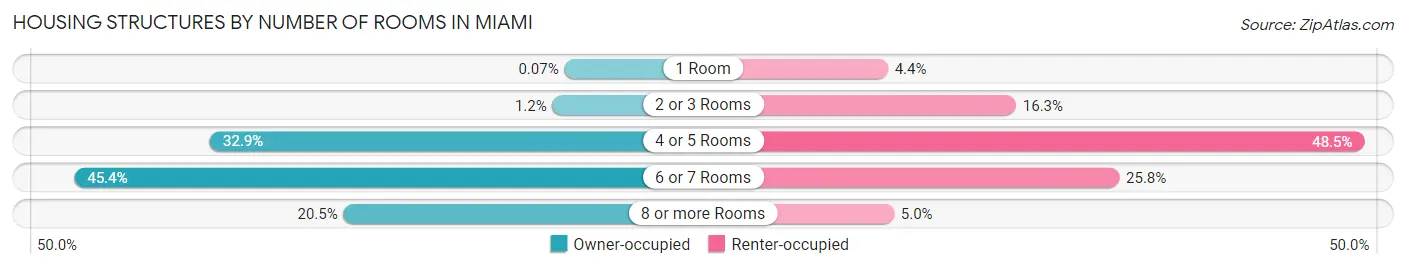
| Number of Rooms | Owner-occupied | Renter-occupied |
| 1 Room | 2 (0.1%) | 94 (4.4%) |
| 2 or 3 Rooms | 32 (1.2%) | 346 (16.3%) |
| 4 or 5 Rooms | 901 (32.9%) | 1,031 (48.5%) |
| 6 or 7 Rooms | 1,245 (45.4%) | 549 (25.8%) |
| 8 or more Rooms | 562 (20.5%) | 106 (5.0%) |
| Total | 2,742 (100.0%) | 2,126 (100.0%) |
Housing Structure by Heating Type in Miami
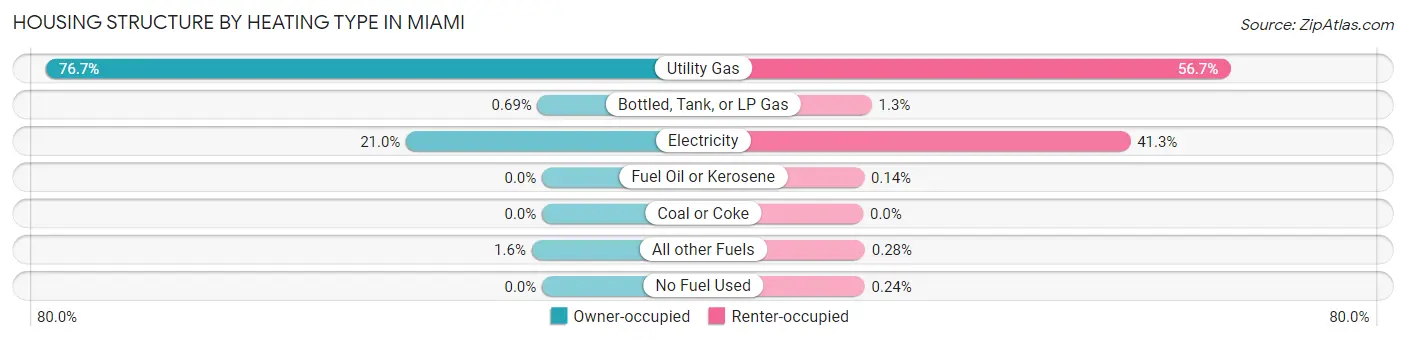
| Heating Type | Owner-occupied | Renter-occupied |
| Utility Gas | 2,103 (76.7%) | 1,206 (56.7%) |
| Bottled, Tank, or LP Gas | 19 (0.7%) | 28 (1.3%) |
| Electricity | 576 (21.0%) | 878 (41.3%) |
| Fuel Oil or Kerosene | 0 (0.0%) | 3 (0.1%) |
| Coal or Coke | 0 (0.0%) | 0 (0.0%) |
| All other Fuels | 44 (1.6%) | 6 (0.3%) |
| No Fuel Used | 0 (0.0%) | 5 (0.2%) |
| Total | 2,742 (100.0%) | 2,126 (100.0%) |
Household Vehicle Usage in Miami
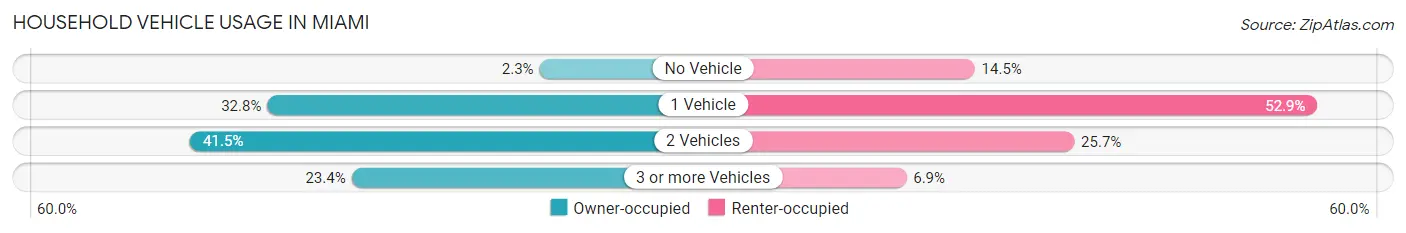
| Vehicles per Household | Owner-occupied | Renter-occupied |
| No Vehicle | 64 (2.3%) | 309 (14.5%) |
| 1 Vehicle | 900 (32.8%) | 1,125 (52.9%) |
| 2 Vehicles | 1,137 (41.5%) | 546 (25.7%) |
| 3 or more Vehicles | 641 (23.4%) | 146 (6.9%) |
| Total | 2,742 (100.0%) | 2,126 (100.0%) |
Real Estate & Mortgages in Miami
Real Estate and Mortgage Overview in Miami
| Characteristic | Without Mortgage | With Mortgage |
| Housing Units | 1,272 | 1,470 |
| Median Property Value | $88,700 | $99,900 |
| Median Household Income | $44,096 | $79 |
| Monthly Housing Costs | $415 | $8 |
| Real Estate Taxes | $558 | $64 |
Property Value by Mortgage Status in Miami
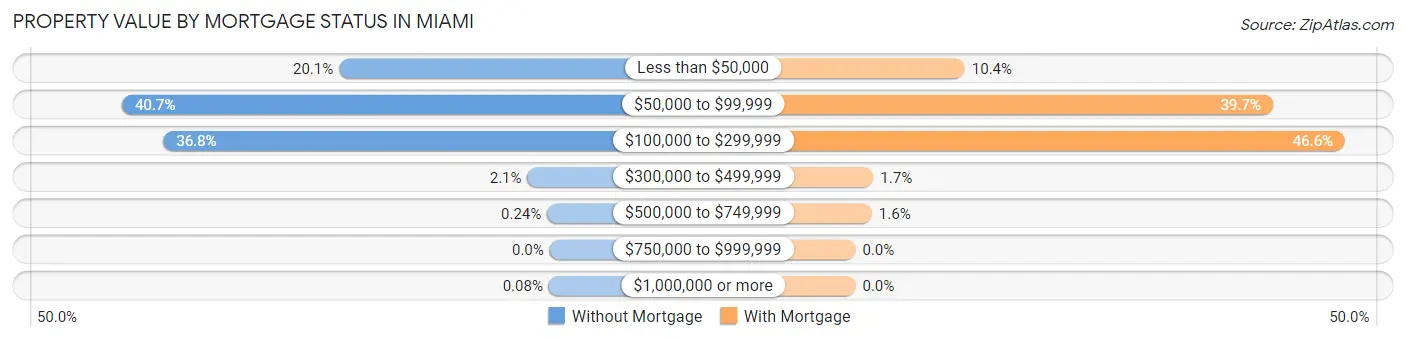
| Property Value | Without Mortgage | With Mortgage |
| Less than $50,000 | 255 (20.1%) | 153 (10.4%) |
| $50,000 to $99,999 | 518 (40.7%) | 584 (39.7%) |
| $100,000 to $299,999 | 468 (36.8%) | 685 (46.6%) |
| $300,000 to $499,999 | 27 (2.1%) | 25 (1.7%) |
| $500,000 to $749,999 | 3 (0.2%) | 23 (1.6%) |
| $750,000 to $999,999 | 0 (0.0%) | 0 (0.0%) |
| $1,000,000 or more | 1 (0.1%) | 0 (0.0%) |
| Total | 1,272 (100.0%) | 1,470 (100.0%) |
Household Income by Mortgage Status in Miami
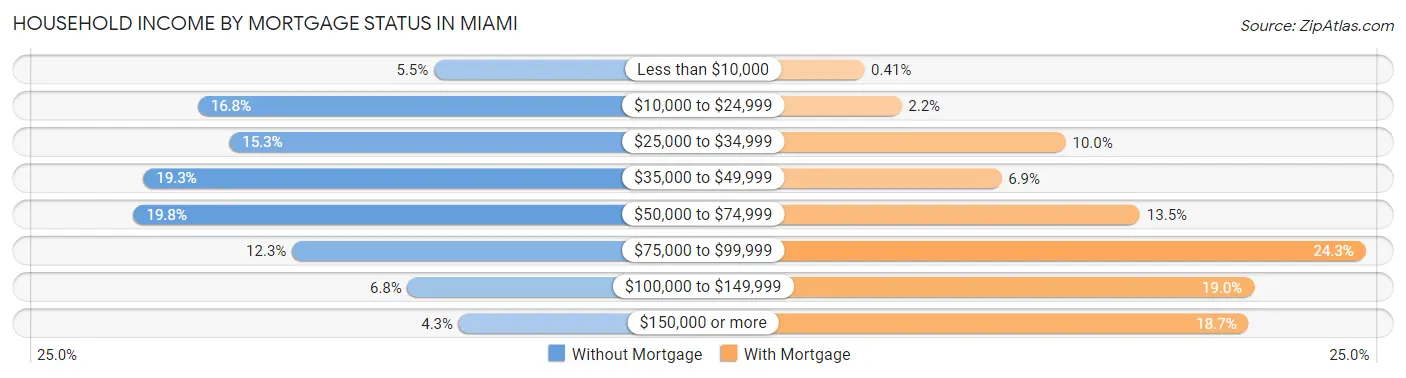
| Household Income | Without Mortgage | With Mortgage |
| Less than $10,000 | 70 (5.5%) | 6 (0.4%) |
| $10,000 to $24,999 | 213 (16.8%) | 32 (2.2%) |
| $25,000 to $34,999 | 194 (15.2%) | 147 (10.0%) |
| $35,000 to $49,999 | 246 (19.3%) | 102 (6.9%) |
| $50,000 to $74,999 | 252 (19.8%) | 199 (13.5%) |
| $75,000 to $99,999 | 156 (12.3%) | 357 (24.3%) |
| $100,000 to $149,999 | 86 (6.8%) | 279 (19.0%) |
| $150,000 or more | 55 (4.3%) | 275 (18.7%) |
| Total | 1,272 (100.0%) | 1,470 (100.0%) |
Property Value to Household Income Ratio in Miami
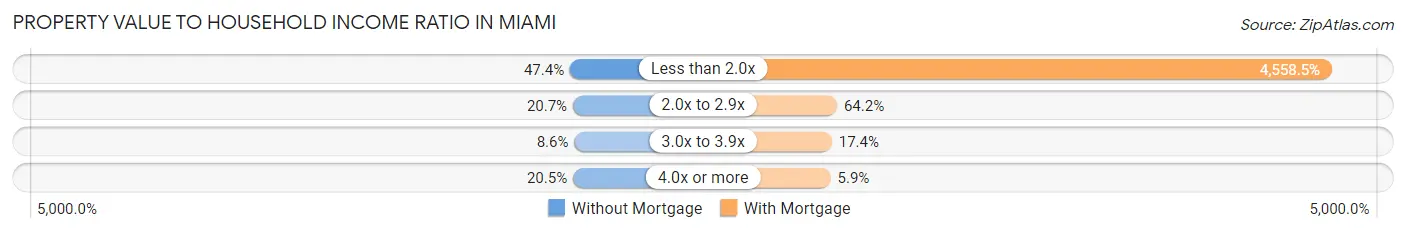
| Value-to-Income Ratio | Without Mortgage | With Mortgage |
| Less than 2.0x | 603 (47.4%) | 67,010 (4,558.5%) |
| 2.0x to 2.9x | 263 (20.7%) | 943 (64.1%) |
| 3.0x to 3.9x | 109 (8.6%) | 255 (17.3%) |
| 4.0x or more | 261 (20.5%) | 87 (5.9%) |
| Total | 1,272 (100.0%) | 1,470 (100.0%) |
Real Estate Taxes by Mortgage Status in Miami
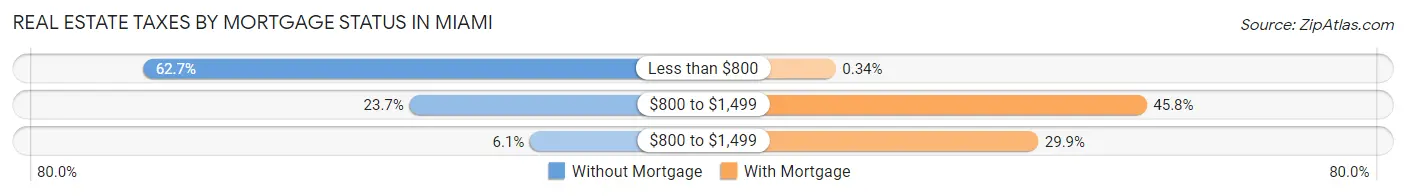
| Property Taxes | Without Mortgage | With Mortgage |
| Less than $800 | 798 (62.7%) | 5 (0.3%) |
| $800 to $1,499 | 302 (23.7%) | 673 (45.8%) |
| $800 to $1,499 | 78 (6.1%) | 440 (29.9%) |
| Total | 1,272 (100.0%) | 1,470 (100.0%) |
Health & Disability in Miami
Health Insurance Coverage by Age in Miami
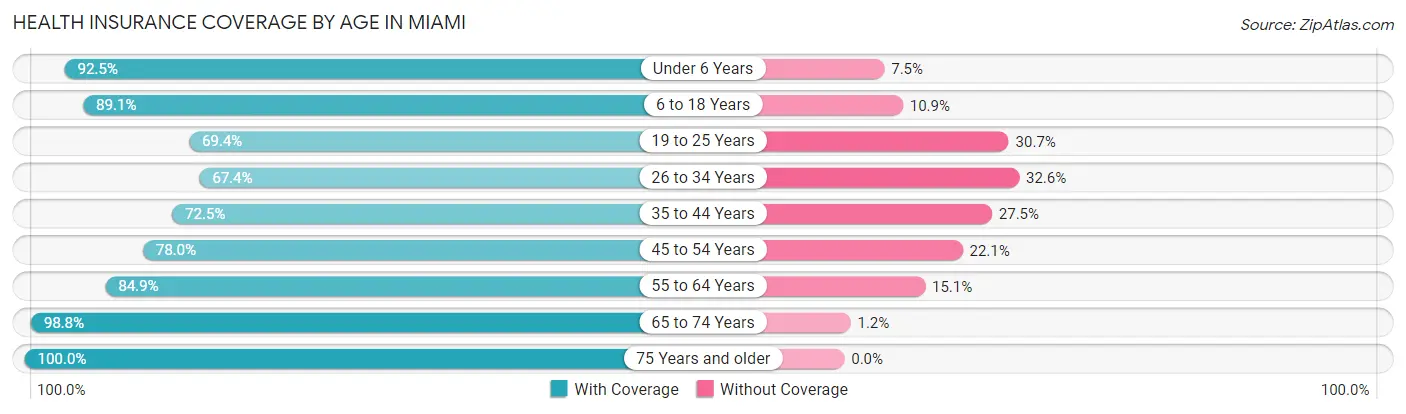
| Age Bracket | With Coverage | Without Coverage |
| Under 6 Years | 1,117 (92.5%) | 90 (7.5%) |
| 6 to 18 Years | 2,132 (89.1%) | 261 (10.9%) |
| 19 to 25 Years | 1,156 (69.4%) | 511 (30.6%) |
| 26 to 34 Years | 1,053 (67.4%) | 509 (32.6%) |
| 35 to 44 Years | 927 (72.5%) | 352 (27.5%) |
| 45 to 54 Years | 990 (77.9%) | 280 (22.1%) |
| 55 to 64 Years | 1,246 (84.9%) | 221 (15.1%) |
| 65 to 74 Years | 1,024 (98.8%) | 12 (1.2%) |
| 75 Years and older | 822 (100.0%) | 0 (0.0%) |
| Total | 10,467 (82.4%) | 2,236 (17.6%) |
Health Insurance Coverage by Citizenship Status in Miami
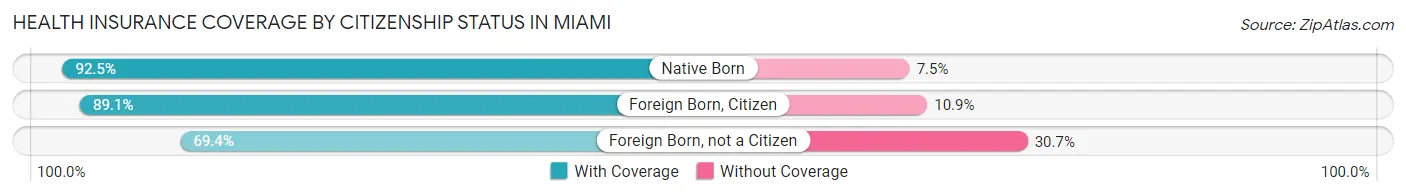
| Citizenship Status | With Coverage | Without Coverage |
| Native Born | 1,117 (92.5%) | 90 (7.5%) |
| Foreign Born, Citizen | 2,132 (89.1%) | 261 (10.9%) |
| Foreign Born, not a Citizen | 1,156 (69.4%) | 511 (30.6%) |
Health Insurance Coverage by Household Income in Miami
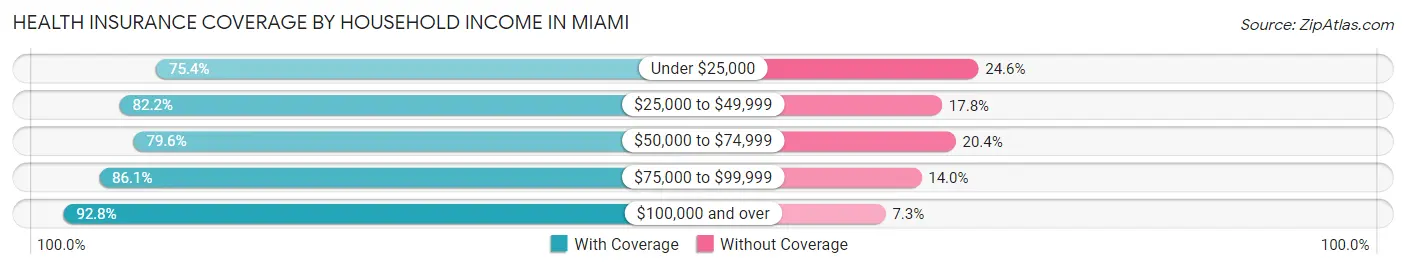
| Household Income | With Coverage | Without Coverage |
| Under $25,000 | 1,881 (75.4%) | 615 (24.6%) |
| $25,000 to $49,999 | 2,748 (82.2%) | 596 (17.8%) |
| $50,000 to $74,999 | 1,981 (79.6%) | 507 (20.4%) |
| $75,000 to $99,999 | 1,486 (86.1%) | 241 (14.0%) |
| $100,000 and over | 1,777 (92.7%) | 139 (7.2%) |
Public vs Private Health Insurance Coverage by Age in Miami
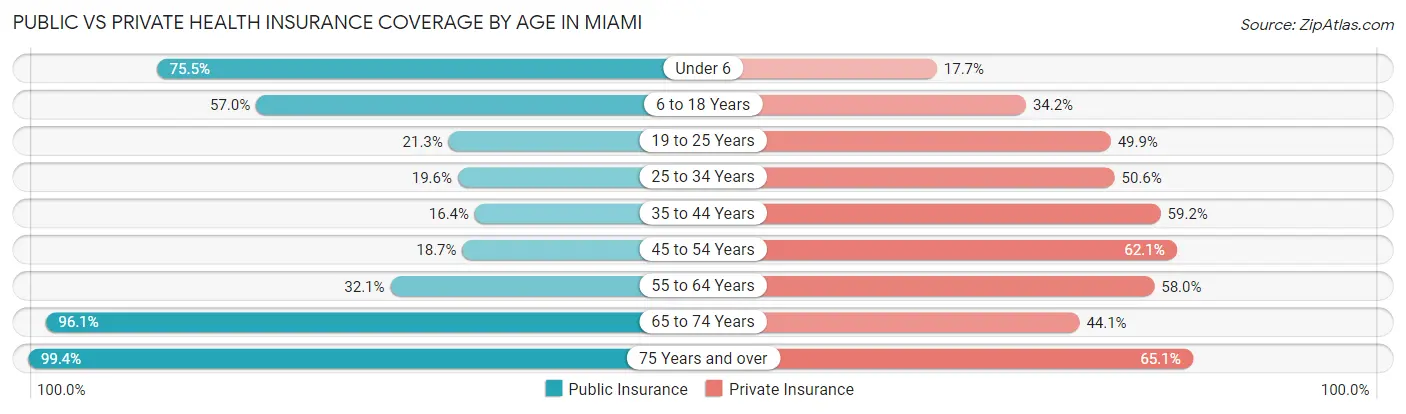
| Age Bracket | Public Insurance | Private Insurance |
| Under 6 | 911 (75.5%) | 213 (17.6%) |
| 6 to 18 Years | 1,365 (57.0%) | 818 (34.2%) |
| 19 to 25 Years | 355 (21.3%) | 832 (49.9%) |
| 25 to 34 Years | 306 (19.6%) | 791 (50.6%) |
| 35 to 44 Years | 210 (16.4%) | 757 (59.2%) |
| 45 to 54 Years | 238 (18.7%) | 789 (62.1%) |
| 55 to 64 Years | 471 (32.1%) | 851 (58.0%) |
| 65 to 74 Years | 996 (96.1%) | 457 (44.1%) |
| 75 Years and over | 817 (99.4%) | 535 (65.1%) |
| Total | 5,669 (44.6%) | 6,043 (47.6%) |
Disability Status by Sex by Age in Miami
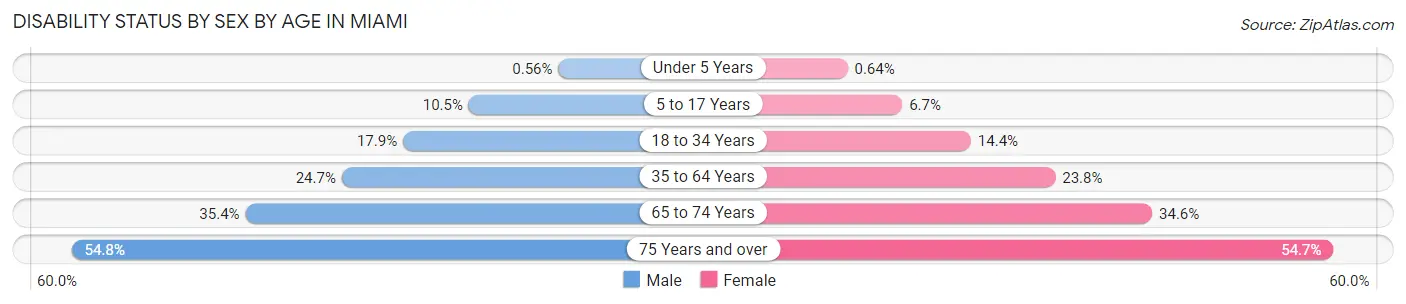
| Age Bracket | Male | Female |
| Under 5 Years | 3 (0.6%) | 3 (0.6%) |
| 5 to 17 Years | 123 (10.5%) | 76 (6.7%) |
| 18 to 34 Years | 326 (17.9%) | 245 (14.4%) |
| 35 to 64 Years | 489 (24.7%) | 484 (23.8%) |
| 65 to 74 Years | 165 (35.4%) | 197 (34.6%) |
| 75 Years and over | 178 (54.8%) | 272 (54.7%) |
Disability Class by Sex by Age in Miami
Disability Class: Hearing Difficulty
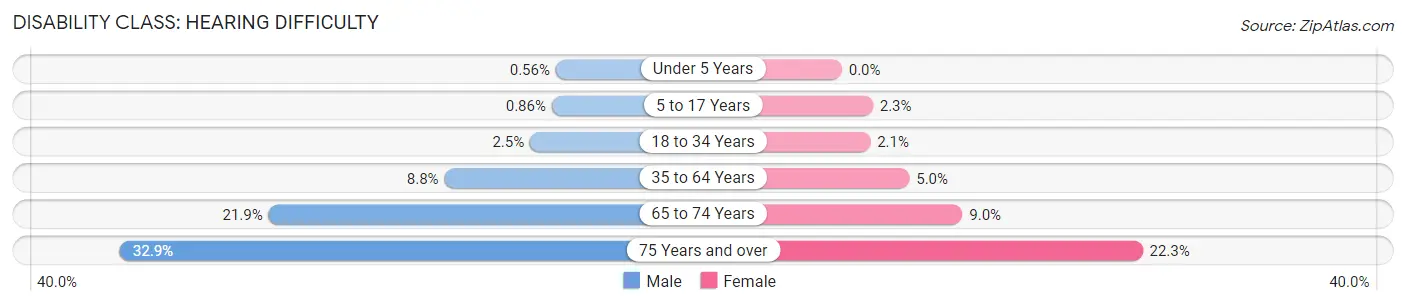
| Age Bracket | Male | Female |
| Under 5 Years | 3 (0.6%) | 0 (0.0%) |
| 5 to 17 Years | 10 (0.9%) | 26 (2.3%) |
| 18 to 34 Years | 45 (2.5%) | 36 (2.1%) |
| 35 to 64 Years | 175 (8.8%) | 102 (5.0%) |
| 65 to 74 Years | 102 (21.9%) | 51 (8.9%) |
| 75 Years and over | 107 (32.9%) | 111 (22.3%) |
Disability Class: Vision Difficulty
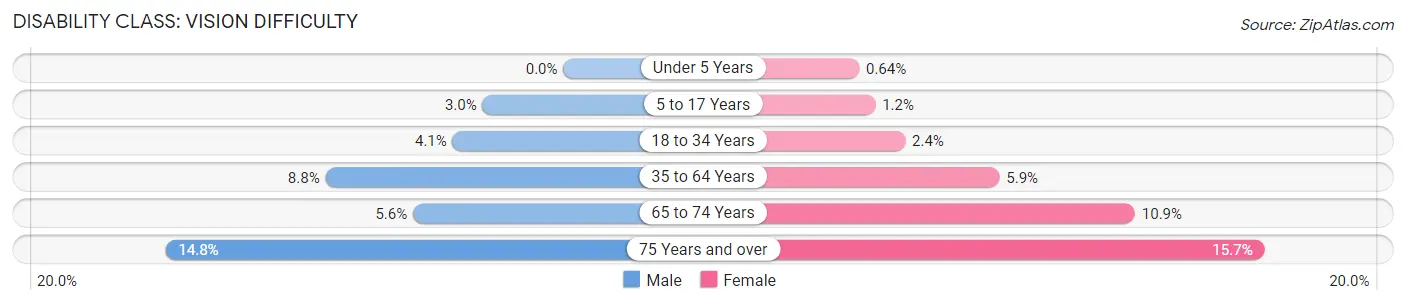
| Age Bracket | Male | Female |
| Under 5 Years | 0 (0.0%) | 3 (0.6%) |
| 5 to 17 Years | 35 (3.0%) | 14 (1.2%) |
| 18 to 34 Years | 75 (4.1%) | 40 (2.4%) |
| 35 to 64 Years | 175 (8.8%) | 119 (5.9%) |
| 65 to 74 Years | 26 (5.6%) | 62 (10.9%) |
| 75 Years and over | 48 (14.8%) | 78 (15.7%) |
Disability Class: Cognitive Difficulty
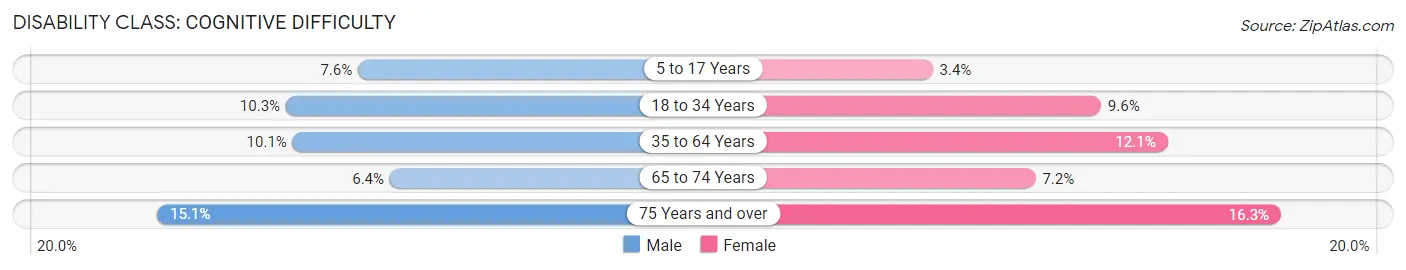
| Age Bracket | Male | Female |
| 5 to 17 Years | 89 (7.6%) | 38 (3.4%) |
| 18 to 34 Years | 188 (10.3%) | 164 (9.6%) |
| 35 to 64 Years | 199 (10.1%) | 246 (12.1%) |
| 65 to 74 Years | 30 (6.4%) | 41 (7.2%) |
| 75 Years and over | 49 (15.1%) | 81 (16.3%) |
Disability Class: Ambulatory Difficulty
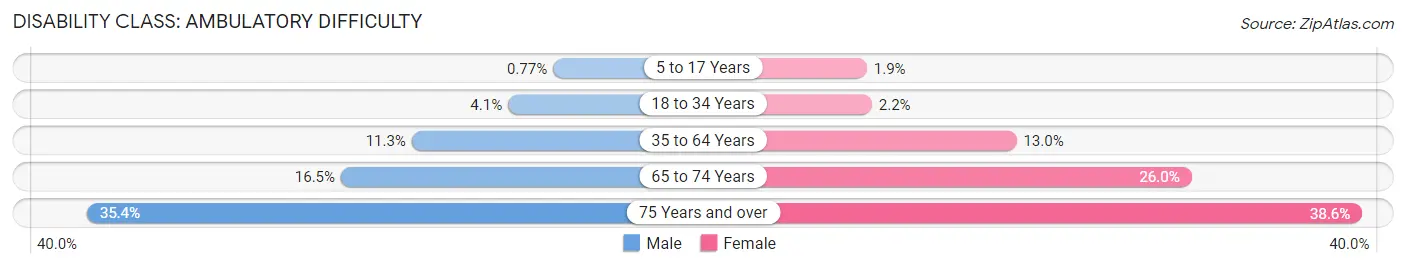
| Age Bracket | Male | Female |
| 5 to 17 Years | 9 (0.8%) | 21 (1.9%) |
| 18 to 34 Years | 75 (4.1%) | 38 (2.2%) |
| 35 to 64 Years | 223 (11.3%) | 264 (13.0%) |
| 65 to 74 Years | 77 (16.5%) | 148 (26.0%) |
| 75 Years and over | 115 (35.4%) | 192 (38.6%) |
Disability Class: Self-Care Difficulty
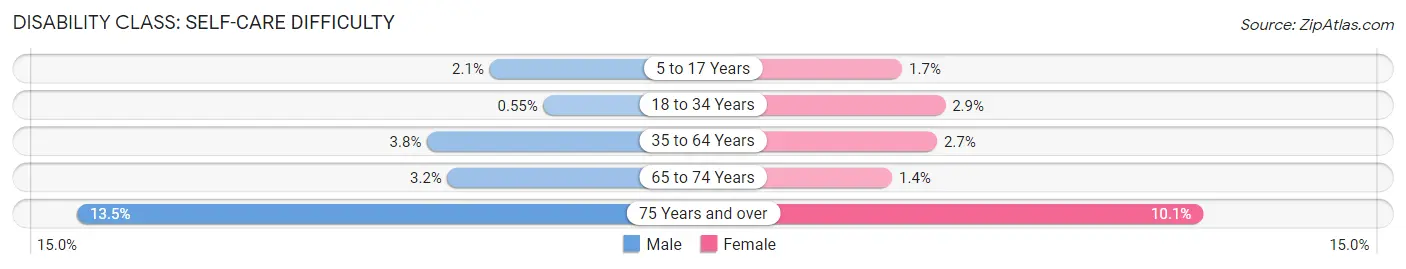
| Age Bracket | Male | Female |
| 5 to 17 Years | 24 (2.1%) | 19 (1.7%) |
| 18 to 34 Years | 10 (0.5%) | 49 (2.9%) |
| 35 to 64 Years | 75 (3.8%) | 54 (2.6%) |
| 65 to 74 Years | 15 (3.2%) | 8 (1.4%) |
| 75 Years and over | 44 (13.5%) | 50 (10.1%) |
Technology Access in Miami
Computing Device Access in Miami
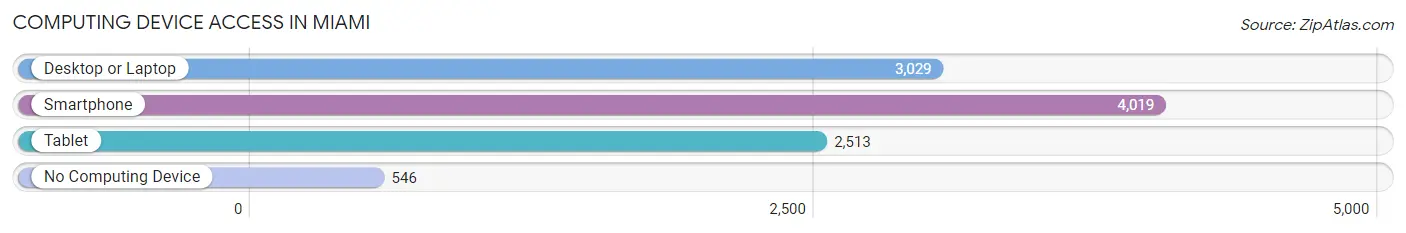
| Device Type | # Households | % Households |
| Desktop or Laptop | 3,029 | 62.2% |
| Smartphone | 4,019 | 82.6% |
| Tablet | 2,513 | 51.6% |
| No Computing Device | 546 | 11.2% |
| Total | 4,868 | 100.0% |
Internet Access in Miami
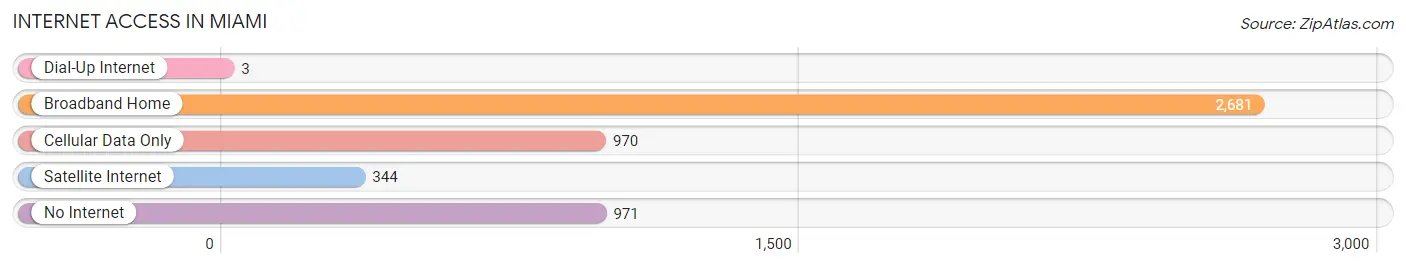
| Internet Type | # Households | % Households |
| Dial-Up Internet | 3 | 0.1% |
| Broadband Home | 2,681 | 55.1% |
| Cellular Data Only | 970 | 19.9% |
| Satellite Internet | 344 | 7.1% |
| No Internet | 971 | 20.0% |
| Total | 4,868 | 100.0% |
Miami Summary
Miami, Oklahoma is a city located in Ottawa County in the northeastern part of the state. It is the county seat of Ottawa County and is part of the Joplin, Missouri metropolitan area. The city has a population of 13,570 as of the 2010 census.
Geography
Miami is located in the northeastern part of Oklahoma, in Ottawa County. It is situated on the Neosho River, near the Kansas border. The city is located at the intersection of US Highway 69 and State Highway 10. The city has a total area of 8.3 square miles, all of which is land.
Climate
Miami has a humid subtropical climate, with hot, humid summers and mild winters. The average annual temperature is 61.3°F, with an average high of 79.2°F in July and an average low of 43.4°F in January. The average annual precipitation is 40.2 inches, with an average of 4.2 inches of snowfall per year.
Demographics
As of the 2010 census, there were 13,570 people, 5,541 households, and 3,521 families residing in the city. The population density was 1,631.2 people per square mile. The racial makeup of the city was 79.2% White, 1.2% African American, 11.3% Native American, 0.5% Asian, 0.1% Pacific Islander, 4.2% from other races, and 3.5% from two or more races. Hispanic or Latino of any race were 8.2% of the population.
Economy
Miami is the economic hub of Ottawa County and the surrounding area. The city is home to several major employers, including Northeastern Oklahoma A&M College, Integris Baptist Regional Health Center, and the Miami Nation Casino. The city also has a strong retail sector, with several major shopping centers and stores.
The city's economy is largely based on agriculture, with wheat, soybeans, and hay being the main crops. The city is also home to several manufacturing companies, including a steel mill, a paper mill, and a plastics plant.
Education
Miami is served by the Miami Public Schools district, which includes four elementary schools, one middle school, and one high school. The city is also home to Northeastern Oklahoma A&M College, a two-year public college.
Transportation
Miami is served by US Highway 69 and State Highway 10, as well as several local roads. The city is also served by the Miami Regional Airport, which offers daily flights to Tulsa and Oklahoma City. The city is also served by the Miami Transit System, which provides bus service throughout the city.
Conclusion
Miami, Oklahoma is a city located in Ottawa County in the northeastern part of the state. It is the county seat of Ottawa County and is part of the Joplin, Missouri metropolitan area. The city has a population of 13,570 as of the 2010 census. Miami has a humid subtropical climate, with hot, humid summers and mild winters. The city's economy is largely based on agriculture, with wheat, soybeans, and hay being the main crops. The city is also home to several major employers, including Northeastern Oklahoma A&M College, Integris Baptist Regional Health Center, and the Miami Nation Casino. The city is served by US Highway 69 and State Highway 10, as well as several local roads. The city is also served by the Miami Regional Airport, which offers daily flights to Tulsa and Oklahoma City. The city is also served by the Miami Transit System, which provides bus service throughout the city.
Common Questions
What is Per Capita Income in Miami?
Per Capita income in Miami is $22,385.
What is the Median Family Income in Miami?
Median Family Income in Miami is $53,338.
What is the Median Household income in Miami?
Median Household Income in Miami is $44,010.
What is Income or Wage Gap in Miami?
Income or Wage Gap in Miami is 29.0%.
Women in Miami earn 71.0 cents for every dollar earned by a man.
What is Family Income Deficit in Miami?
Family Income Deficit in Miami is $11,284.
Families that are below poverty line in Miami earn $11,284 less on average than the poverty threshold level.
What is Inequality or Gini Index in Miami?
Inequality or Gini Index in Miami is 0.45.
What is the Total Population of Miami?
Total Population of Miami is 12,995.
What is the Total Male Population of Miami?
Total Male Population of Miami is 6,451.
What is the Total Female Population of Miami?
Total Female Population of Miami is 6,544.
What is the Ratio of Males per 100 Females in Miami?
There are 98.58 Males per 100 Females in Miami.
What is the Ratio of Females per 100 Males in Miami?
There are 101.44 Females per 100 Males in Miami.
What is the Median Population Age in Miami?
Median Population Age in Miami is 32.7 Years.
What is the Average Family Size in Miami
Average Family Size in Miami is 3.1 People.
What is the Average Household Size in Miami
Average Household Size in Miami is 2.5 People.
How Large is the Labor Force in Miami?
There are 5,425 People in the Labor Forcein in Miami.
What is the Percentage of People in the Labor Force in Miami?
54.3% of People are in the Labor Force in Miami.
What is the Unemployment Rate in Miami?
Unemployment Rate in Miami is 3.3%.