Webbers Falls, OK Map & Demographics
Webbers Falls Map
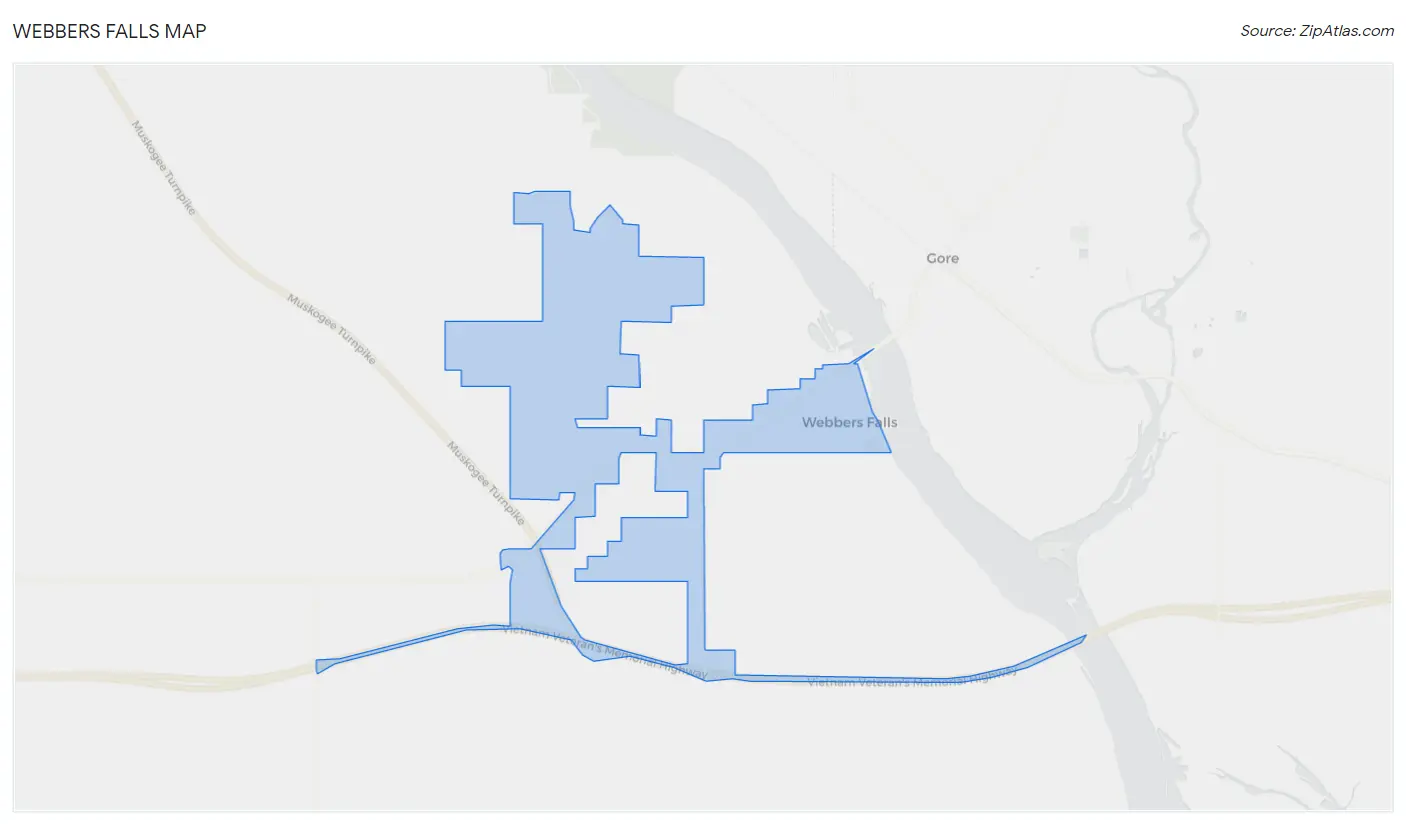
Webbers Falls Overview
$38,116
PER CAPITA INCOME
$86,042
AVG FAMILY INCOME
$64,688
AVG HOUSEHOLD INCOME
5.4%
WAGE / INCOME GAP [ % ]
94.6¢/ $1
WAGE / INCOME GAP [ $ ]
0.54
INEQUALITY / GINI INDEX
393
TOTAL POPULATION
174
MALE POPULATION
219
FEMALE POPULATION
79.45
MALES / 100 FEMALES
125.86
FEMALES / 100 MALES
43.9
MEDIAN AGE
2.5
AVG FAMILY SIZE
2.3
AVG HOUSEHOLD SIZE
151
LABOR FORCE [ PEOPLE ]
46.2%
PERCENT IN LABOR FORCE
17.9%
UNEMPLOYMENT RATE
Webbers Falls Zip Codes
Webbers Falls Area Codes
Income in Webbers Falls
Income Overview in Webbers Falls
Per Capita Income in Webbers Falls is $38,116, while median incomes of families and households are $86,042 and $64,688 respectively.
| Characteristic | Number | Measure |
| Per Capita Income | 393 | $38,116 |
| Median Family Income | 133 | $86,042 |
| Mean Family Income | 133 | $88,101 |
| Median Household Income | 173 | $64,688 |
| Mean Household Income | 173 | $101,535 |
| Income Deficit | 133 | $0 |
| Wage / Income Gap (%) | 393 | 5.43% |
| Wage / Income Gap ($) | 393 | 94.57¢ per $1 |
| Gini / Inequality Index | 393 | 0.54 |
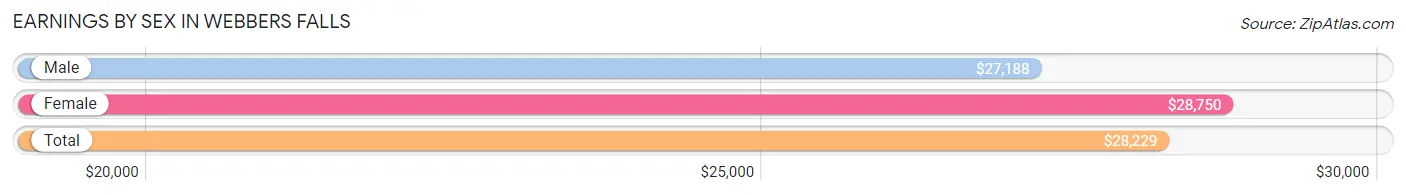
Earnings by Sex in Webbers Falls
Average Earnings in Webbers Falls are $28,229, $27,188 for men and $28,750 for women, a difference of 5.4%.
| Sex | Number | Average Earnings |
| Male | 85 (56.3%) | $27,188 |
| Female | 66 (43.7%) | $28,750 |
| Total | 151 (100.0%) | $28,229 |
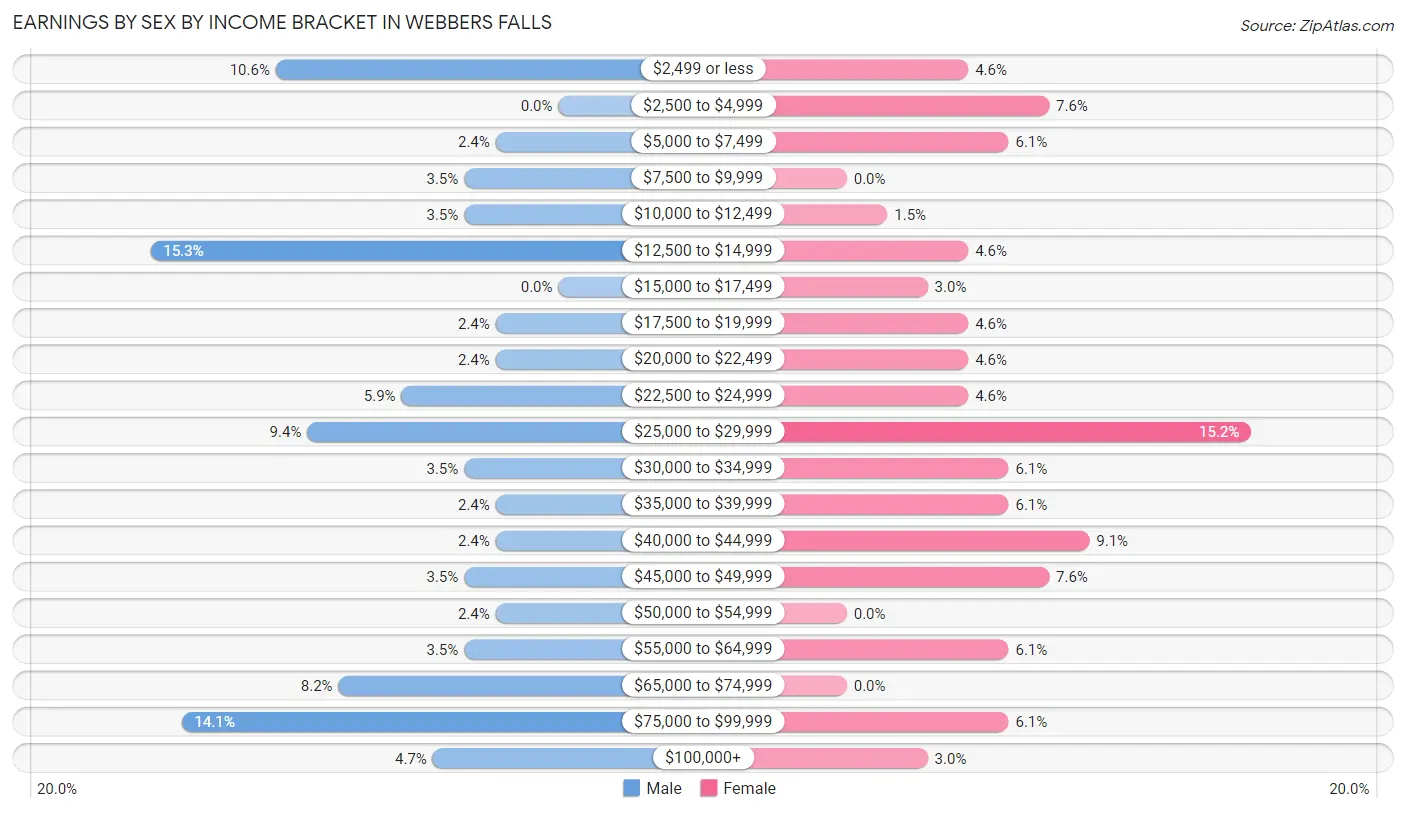
Earnings by Sex by Income Bracket in Webbers Falls
The most common earnings brackets in Webbers Falls are $12,500 to $14,999 for men (13 | 15.3%) and $25,000 to $29,999 for women (10 | 15.1%).
| Income | Male | Female |
| $2,499 or less | 9 (10.6%) | 3 (4.5%) |
| $2,500 to $4,999 | 0 (0.0%) | 5 (7.6%) |
| $5,000 to $7,499 | 2 (2.4%) | 4 (6.1%) |
| $7,500 to $9,999 | 3 (3.5%) | 0 (0.0%) |
| $10,000 to $12,499 | 3 (3.5%) | 1 (1.5%) |
| $12,500 to $14,999 | 13 (15.3%) | 3 (4.5%) |
| $15,000 to $17,499 | 0 (0.0%) | 2 (3.0%) |
| $17,500 to $19,999 | 2 (2.4%) | 3 (4.5%) |
| $20,000 to $22,499 | 2 (2.4%) | 3 (4.5%) |
| $22,500 to $24,999 | 5 (5.9%) | 3 (4.5%) |
| $25,000 to $29,999 | 8 (9.4%) | 10 (15.1%) |
| $30,000 to $34,999 | 3 (3.5%) | 4 (6.1%) |
| $35,000 to $39,999 | 2 (2.4%) | 4 (6.1%) |
| $40,000 to $44,999 | 2 (2.4%) | 6 (9.1%) |
| $45,000 to $49,999 | 3 (3.5%) | 5 (7.6%) |
| $50,000 to $54,999 | 2 (2.4%) | 0 (0.0%) |
| $55,000 to $64,999 | 3 (3.5%) | 4 (6.1%) |
| $65,000 to $74,999 | 7 (8.2%) | 0 (0.0%) |
| $75,000 to $99,999 | 12 (14.1%) | 4 (6.1%) |
| $100,000+ | 4 (4.7%) | 2 (3.0%) |
| Total | 85 (100.0%) | 66 (100.0%) |
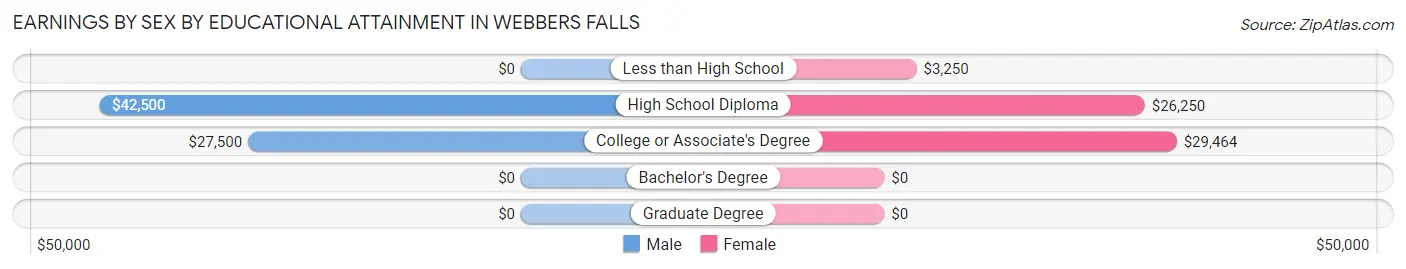
Earnings by Sex by Educational Attainment in Webbers Falls
Average earnings in Webbers Falls are $41,875 for men and $28,750 for women, a difference of 31.3%. Men with an educational attainment of high school diploma enjoy the highest average annual earnings of $42,500, while those with college or associate's degree education earn the least with $27,500. Women with an educational attainment of college or associate's degree earn the most with the average annual earnings of $29,464, while those with less than high school education have the smallest earnings of $3,250.
| Educational Attainment | Male Income | Female Income |
| Less than High School | - | - |
| High School Diploma | $42,500 | $26,250 |
| College or Associate's Degree | $27,500 | $29,464 |
| Bachelor's Degree | - | - |
| Graduate Degree | - | - |
| Total | $41,875 | $28,750 |
Family Income in Webbers Falls
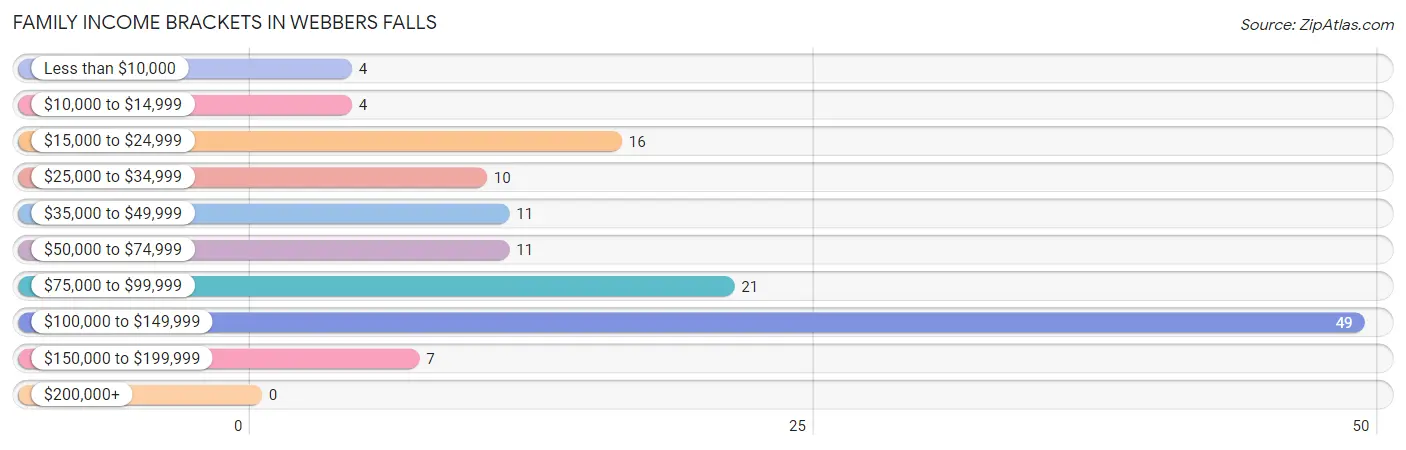
Family Income Brackets in Webbers Falls
According to the Webbers Falls family income data, there are 49 families falling into the $100,000 to $149,999 income range, which is the most common income bracket and makes up 36.8% of all families.
| Income Bracket | # Families | % Families |
| Less than $10,000 | 4 | 3.0% |
| $10,000 to $14,999 | 4 | 3.0% |
| $15,000 to $24,999 | 16 | 12.0% |
| $25,000 to $34,999 | 10 | 7.5% |
| $35,000 to $49,999 | 11 | 8.3% |
| $50,000 to $74,999 | 11 | 8.3% |
| $75,000 to $99,999 | 21 | 15.8% |
| $100,000 to $149,999 | 49 | 36.8% |
| $150,000 to $199,999 | 7 | 5.3% |
| $200,000+ | 0 | 0.0% |
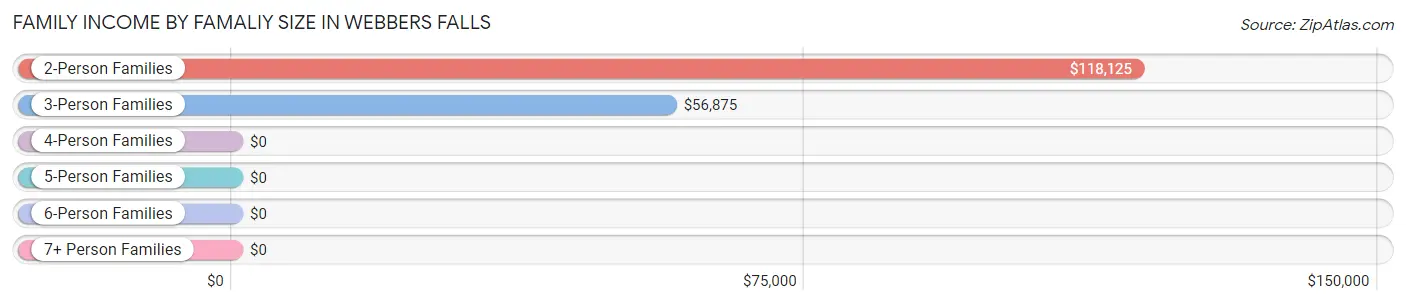
Family Income by Famaliy Size in Webbers Falls
2-person families (89 | 66.9%) account for the highest median family income in Webbers Falls with $118,125 per family, while 2-person families (89 | 66.9%) have the highest median income of $59,062 per family member.
| Income Bracket | # Families | Median Income |
| 2-Person Families | 89 (66.9%) | $118,125 |
| 3-Person Families | 23 (17.3%) | $56,875 |
| 4-Person Families | 8 (6.0%) | $0 |
| 5-Person Families | 4 (3.0%) | $0 |
| 6-Person Families | 7 (5.3%) | $0 |
| 7+ Person Families | 2 (1.5%) | $0 |
| Total | 133 (100.0%) | $86,042 |
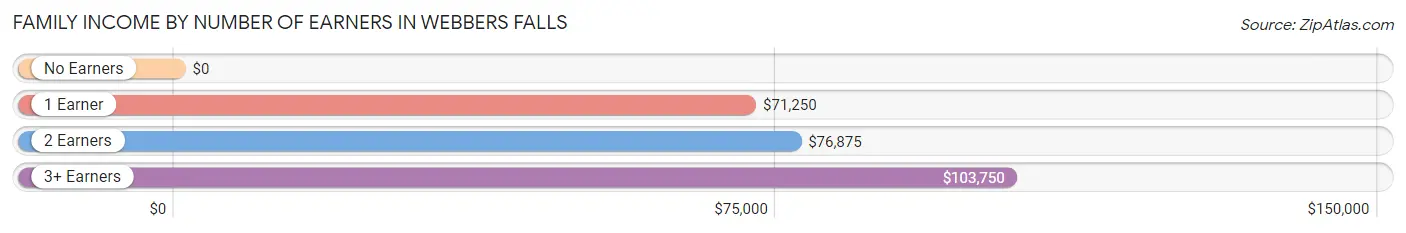
Family Income by Number of Earners in Webbers Falls
| Number of Earners | # Families | Median Income |
| No Earners | 56 (42.1%) | $0 |
| 1 Earner | 44 (33.1%) | $71,250 |
| 2 Earners | 27 (20.3%) | $76,875 |
| 3+ Earners | 6 (4.5%) | $103,750 |
| Total | 133 (100.0%) | $86,042 |
Household Income in Webbers Falls
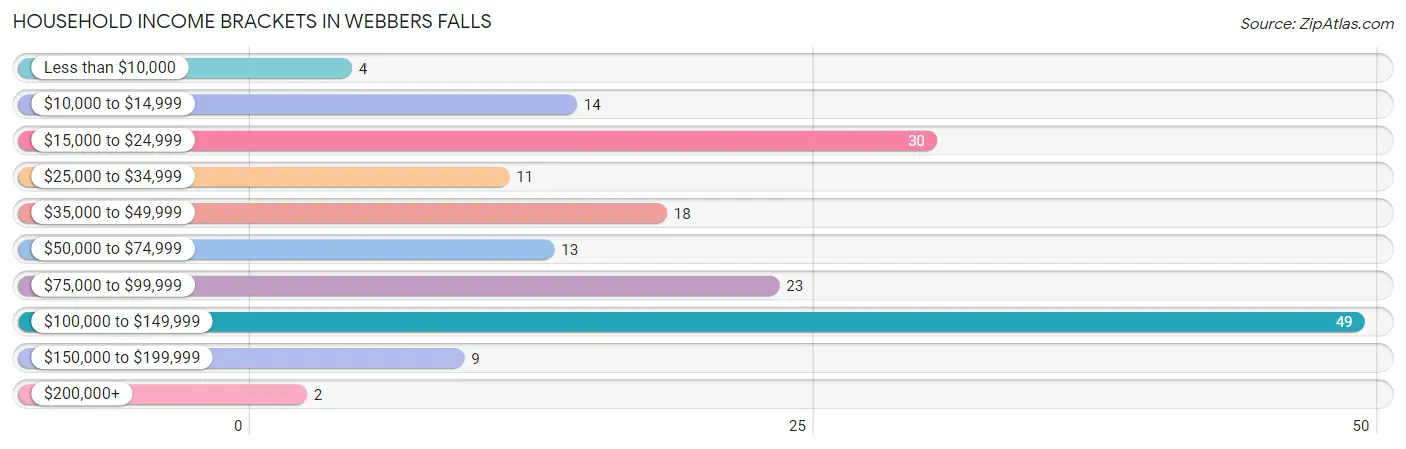
Household Income Brackets in Webbers Falls
With 49 households falling in the category, the $100,000 to $149,999 income range is the most frequent in Webbers Falls, accounting for 28.3% of all households. In contrast, only 2 households (1.2%) fall into the $200,000+ income bracket, making it the least populous group.
| Income Bracket | # Households | % Households |
| Less than $10,000 | 4 | 2.3% |
| $10,000 to $14,999 | 14 | 8.1% |
| $15,000 to $24,999 | 30 | 17.3% |
| $25,000 to $34,999 | 11 | 6.4% |
| $35,000 to $49,999 | 18 | 10.4% |
| $50,000 to $74,999 | 13 | 7.5% |
| $75,000 to $99,999 | 23 | 13.3% |
| $100,000 to $149,999 | 49 | 28.3% |
| $150,000 to $199,999 | 9 | 5.2% |
| $200,000+ | 2 | 1.2% |
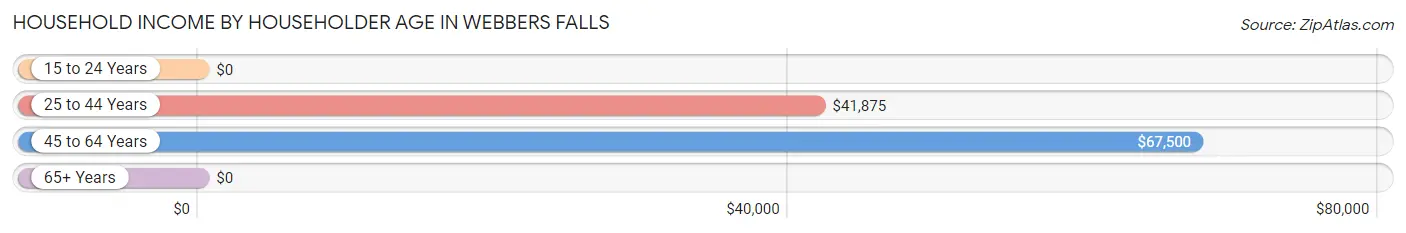
Household Income by Householder Age in Webbers Falls
The median household income in Webbers Falls is $64,688, with the highest median household income of $67,500 found in the 45 to 64 years age bracket for the primary householder. A total of 50 households (28.9%) fall into this category. Meanwhile, the 15 to 24 years age bracket for the primary householder has the lowest median household income of $0, with 2 households (1.2%) in this group.
| Income Bracket | # Households | Median Income |
| 15 to 24 Years | 2 (1.2%) | $0 |
| 25 to 44 Years | 49 (28.3%) | $41,875 |
| 45 to 64 Years | 50 (28.9%) | $67,500 |
| 65+ Years | 72 (41.6%) | $0 |
| Total | 173 (100.0%) | $64,688 |
Poverty in Webbers Falls
Income Below Poverty by Sex and Age in Webbers Falls
With 21.3% poverty level for males and 23.3% for females among the residents of Webbers Falls, 6 to 11 year old males and 18 to 24 year old females are the most vulnerable to poverty, with 7 males (77.8%) and 9 females (100.0%) in their respective age groups living below the poverty level.
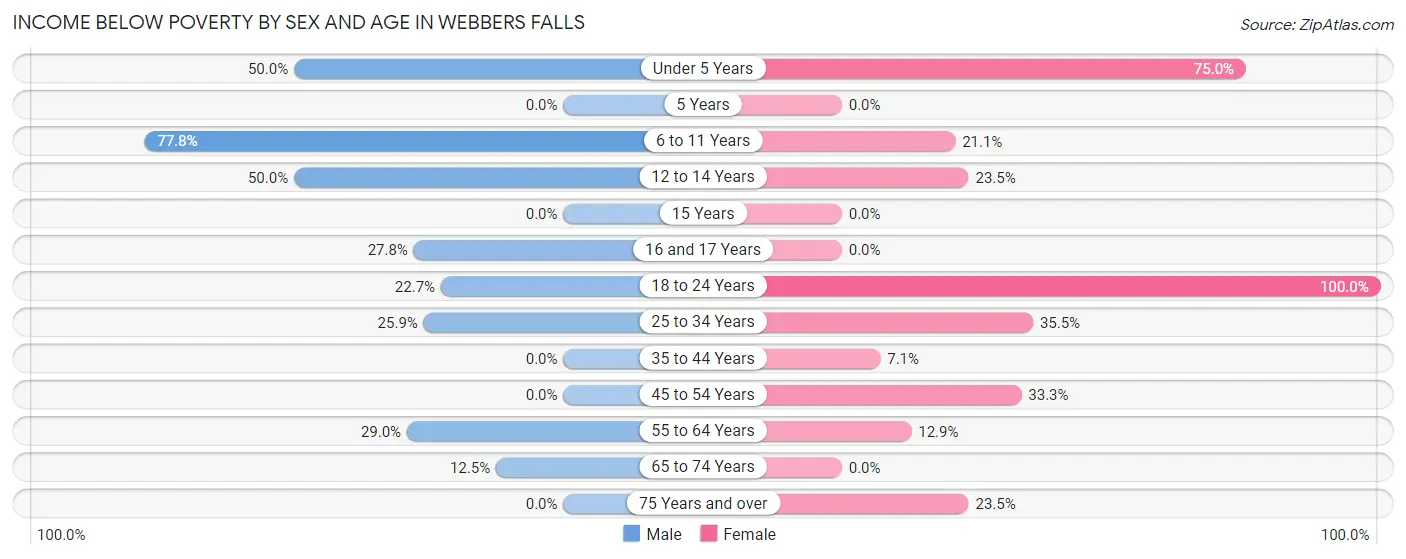
| Age Bracket | Male | Female |
| Under 5 Years | 1 (50.0%) | 9 (75.0%) |
| 5 Years | 0 (0.0%) | 0 (0.0%) |
| 6 to 11 Years | 7 (77.8%) | 4 (21.0%) |
| 12 to 14 Years | 1 (50.0%) | 4 (23.5%) |
| 15 Years | 0 (0.0%) | 0 (0.0%) |
| 16 and 17 Years | 5 (27.8%) | 0 (0.0%) |
| 18 to 24 Years | 5 (22.7%) | 9 (100.0%) |
| 25 to 34 Years | 7 (25.9%) | 11 (35.5%) |
| 35 to 44 Years | 0 (0.0%) | 1 (7.1%) |
| 45 to 54 Years | 0 (0.0%) | 5 (33.3%) |
| 55 to 64 Years | 9 (29.0%) | 4 (12.9%) |
| 65 to 74 Years | 2 (12.5%) | 0 (0.0%) |
| 75 Years and over | 0 (0.0%) | 4 (23.5%) |
| Total | 37 (21.3%) | 51 (23.3%) |
Income Above Poverty by Sex and Age in Webbers Falls
According to the poverty statistics in Webbers Falls, males aged 5 years and females aged 15 years are the age groups that are most secure financially, with 100.0% of males and 100.0% of females in these age groups living above the poverty line.
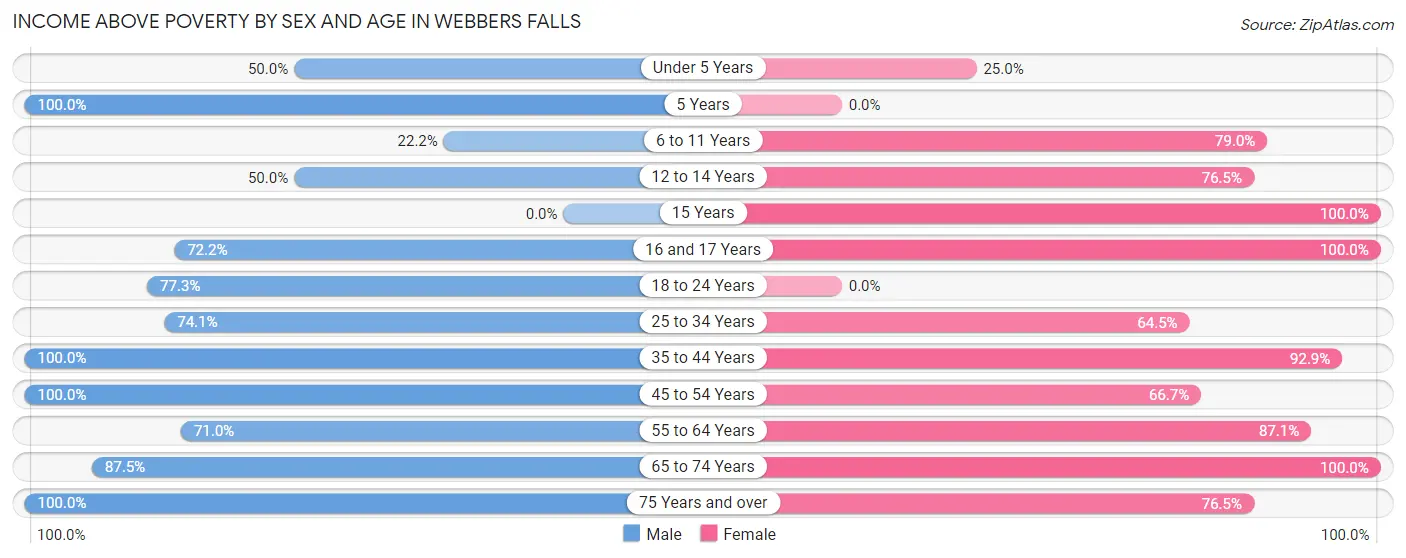
| Age Bracket | Male | Female |
| Under 5 Years | 1 (50.0%) | 3 (25.0%) |
| 5 Years | 2 (100.0%) | 0 (0.0%) |
| 6 to 11 Years | 2 (22.2%) | 15 (78.9%) |
| 12 to 14 Years | 1 (50.0%) | 13 (76.5%) |
| 15 Years | 0 (0.0%) | 3 (100.0%) |
| 16 and 17 Years | 13 (72.2%) | 5 (100.0%) |
| 18 to 24 Years | 17 (77.3%) | 0 (0.0%) |
| 25 to 34 Years | 20 (74.1%) | 20 (64.5%) |
| 35 to 44 Years | 16 (100.0%) | 13 (92.9%) |
| 45 to 54 Years | 8 (100.0%) | 10 (66.7%) |
| 55 to 64 Years | 22 (71.0%) | 27 (87.1%) |
| 65 to 74 Years | 14 (87.5%) | 46 (100.0%) |
| 75 Years and over | 21 (100.0%) | 13 (76.5%) |
| Total | 137 (78.7%) | 168 (76.7%) |
Income Below Poverty Among Married-Couple Families in Webbers Falls
The poverty statistics for married-couple families in Webbers Falls show that 6.3% or 6 of the total 95 families live below the poverty line. Families with 1 or 2 children have the highest poverty rate of 33.3%, comprising of 4 families. On the other hand, families with 3 or 4 children have the lowest poverty rate of 0.0%, which includes 0 families.
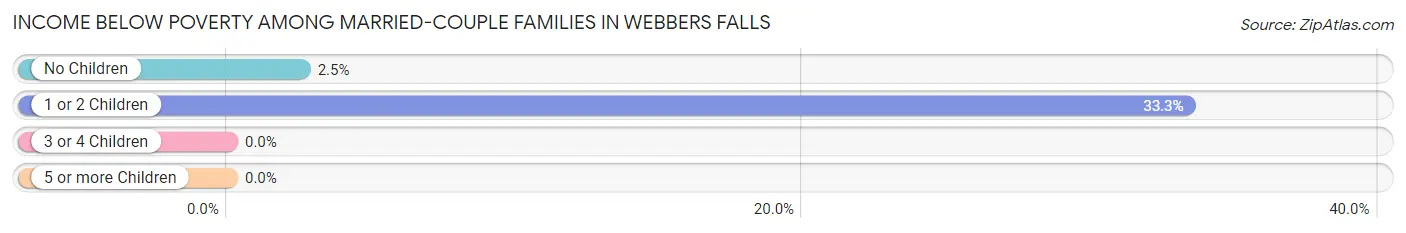
| Children | Above Poverty | Below Poverty |
| No Children | 77 (97.5%) | 2 (2.5%) |
| 1 or 2 Children | 8 (66.7%) | 4 (33.3%) |
| 3 or 4 Children | 4 (100.0%) | 0 (0.0%) |
| 5 or more Children | 0 (0.0%) | 0 (0.0%) |
| Total | 89 (93.7%) | 6 (6.3%) |
Income Below Poverty Among Single-Parent Households in Webbers Falls
According to the poverty data in Webbers Falls, 10.0% or 2 single-father households and 55.6% or 10 single-mother households are living below the poverty line. Among single-father households, those with 1 or 2 children have the highest poverty rate, with 2 households (14.3%) experiencing poverty. Likewise, among single-mother households, those with no children have the highest poverty rate, with 3 households (100.0%) falling below the poverty line.
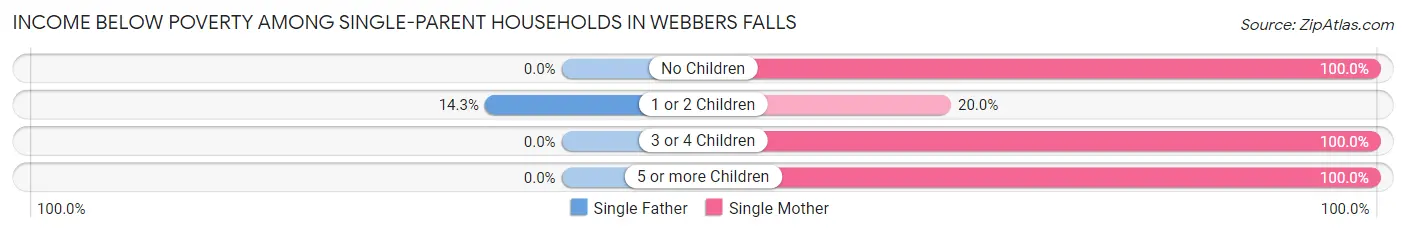
| Children | Single Father | Single Mother |
| No Children | 0 (0.0%) | 3 (100.0%) |
| 1 or 2 Children | 2 (14.3%) | 2 (20.0%) |
| 3 or 4 Children | 0 (0.0%) | 4 (100.0%) |
| 5 or more Children | 0 (0.0%) | 1 (100.0%) |
| Total | 2 (10.0%) | 10 (55.6%) |
Income Below Poverty Among Married-Couple vs Single-Parent Households in Webbers Falls
The poverty data for Webbers Falls shows that 6 of the married-couple family households (6.3%) and 12 of the single-parent households (31.6%) are living below the poverty level. Within the married-couple family households, those with 1 or 2 children have the highest poverty rate, with 4 households (33.3%) falling below the poverty line. Among the single-parent households, those with 3 or 4 children have the highest poverty rate, with 4 household (100.0%) living below poverty.
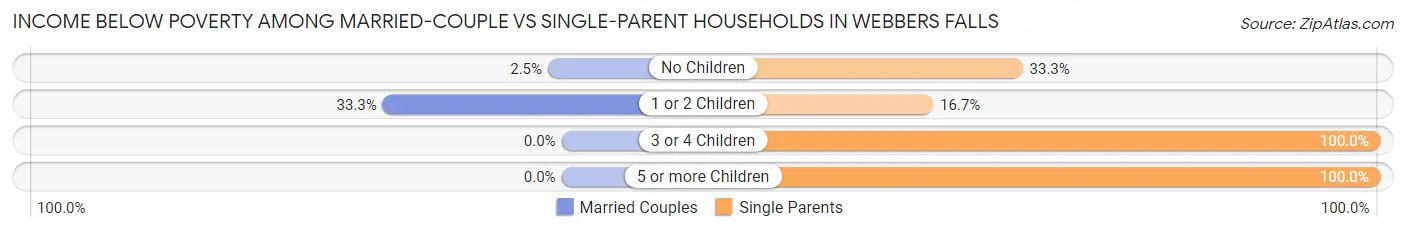
| Children | Married-Couple Families | Single-Parent Households |
| No Children | 2 (2.5%) | 3 (33.3%) |
| 1 or 2 Children | 4 (33.3%) | 4 (16.7%) |
| 3 or 4 Children | 0 (0.0%) | 4 (100.0%) |
| 5 or more Children | 0 (0.0%) | 1 (100.0%) |
| Total | 6 (6.3%) | 12 (31.6%) |
Race in Webbers Falls
The most populous races in Webbers Falls are White / Caucasian (252 | 64.1%), Native / Alaskan (97 | 24.7%), and Two or more Races (44 | 11.2%).
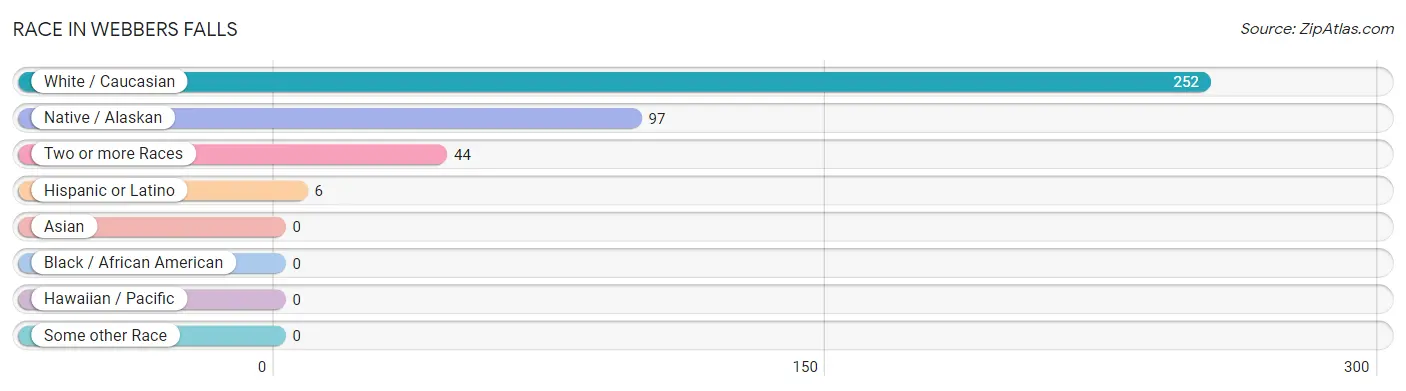
| Race | # Population | % Population |
| Asian | 0 | 0.0% |
| Black / African American | 0 | 0.0% |
| Hawaiian / Pacific | 0 | 0.0% |
| Hispanic or Latino | 6 | 1.5% |
| Native / Alaskan | 97 | 24.7% |
| White / Caucasian | 252 | 64.1% |
| Two or more Races | 44 | 11.2% |
| Some other Race | 0 | 0.0% |
| Total | 393 | 100.0% |
Ancestry in Webbers Falls
The most populous ancestries reported in Webbers Falls are Cherokee (130 | 33.1%), American (100 | 25.5%), English (40 | 10.2%), Irish (40 | 10.2%), and German (18 | 4.6%), together accounting for 83.5% of all Webbers Falls residents.
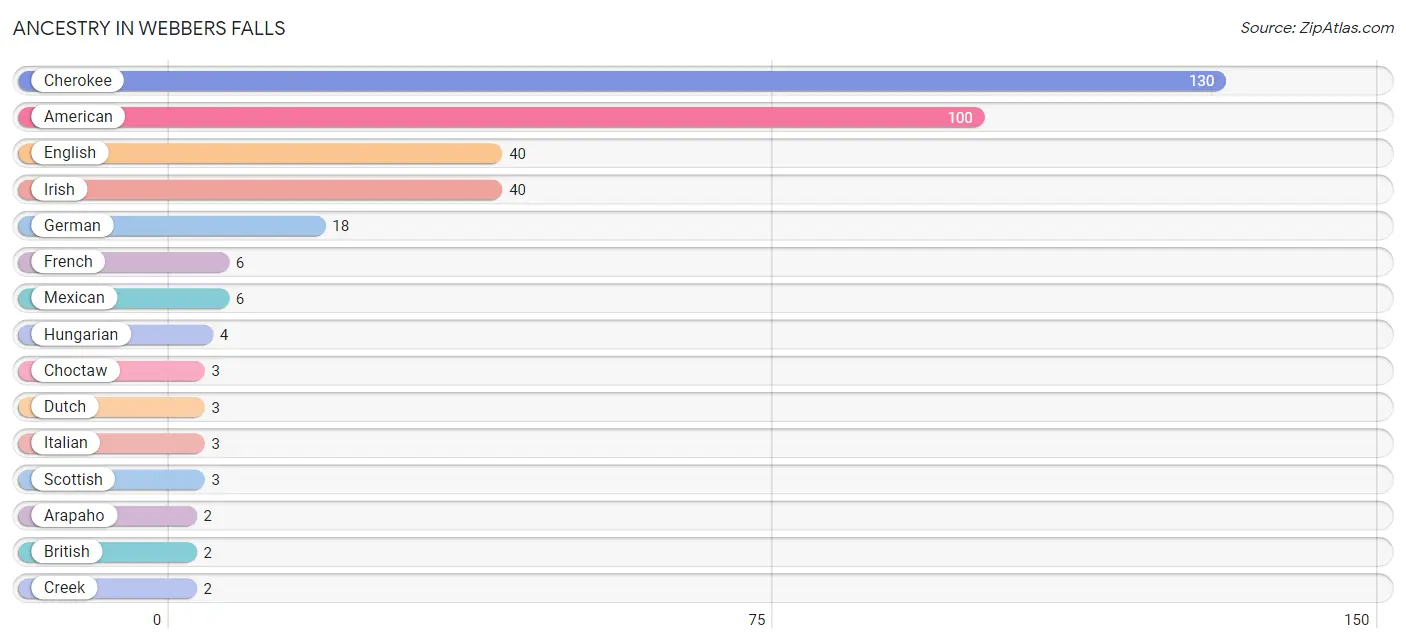
| Ancestry | # Population | % Population |
| American | 100 | 25.5% |
| Arapaho | 2 | 0.5% |
| British | 2 | 0.5% |
| Cherokee | 130 | 33.1% |
| Choctaw | 3 | 0.8% |
| Creek | 2 | 0.5% |
| Dutch | 3 | 0.8% |
| Eastern European | 1 | 0.3% |
| English | 40 | 10.2% |
| European | 1 | 0.3% |
| French | 6 | 1.5% |
| German | 18 | 4.6% |
| Hungarian | 4 | 1.0% |
| Irish | 40 | 10.2% |
| Italian | 3 | 0.8% |
| Mexican | 6 | 1.5% |
| Scottish | 3 | 0.8% |
| Sioux | 2 | 0.5% |
| Yugoslavian | 1 | 0.3% | View All 19 Rows |
Immigrants in Webbers Falls
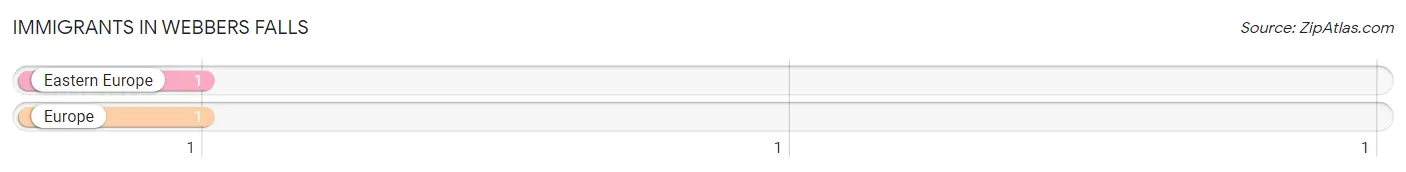
The most numerous immigrant groups reported in Webbers Falls came from Eastern Europe (1 | 0.3%), and Europe (1 | 0.3%), together accounting for 0.5% of all Webbers Falls residents.
| Immigration Origin | # Population | % Population |
| Eastern Europe | 1 | 0.3% |
| Europe | 1 | 0.3% | View All 2 Rows |
Sex and Age in Webbers Falls
Sex and Age in Webbers Falls
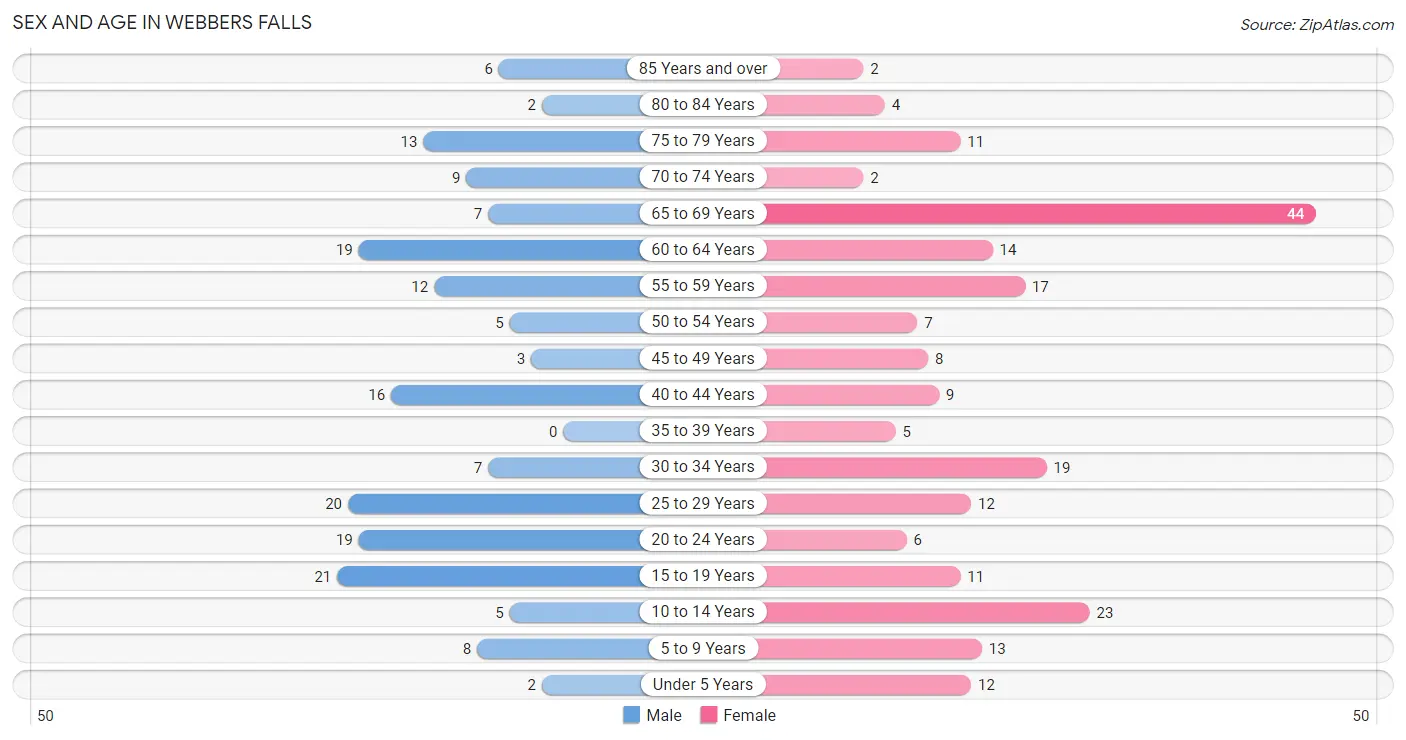
The most populous age groups in Webbers Falls are 15 to 19 Years (21 | 12.1%) for men and 65 to 69 Years (44 | 20.1%) for women.
| Age Bracket | Male | Female |
| Under 5 Years | 2 (1.1%) | 12 (5.5%) |
| 5 to 9 Years | 8 (4.6%) | 13 (5.9%) |
| 10 to 14 Years | 5 (2.9%) | 23 (10.5%) |
| 15 to 19 Years | 21 (12.1%) | 11 (5.0%) |
| 20 to 24 Years | 19 (10.9%) | 6 (2.7%) |
| 25 to 29 Years | 20 (11.5%) | 12 (5.5%) |
| 30 to 34 Years | 7 (4.0%) | 19 (8.7%) |
| 35 to 39 Years | 0 (0.0%) | 5 (2.3%) |
| 40 to 44 Years | 16 (9.2%) | 9 (4.1%) |
| 45 to 49 Years | 3 (1.7%) | 8 (3.6%) |
| 50 to 54 Years | 5 (2.9%) | 7 (3.2%) |
| 55 to 59 Years | 12 (6.9%) | 17 (7.8%) |
| 60 to 64 Years | 19 (10.9%) | 14 (6.4%) |
| 65 to 69 Years | 7 (4.0%) | 44 (20.1%) |
| 70 to 74 Years | 9 (5.2%) | 2 (0.9%) |
| 75 to 79 Years | 13 (7.5%) | 11 (5.0%) |
| 80 to 84 Years | 2 (1.1%) | 4 (1.8%) |
| 85 Years and over | 6 (3.5%) | 2 (0.9%) |
| Total | 174 (100.0%) | 219 (100.0%) |
Families and Households in Webbers Falls
Median Family Size in Webbers Falls
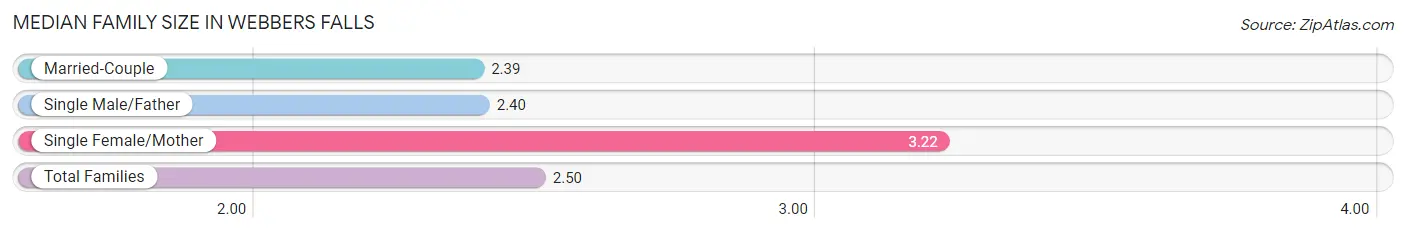
The median family size in Webbers Falls is 2.50 persons per family, with single female/mother families (18 | 13.5%) accounting for the largest median family size of 3.22 persons per family. On the other hand, married-couple families (95 | 71.4%) represent the smallest median family size with 2.39 persons per family.
| Family Type | # Families | Family Size |
| Married-Couple | 95 (71.4%) | 2.39 |
| Single Male/Father | 20 (15.0%) | 2.40 |
| Single Female/Mother | 18 (13.5%) | 3.22 |
| Total Families | 133 (100.0%) | 2.50 |
Median Household Size in Webbers Falls
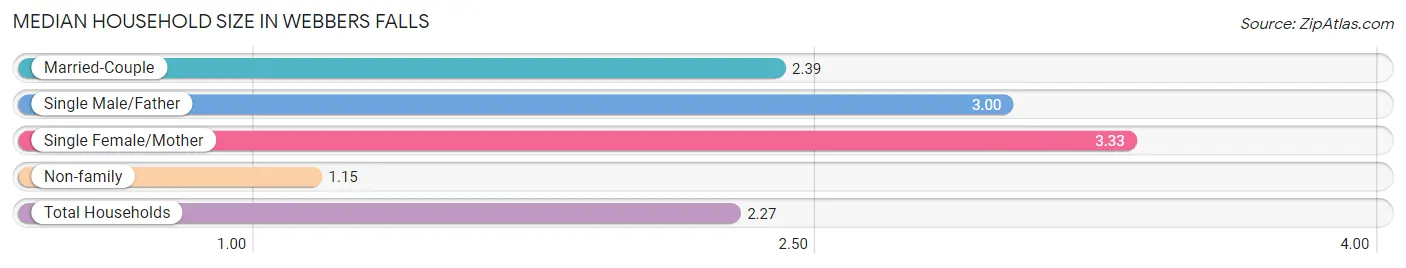
The median household size in Webbers Falls is 2.27 persons per household, with single female/mother households (18 | 10.4%) accounting for the largest median household size of 3.33 persons per household. non-family households (40 | 23.1%) represent the smallest median household size with 1.15 persons per household.
| Household Type | # Households | Household Size |
| Married-Couple | 95 (54.9%) | 2.39 |
| Single Male/Father | 20 (11.6%) | 3.00 |
| Single Female/Mother | 18 (10.4%) | 3.33 |
| Non-family | 40 (23.1%) | 1.15 |
| Total Households | 173 (100.0%) | 2.27 |
Household Size by Marriage Status in Webbers Falls
Out of a total of 173 households in Webbers Falls, 133 (76.9%) are family households, while 40 (23.1%) are nonfamily households. The most numerous type of family households are 2-person households, comprising 85, and the most common type of nonfamily households are 1-person households, comprising 34.
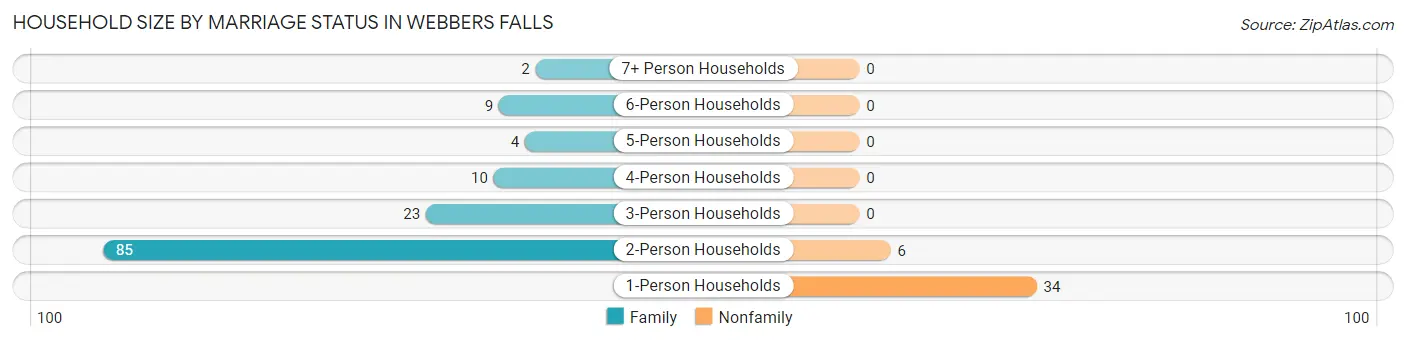
| Household Size | Family Households | Nonfamily Households |
| 1-Person Households | - | 34 (19.7%) |
| 2-Person Households | 85 (49.1%) | 6 (3.5%) |
| 3-Person Households | 23 (13.3%) | 0 (0.0%) |
| 4-Person Households | 10 (5.8%) | 0 (0.0%) |
| 5-Person Households | 4 (2.3%) | 0 (0.0%) |
| 6-Person Households | 9 (5.2%) | 0 (0.0%) |
| 7+ Person Households | 2 (1.2%) | 0 (0.0%) |
| Total | 133 (76.9%) | 40 (23.1%) |
Female Fertility in Webbers Falls
Fertility by Age in Webbers Falls
Average fertility rate in Webbers Falls is 28.0 births per 1,000 women. Women in the age bracket of 20 to 34 years have the highest fertility rate with 54.0 births per 1,000 women. Women in the age bracket of 20 to 34 years acount for 100.0% of all women with births.
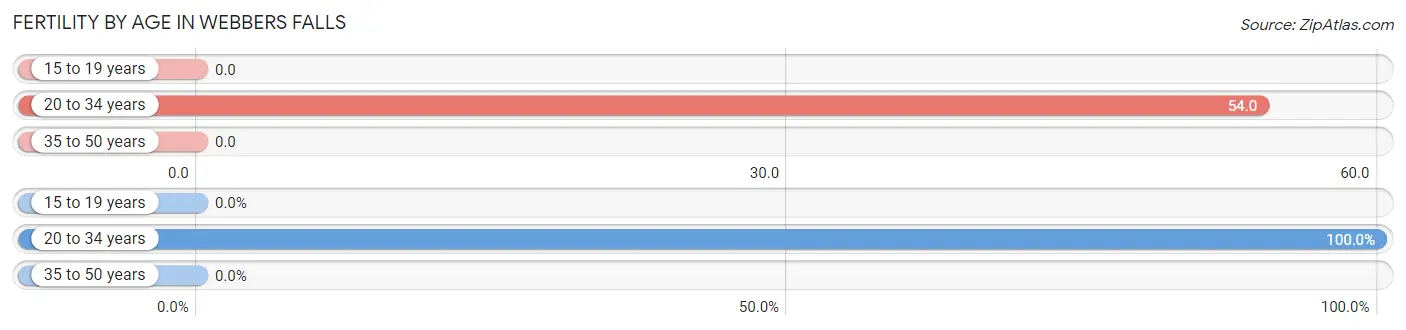
| Age Bracket | Women with Births | Births / 1,000 Women |
| 15 to 19 years | 0 (0.0%) | 0.0 |
| 20 to 34 years | 2 (100.0%) | 54.0 |
| 35 to 50 years | 0 (0.0%) | 0.0 |
| Total | 2 (100.0%) | 28.0 |
Fertility by Age by Marriage Status in Webbers Falls
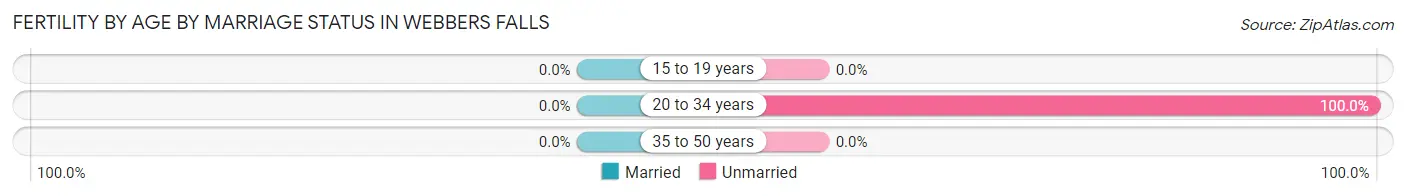
| Age Bracket | Married | Unmarried |
| 15 to 19 years | 0 (0.0%) | 0 (0.0%) |
| 20 to 34 years | 0 (0.0%) | 2 (100.0%) |
| 35 to 50 years | 0 (0.0%) | 0 (0.0%) |
| Total | 0 (0.0%) | 2 (100.0%) |
Fertility by Education in Webbers Falls
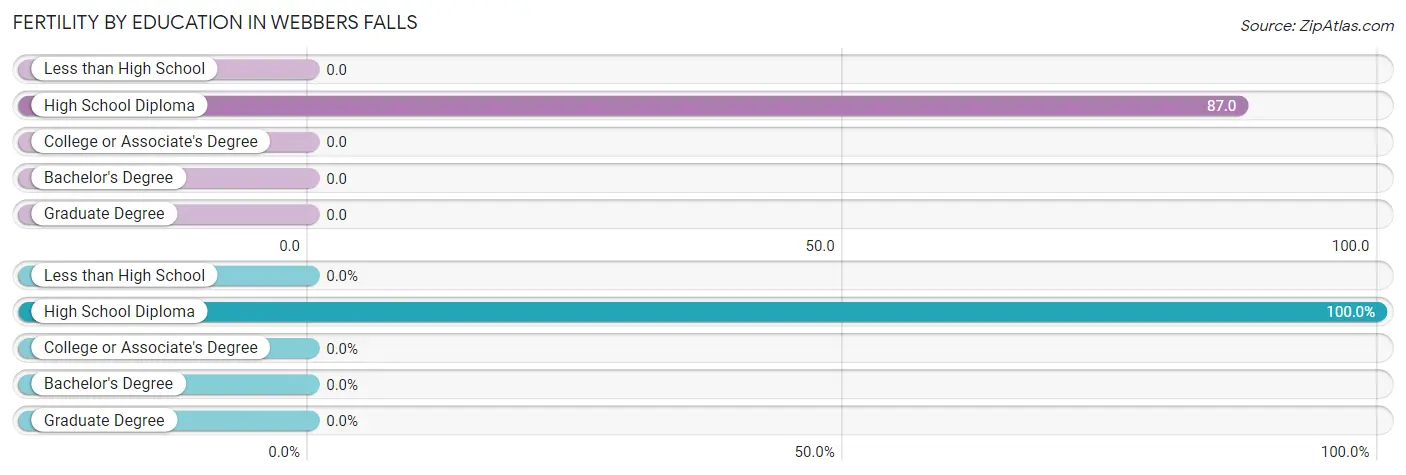
| Educational Attainment | Women with Births | Births / 1,000 Women |
| Less than High School | 0 (0.0%) | 0.0 |
| High School Diploma | 2 (100.0%) | 87.0 |
| College or Associate's Degree | 0 (0.0%) | 0.0 |
| Bachelor's Degree | 0 (0.0%) | 0.0 |
| Graduate Degree | 0 (0.0%) | 0.0 |
| Total | 2 (100.0%) | 28.0 |
Fertility by Education by Marriage Status in Webbers Falls
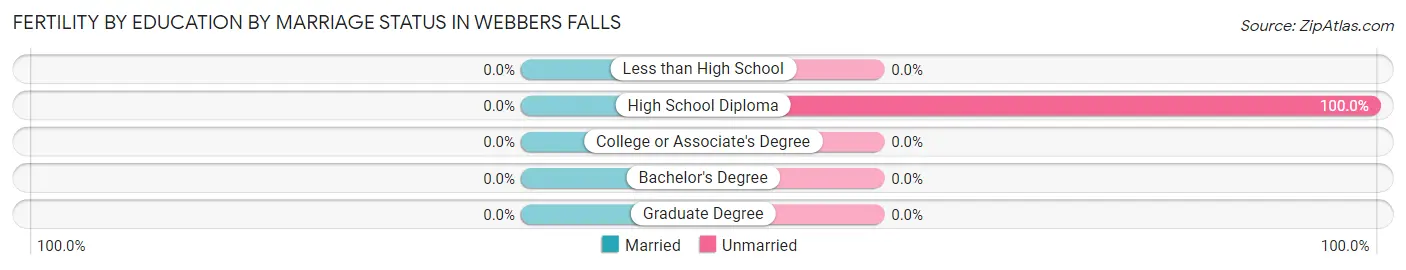
| Educational Attainment | Married | Unmarried |
| Less than High School | 0 (0.0%) | 0 (0.0%) |
| High School Diploma | 0 (0.0%) | 2 (100.0%) |
| College or Associate's Degree | 0 (0.0%) | 0 (0.0%) |
| Bachelor's Degree | 0 (0.0%) | 0 (0.0%) |
| Graduate Degree | 0 (0.0%) | 0 (0.0%) |
| Total | 0 (0.0%) | 2 (100.0%) |
Employment Characteristics in Webbers Falls
Employment by Class of Employer in Webbers Falls
Among the 122 employed individuals in Webbers Falls, private company employees (78 | 63.9%), local government employees (18 | 14.7%), and self-employed (not incorporated) (8 | 6.6%) make up the most common classes of employment.
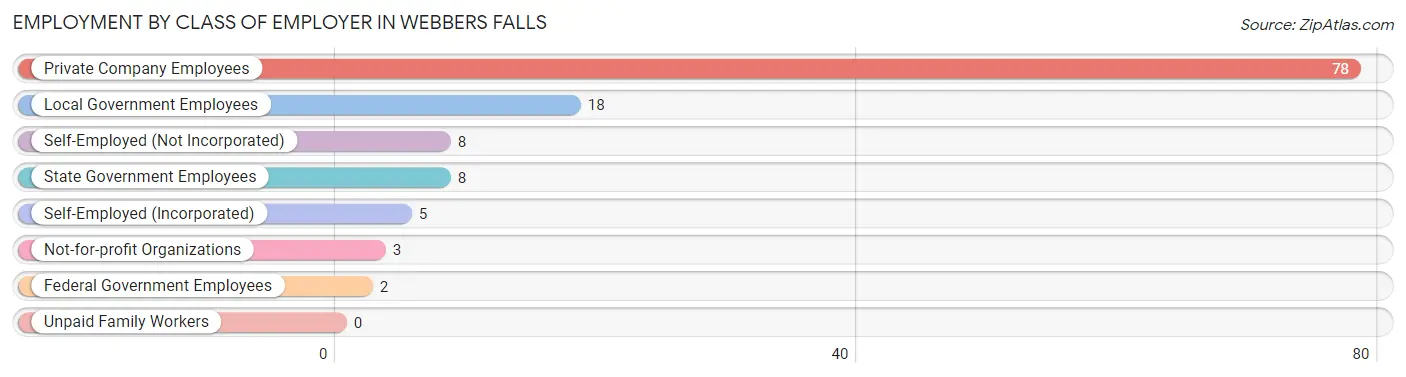
| Employer Class | # Employees | % Employees |
| Private Company Employees | 78 | 63.9% |
| Self-Employed (Incorporated) | 5 | 4.1% |
| Self-Employed (Not Incorporated) | 8 | 6.6% |
| Not-for-profit Organizations | 3 | 2.5% |
| Local Government Employees | 18 | 14.7% |
| State Government Employees | 8 | 6.6% |
| Federal Government Employees | 2 | 1.6% |
| Unpaid Family Workers | 0 | 0.0% |
| Total | 122 | 100.0% |
Employment Status by Age in Webbers Falls
According to the labor force statistics for Webbers Falls, out of the total population over 16 years of age (327), 46.2% or 151 individuals are in the labor force, with 17.9% or 27 of them unemployed. The age group with the highest labor force participation rate is 25 to 29 years, with 100.0% or 32 individuals in the labor force. Within the labor force, the 16 to 19 years age range has the highest percentage of unemployed individuals, with 57.1% or 4 of them being unemployed.
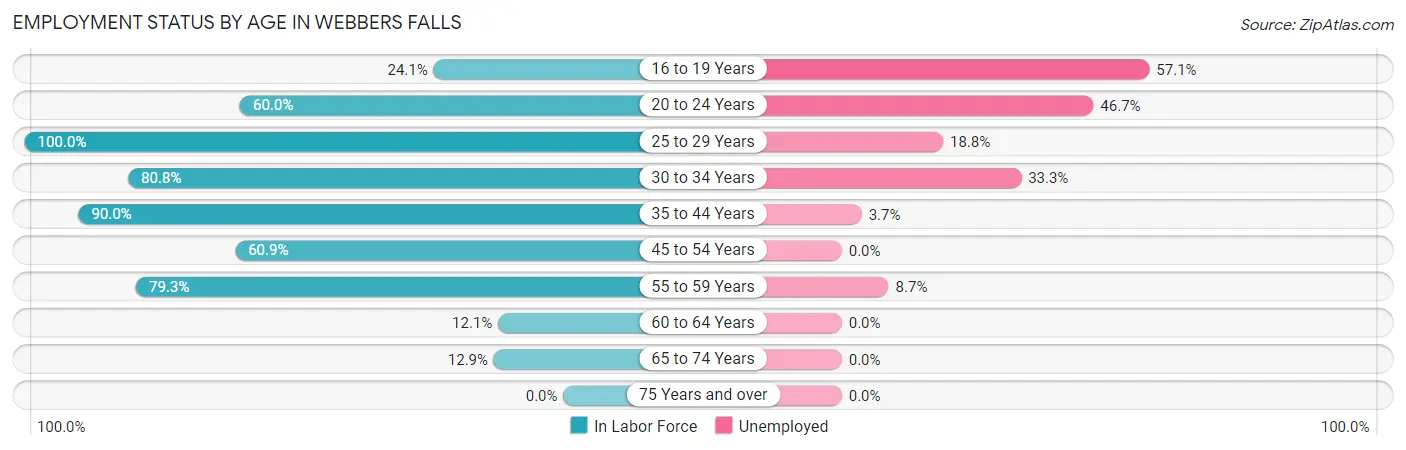
| Age Bracket | In Labor Force | Unemployed |
| 16 to 19 Years | 7 (24.1%) | 4 (57.1%) |
| 20 to 24 Years | 15 (60.0%) | 7 (46.7%) |
| 25 to 29 Years | 32 (100.0%) | 6 (18.8%) |
| 30 to 34 Years | 21 (80.8%) | 7 (33.3%) |
| 35 to 44 Years | 27 (90.0%) | 1 (3.7%) |
| 45 to 54 Years | 14 (60.9%) | 0 (0.0%) |
| 55 to 59 Years | 23 (79.3%) | 2 (8.7%) |
| 60 to 64 Years | 4 (12.1%) | 0 (0.0%) |
| 65 to 74 Years | 8 (12.9%) | 0 (0.0%) |
| 75 Years and over | 0 (0.0%) | 0 (0.0%) |
| Total | 151 (46.2%) | 27 (17.9%) |
Employment Status by Educational Attainment in Webbers Falls
According to labor force statistics for Webbers Falls, 69.9% of individuals (121) out of the total population between 25 and 64 years of age (173) are in the labor force, with 13.2% or 16 of them being unemployed. The group with the highest labor force participation rate are those with the educational attainment of high school diploma, with 79.7% or 47 individuals in the labor force. Within the labor force, individuals with less than high school education have the highest percentage of unemployment, with 58.3% or 7 of them being unemployed.
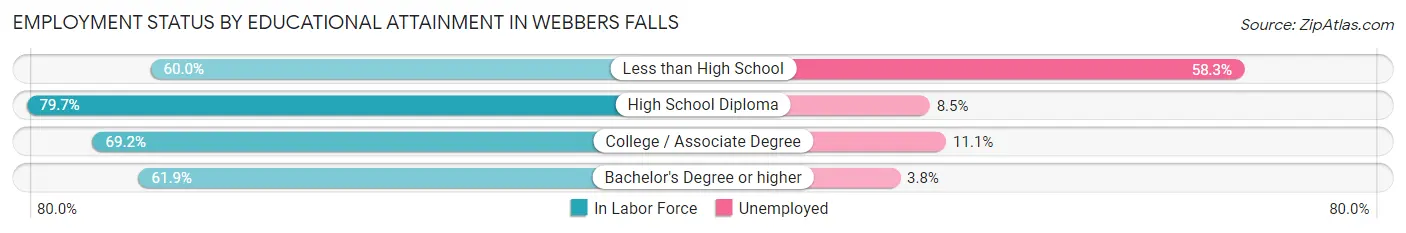
| Educational Attainment | In Labor Force | Unemployed |
| Less than High School | 12 (60.0%) | 12 (58.3%) |
| High School Diploma | 47 (79.7%) | 5 (8.5%) |
| College / Associate Degree | 36 (69.2%) | 6 (11.1%) |
| Bachelor's Degree or higher | 26 (61.9%) | 2 (3.8%) |
| Total | 121 (69.9%) | 23 (13.2%) |
Employment Occupations by Sex in Webbers Falls
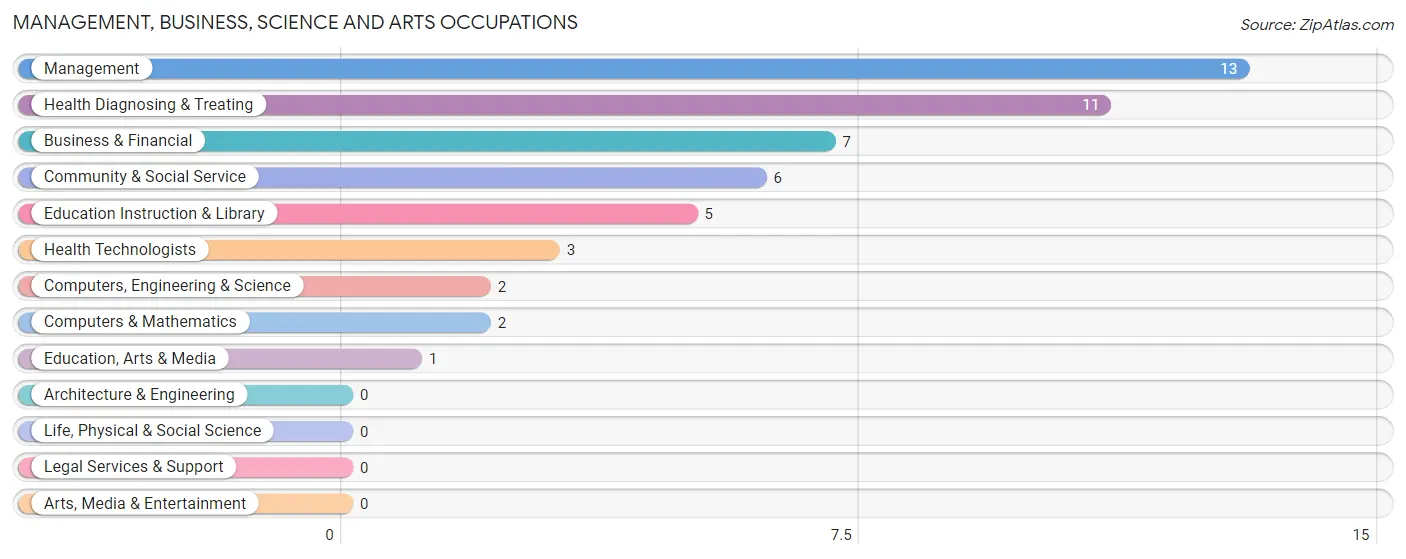
Management, Business, Science and Arts Occupations
The most common Management, Business, Science and Arts occupations in Webbers Falls are Management (13 | 10.5%), Health Diagnosing & Treating (11 | 8.9%), Business & Financial (7 | 5.7%), Community & Social Service (6 | 4.8%), and Education Instruction & Library (5 | 4.0%).
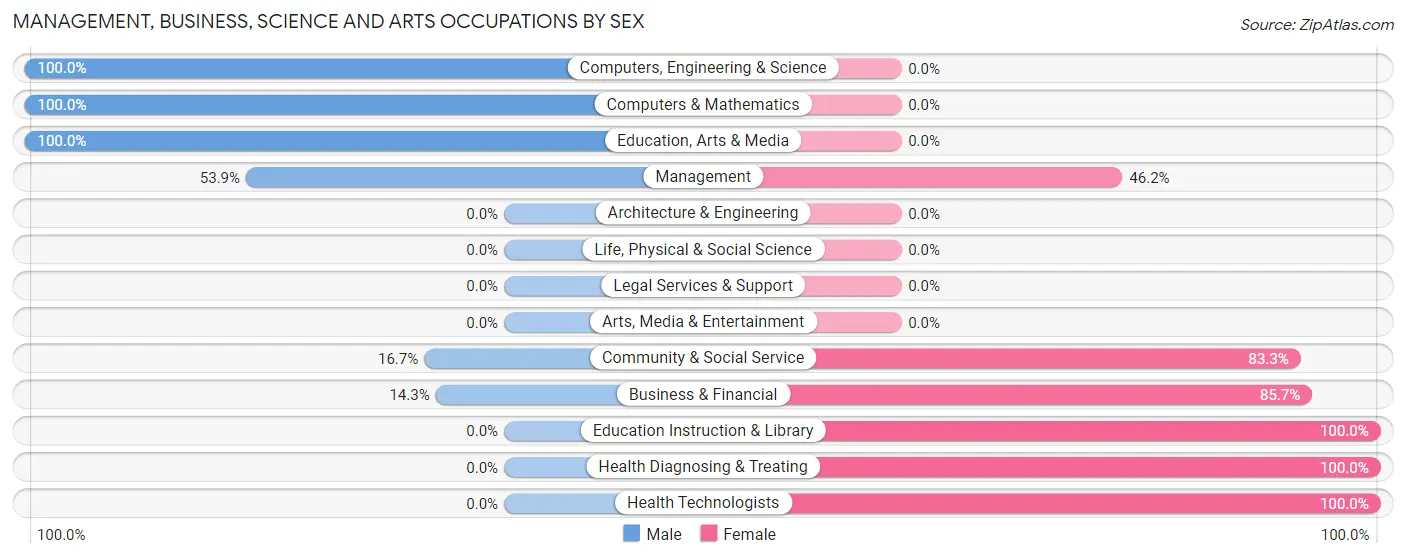
Management, Business, Science and Arts Occupations by Sex
Within the Management, Business, Science and Arts occupations in Webbers Falls, the most male-oriented occupations are Computers, Engineering & Science (100.0%), Computers & Mathematics (100.0%), and Education, Arts & Media (100.0%), while the most female-oriented occupations are Education Instruction & Library (100.0%), Health Diagnosing & Treating (100.0%), and Health Technologists (100.0%).
| Occupation | Male | Female |
| Management | 7 (53.8%) | 6 (46.2%) |
| Business & Financial | 1 (14.3%) | 6 (85.7%) |
| Computers, Engineering & Science | 2 (100.0%) | 0 (0.0%) |
| Computers & Mathematics | 2 (100.0%) | 0 (0.0%) |
| Architecture & Engineering | 0 (0.0%) | 0 (0.0%) |
| Life, Physical & Social Science | 0 (0.0%) | 0 (0.0%) |
| Community & Social Service | 1 (16.7%) | 5 (83.3%) |
| Education, Arts & Media | 1 (100.0%) | 0 (0.0%) |
| Legal Services & Support | 0 (0.0%) | 0 (0.0%) |
| Education Instruction & Library | 0 (0.0%) | 5 (100.0%) |
| Arts, Media & Entertainment | 0 (0.0%) | 0 (0.0%) |
| Health Diagnosing & Treating | 0 (0.0%) | 11 (100.0%) |
| Health Technologists | 0 (0.0%) | 3 (100.0%) |
| Total (Category) | 11 (28.2%) | 28 (71.8%) |
| Total (Overall) | 69 (55.6%) | 55 (44.4%) |
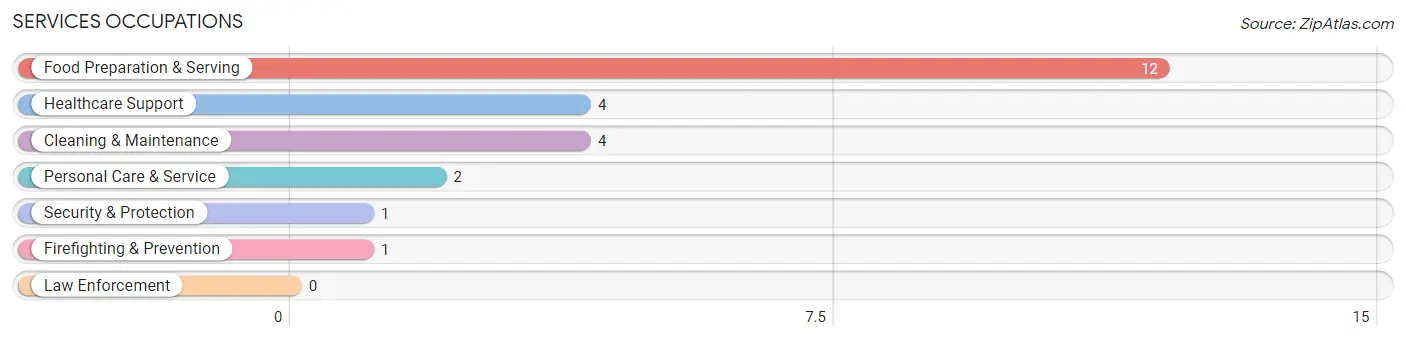
Services Occupations
The most common Services occupations in Webbers Falls are Food Preparation & Serving (12 | 9.7%), Healthcare Support (4 | 3.2%), Cleaning & Maintenance (4 | 3.2%), Personal Care & Service (2 | 1.6%), and Security & Protection (1 | 0.8%).
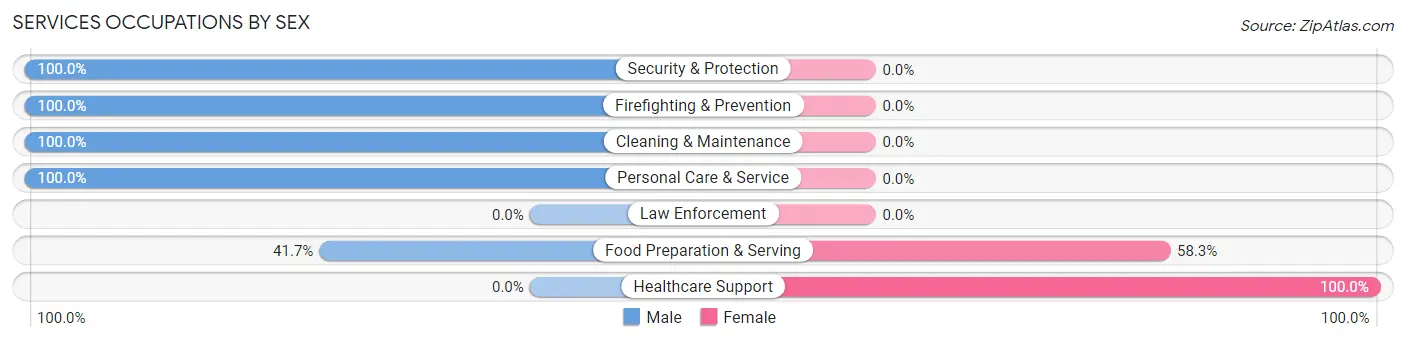
Services Occupations by Sex
Within the Services occupations in Webbers Falls, the most male-oriented occupations are Security & Protection (100.0%), Firefighting & Prevention (100.0%), and Cleaning & Maintenance (100.0%), while the most female-oriented occupations are Healthcare Support (100.0%), and Food Preparation & Serving (58.3%).
| Occupation | Male | Female |
| Healthcare Support | 0 (0.0%) | 4 (100.0%) |
| Security & Protection | 1 (100.0%) | 0 (0.0%) |
| Firefighting & Prevention | 1 (100.0%) | 0 (0.0%) |
| Law Enforcement | 0 (0.0%) | 0 (0.0%) |
| Food Preparation & Serving | 5 (41.7%) | 7 (58.3%) |
| Cleaning & Maintenance | 4 (100.0%) | 0 (0.0%) |
| Personal Care & Service | 2 (100.0%) | 0 (0.0%) |
| Total (Category) | 12 (52.2%) | 11 (47.8%) |
| Total (Overall) | 69 (55.6%) | 55 (44.4%) |
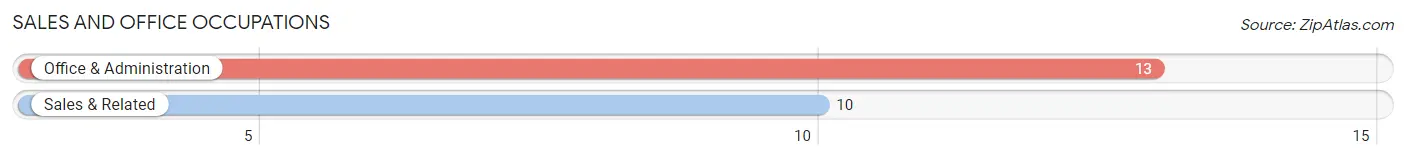
Sales and Office Occupations
The most common Sales and Office occupations in Webbers Falls are Office & Administration (13 | 10.5%), and Sales & Related (10 | 8.1%).
Sales and Office Occupations by Sex
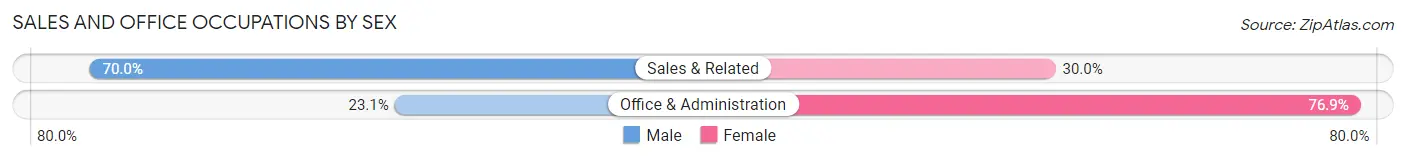
| Occupation | Male | Female |
| Sales & Related | 7 (70.0%) | 3 (30.0%) |
| Office & Administration | 3 (23.1%) | 10 (76.9%) |
| Total (Category) | 10 (43.5%) | 13 (56.5%) |
| Total (Overall) | 69 (55.6%) | 55 (44.4%) |
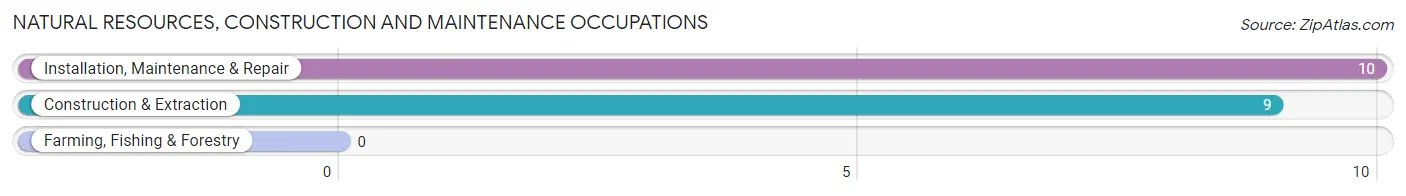
Natural Resources, Construction and Maintenance Occupations
The most common Natural Resources, Construction and Maintenance occupations in Webbers Falls are Installation, Maintenance & Repair (10 | 8.1%), and Construction & Extraction (9 | 7.3%).
Natural Resources, Construction and Maintenance Occupations by Sex
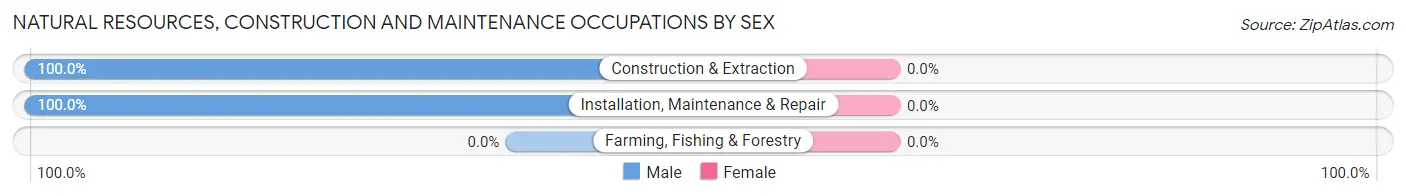
| Occupation | Male | Female |
| Farming, Fishing & Forestry | 0 (0.0%) | 0 (0.0%) |
| Construction & Extraction | 9 (100.0%) | 0 (0.0%) |
| Installation, Maintenance & Repair | 10 (100.0%) | 0 (0.0%) |
| Total (Category) | 19 (100.0%) | 0 (0.0%) |
| Total (Overall) | 69 (55.6%) | 55 (44.4%) |
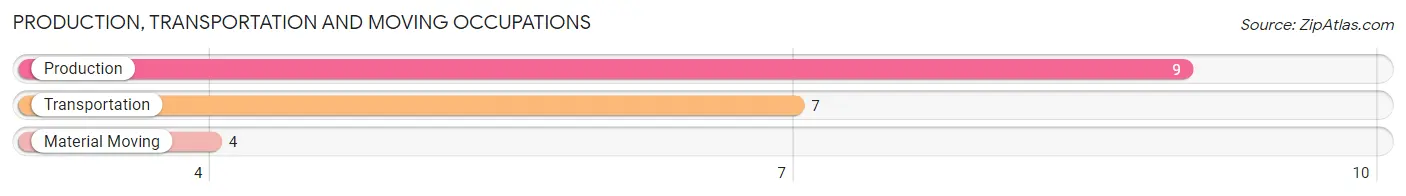
Production, Transportation and Moving Occupations
The most common Production, Transportation and Moving occupations in Webbers Falls are Production (9 | 7.3%), Transportation (7 | 5.7%), and Material Moving (4 | 3.2%).
Production, Transportation and Moving Occupations by Sex
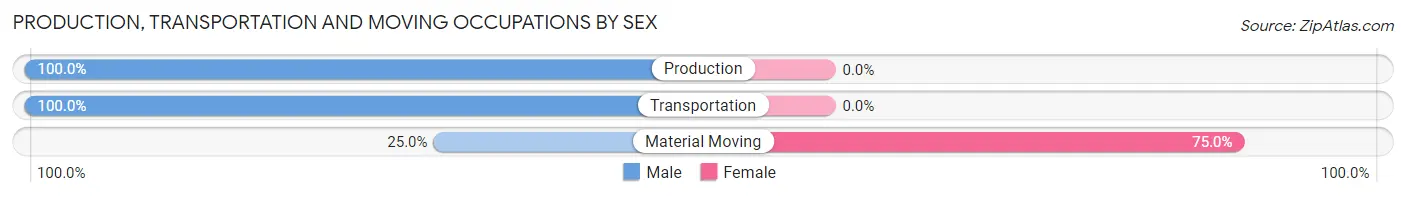
| Occupation | Male | Female |
| Production | 9 (100.0%) | 0 (0.0%) |
| Transportation | 7 (100.0%) | 0 (0.0%) |
| Material Moving | 1 (25.0%) | 3 (75.0%) |
| Total (Category) | 17 (85.0%) | 3 (15.0%) |
| Total (Overall) | 69 (55.6%) | 55 (44.4%) |
Employment Industries by Sex in Webbers Falls
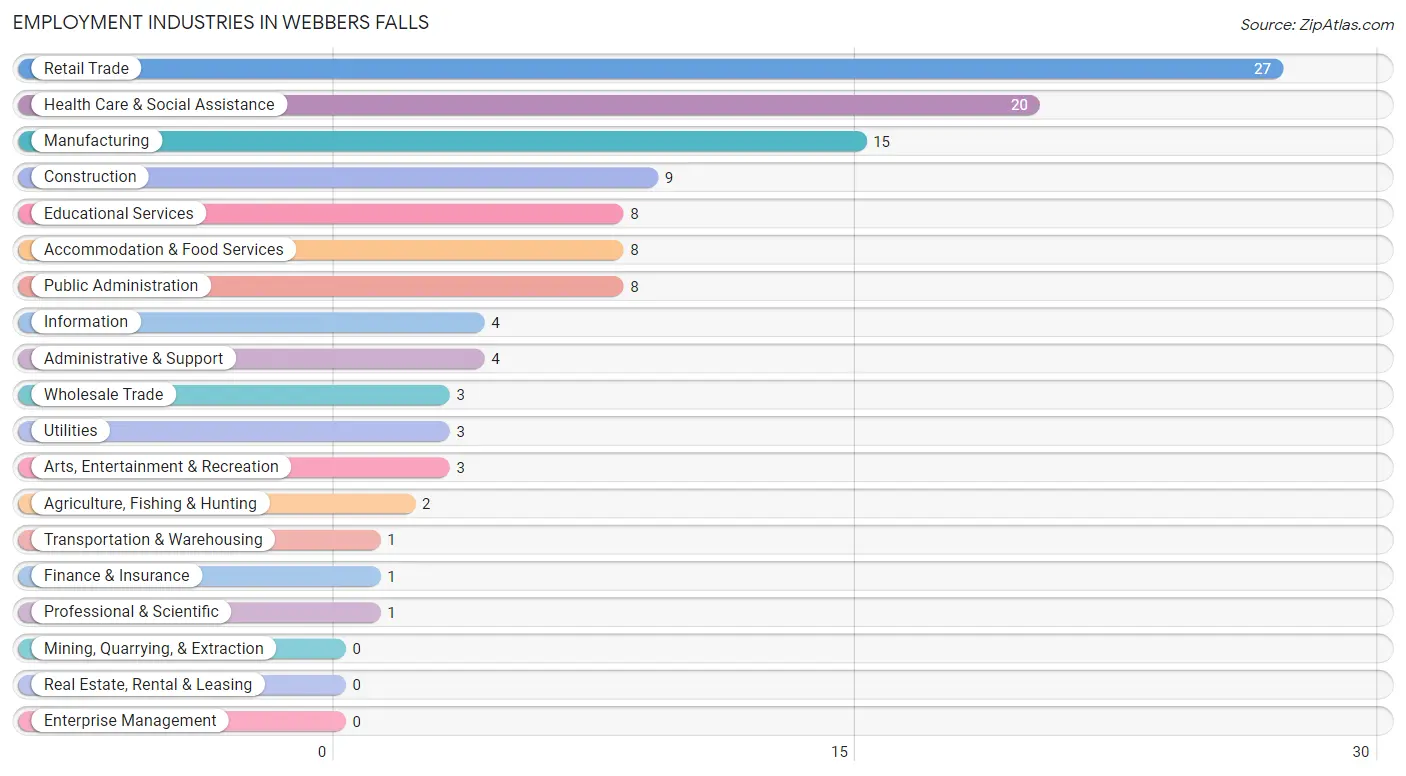
Employment Industries in Webbers Falls
The major employment industries in Webbers Falls include Retail Trade (27 | 21.8%), Health Care & Social Assistance (20 | 16.1%), Manufacturing (15 | 12.1%), Construction (9 | 7.3%), and Educational Services (8 | 6.5%).
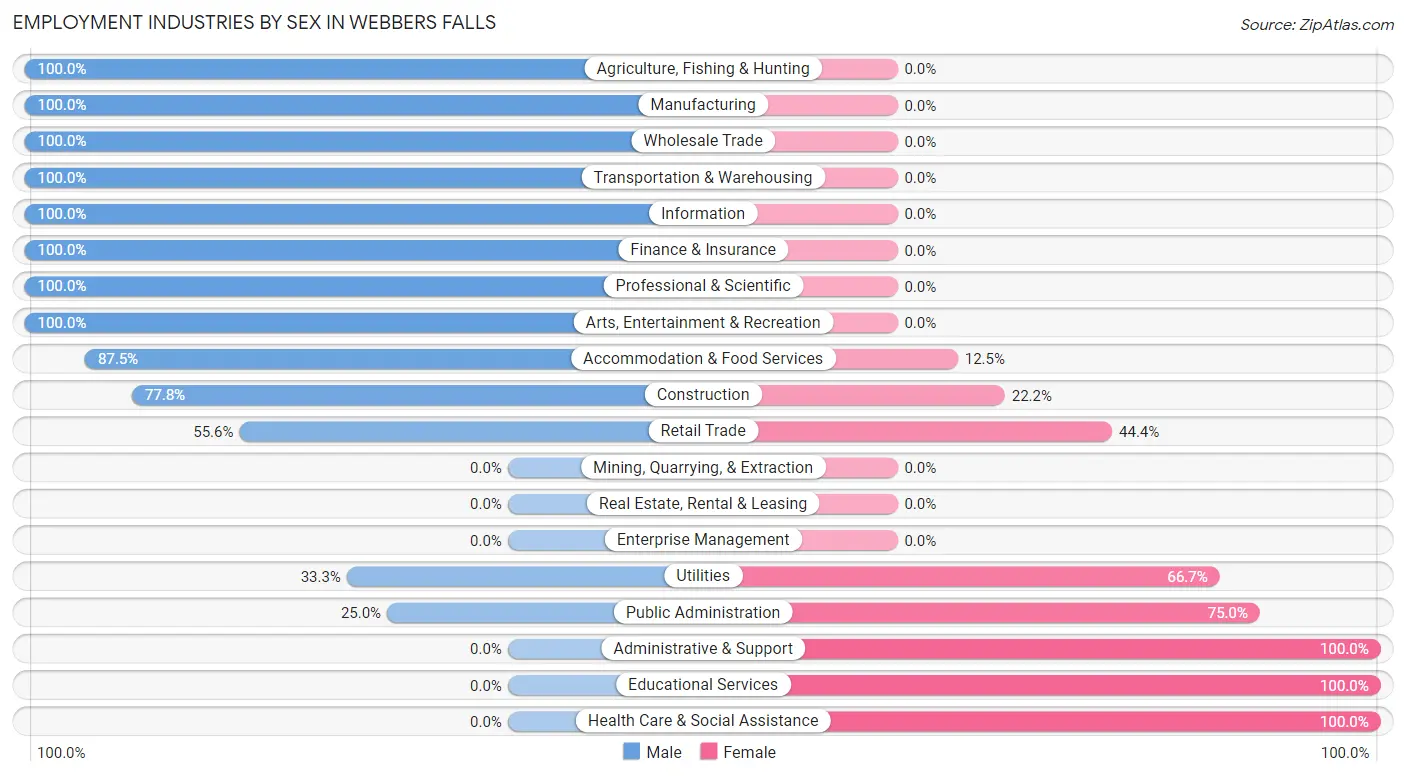
Employment Industries by Sex in Webbers Falls
The Webbers Falls industries that see more men than women are Agriculture, Fishing & Hunting (100.0%), Manufacturing (100.0%), and Wholesale Trade (100.0%), whereas the industries that tend to have a higher number of women are Administrative & Support (100.0%), Educational Services (100.0%), and Health Care & Social Assistance (100.0%).
| Industry | Male | Female |
| Agriculture, Fishing & Hunting | 2 (100.0%) | 0 (0.0%) |
| Mining, Quarrying, & Extraction | 0 (0.0%) | 0 (0.0%) |
| Construction | 7 (77.8%) | 2 (22.2%) |
| Manufacturing | 15 (100.0%) | 0 (0.0%) |
| Wholesale Trade | 3 (100.0%) | 0 (0.0%) |
| Retail Trade | 15 (55.6%) | 12 (44.4%) |
| Transportation & Warehousing | 1 (100.0%) | 0 (0.0%) |
| Utilities | 1 (33.3%) | 2 (66.7%) |
| Information | 4 (100.0%) | 0 (0.0%) |
| Finance & Insurance | 1 (100.0%) | 0 (0.0%) |
| Real Estate, Rental & Leasing | 0 (0.0%) | 0 (0.0%) |
| Professional & Scientific | 1 (100.0%) | 0 (0.0%) |
| Enterprise Management | 0 (0.0%) | 0 (0.0%) |
| Administrative & Support | 0 (0.0%) | 4 (100.0%) |
| Educational Services | 0 (0.0%) | 8 (100.0%) |
| Health Care & Social Assistance | 0 (0.0%) | 20 (100.0%) |
| Arts, Entertainment & Recreation | 3 (100.0%) | 0 (0.0%) |
| Accommodation & Food Services | 7 (87.5%) | 1 (12.5%) |
| Public Administration | 2 (25.0%) | 6 (75.0%) |
| Total | 69 (55.6%) | 55 (44.4%) |
Education in Webbers Falls
School Enrollment in Webbers Falls
The most common levels of schooling among the 85 students in Webbers Falls are high school (35 | 41.2%), elementary school (16 | 18.8%), and middle school (16 | 18.8%).
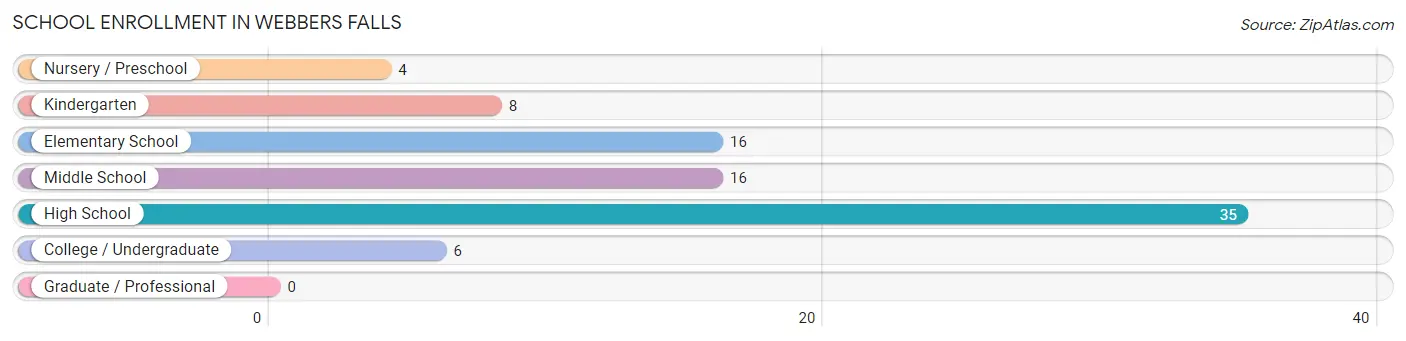
| School Level | # Students | % Students |
| Nursery / Preschool | 4 | 4.7% |
| Kindergarten | 8 | 9.4% |
| Elementary School | 16 | 18.8% |
| Middle School | 16 | 18.8% |
| High School | 35 | 41.2% |
| College / Undergraduate | 6 | 7.1% |
| Graduate / Professional | 0 | 0.0% |
| Total | 85 | 100.0% |
School Enrollment by Age by Funding Source in Webbers Falls
Out of a total of 85 students who are enrolled in schools in Webbers Falls, 7 (8.2%) attend a private institution, while the remaining 78 (91.8%) are enrolled in public schools. The age group of 10 to 14 year olds has the highest likelihood of being enrolled in private schools, with 4 (14.3% in the age bracket) enrolled. Conversely, the age group of 3 to 4 year olds has the lowest likelihood of being enrolled in a private school, with 2 (100.0% in the age bracket) attending a public institution.
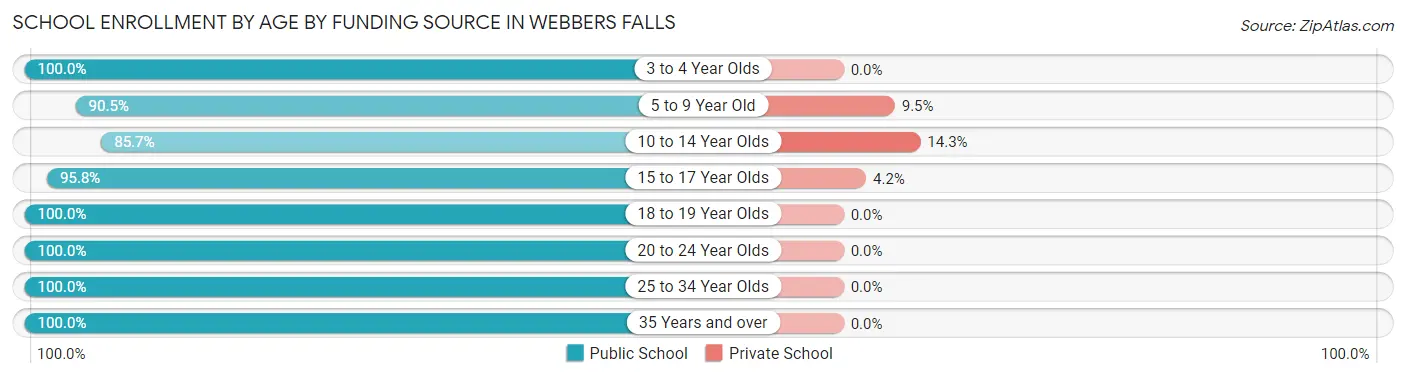
| Age Bracket | Public School | Private School |
| 3 to 4 Year Olds | 2 (100.0%) | 0 (0.0%) |
| 5 to 9 Year Old | 19 (90.5%) | 2 (9.5%) |
| 10 to 14 Year Olds | 24 (85.7%) | 4 (14.3%) |
| 15 to 17 Year Olds | 23 (95.8%) | 1 (4.2%) |
| 18 to 19 Year Olds | 1 (100.0%) | 0 (0.0%) |
| 20 to 24 Year Olds | 1 (100.0%) | 0 (0.0%) |
| 25 to 34 Year Olds | 6 (100.0%) | 0 (0.0%) |
| 35 Years and over | 2 (100.0%) | 0 (0.0%) |
| Total | 78 (91.8%) | 7 (8.2%) |
Educational Attainment by Field of Study in Webbers Falls
Education (12 | 24.0%), psychology (10 | 20.0%), science & technology (9 | 18.0%), business (7 | 14.0%), and bio, nature & agricultural (4 | 8.0%) are the most common fields of study among 50 individuals in Webbers Falls who have obtained a bachelor's degree or higher.
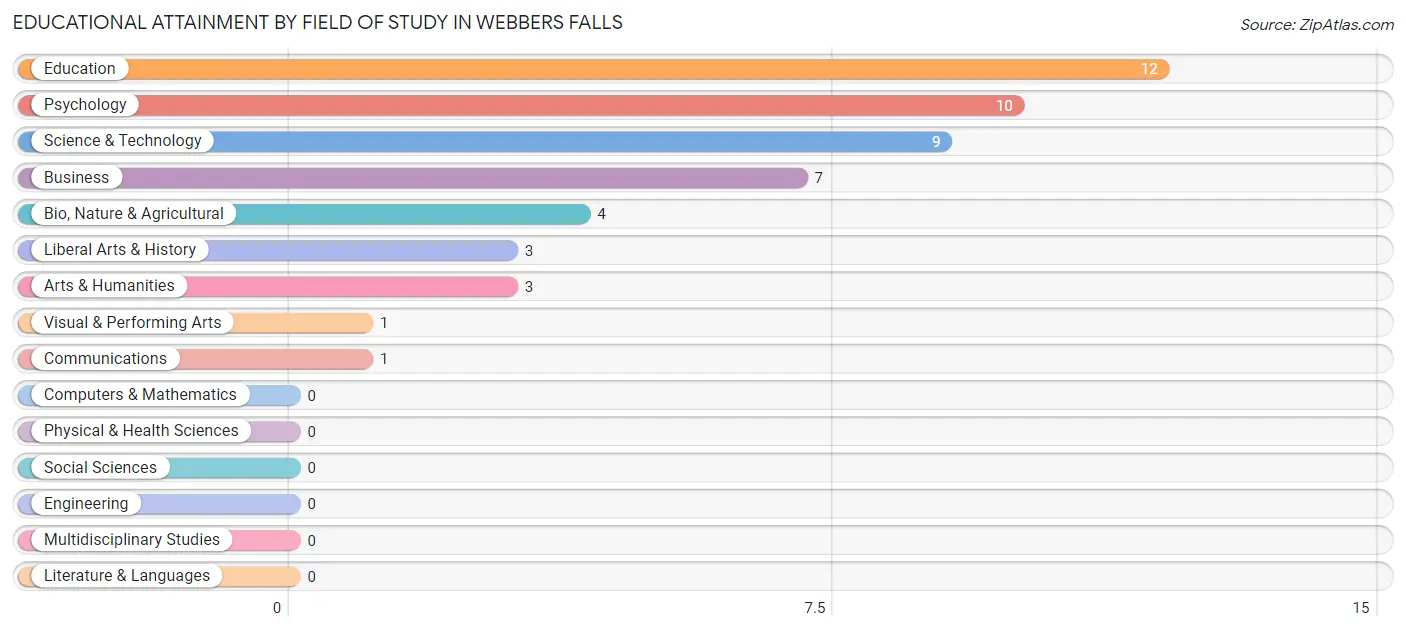
| Field of Study | # Graduates | % Graduates |
| Computers & Mathematics | 0 | 0.0% |
| Bio, Nature & Agricultural | 4 | 8.0% |
| Physical & Health Sciences | 0 | 0.0% |
| Psychology | 10 | 20.0% |
| Social Sciences | 0 | 0.0% |
| Engineering | 0 | 0.0% |
| Multidisciplinary Studies | 0 | 0.0% |
| Science & Technology | 9 | 18.0% |
| Business | 7 | 14.0% |
| Education | 12 | 24.0% |
| Literature & Languages | 0 | 0.0% |
| Liberal Arts & History | 3 | 6.0% |
| Visual & Performing Arts | 1 | 2.0% |
| Communications | 1 | 2.0% |
| Arts & Humanities | 3 | 6.0% |
| Total | 50 | 100.0% |
Transportation & Commute in Webbers Falls
Vehicle Availability by Sex in Webbers Falls
The most prevalent vehicle ownership categories in Webbers Falls are males with 1 vehicle (27, accounting for 40.3%) and females with 1 vehicle (14, making up 49.1%).
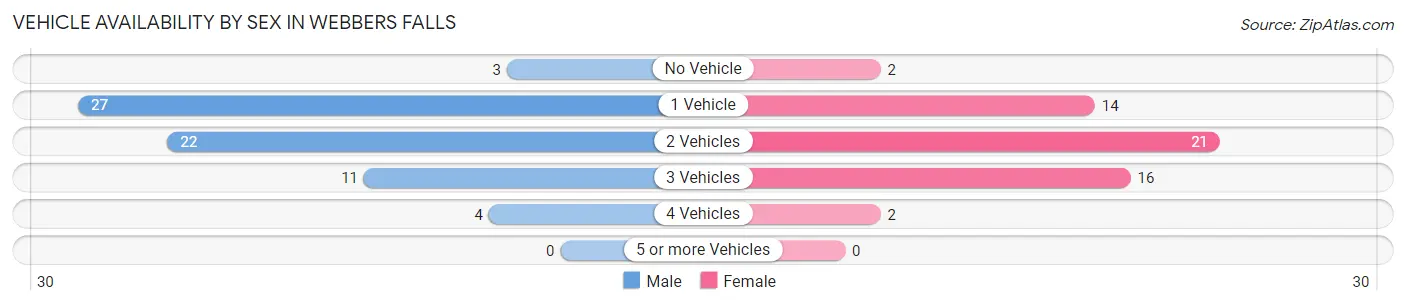
| Vehicles Available | Male | Female |
| No Vehicle | 3 (4.5%) | 2 (3.6%) |
| 1 Vehicle | 27 (40.3%) | 14 (25.5%) |
| 2 Vehicles | 22 (32.8%) | 21 (38.2%) |
| 3 Vehicles | 11 (16.4%) | 16 (29.1%) |
| 4 Vehicles | 4 (6.0%) | 2 (3.6%) |
| 5 or more Vehicles | 0 (0.0%) | 0 (0.0%) |
| Total | 67 (100.0%) | 55 (100.0%) |
Commute Time in Webbers Falls
The most frequently occuring commute durations in Webbers Falls are 5 to 9 minutes (23 commuters, 20.9%), 30 to 34 minutes (21 commuters, 19.1%), and 45 to 59 minutes (15 commuters, 13.6%).
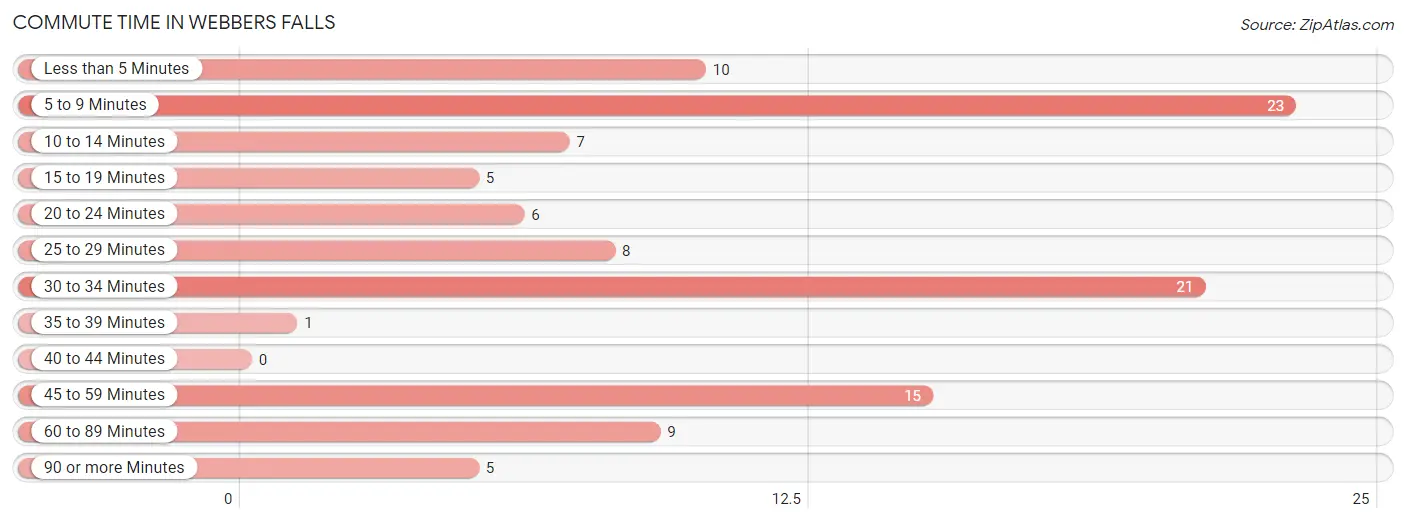
| Commute Time | # Commuters | % Commuters |
| Less than 5 Minutes | 10 | 9.1% |
| 5 to 9 Minutes | 23 | 20.9% |
| 10 to 14 Minutes | 7 | 6.4% |
| 15 to 19 Minutes | 5 | 4.5% |
| 20 to 24 Minutes | 6 | 5.4% |
| 25 to 29 Minutes | 8 | 7.3% |
| 30 to 34 Minutes | 21 | 19.1% |
| 35 to 39 Minutes | 1 | 0.9% |
| 40 to 44 Minutes | 0 | 0.0% |
| 45 to 59 Minutes | 15 | 13.6% |
| 60 to 89 Minutes | 9 | 8.2% |
| 90 or more Minutes | 5 | 4.5% |
Commute Time by Sex in Webbers Falls
The most common commute times in Webbers Falls are 30 to 34 minutes (18 commuters, 29.5%) for males and 5 to 9 minutes (14 commuters, 28.6%) for females.
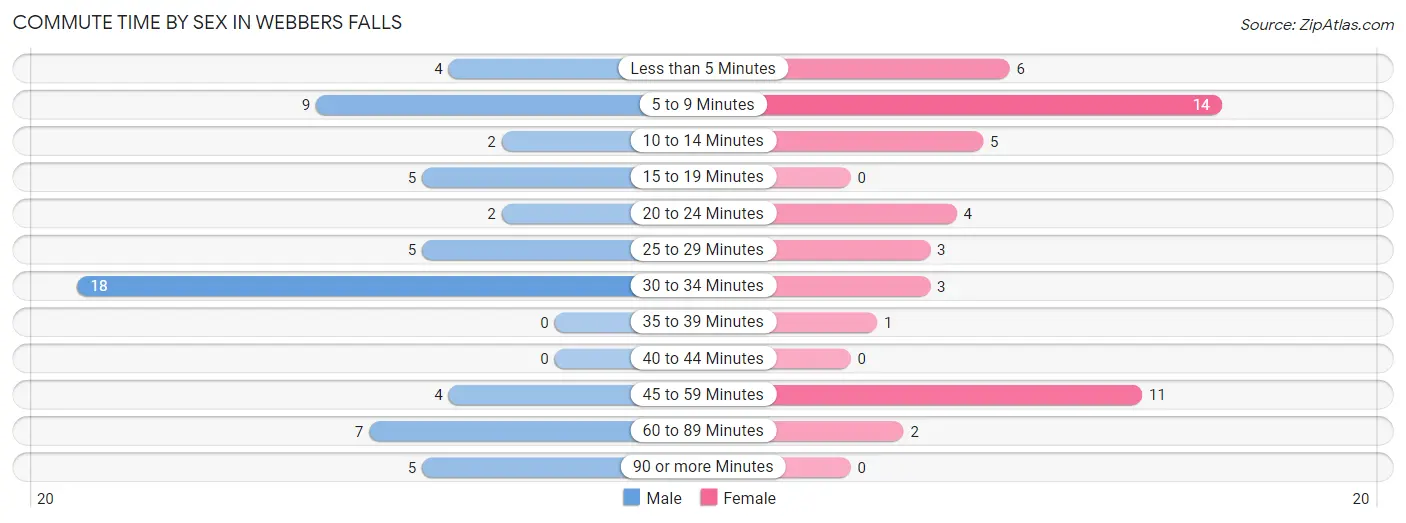
| Commute Time | Male | Female |
| Less than 5 Minutes | 4 (6.6%) | 6 (12.2%) |
| 5 to 9 Minutes | 9 (14.7%) | 14 (28.6%) |
| 10 to 14 Minutes | 2 (3.3%) | 5 (10.2%) |
| 15 to 19 Minutes | 5 (8.2%) | 0 (0.0%) |
| 20 to 24 Minutes | 2 (3.3%) | 4 (8.2%) |
| 25 to 29 Minutes | 5 (8.2%) | 3 (6.1%) |
| 30 to 34 Minutes | 18 (29.5%) | 3 (6.1%) |
| 35 to 39 Minutes | 0 (0.0%) | 1 (2.0%) |
| 40 to 44 Minutes | 0 (0.0%) | 0 (0.0%) |
| 45 to 59 Minutes | 4 (6.6%) | 11 (22.5%) |
| 60 to 89 Minutes | 7 (11.5%) | 2 (4.1%) |
| 90 or more Minutes | 5 (8.2%) | 0 (0.0%) |
Time of Departure to Work by Sex in Webbers Falls
The most frequent times of departure to work in Webbers Falls are 7:30 AM to 7:59 AM (13, 21.3%) for males and 7:00 AM to 7:29 AM (14, 28.6%) for females.
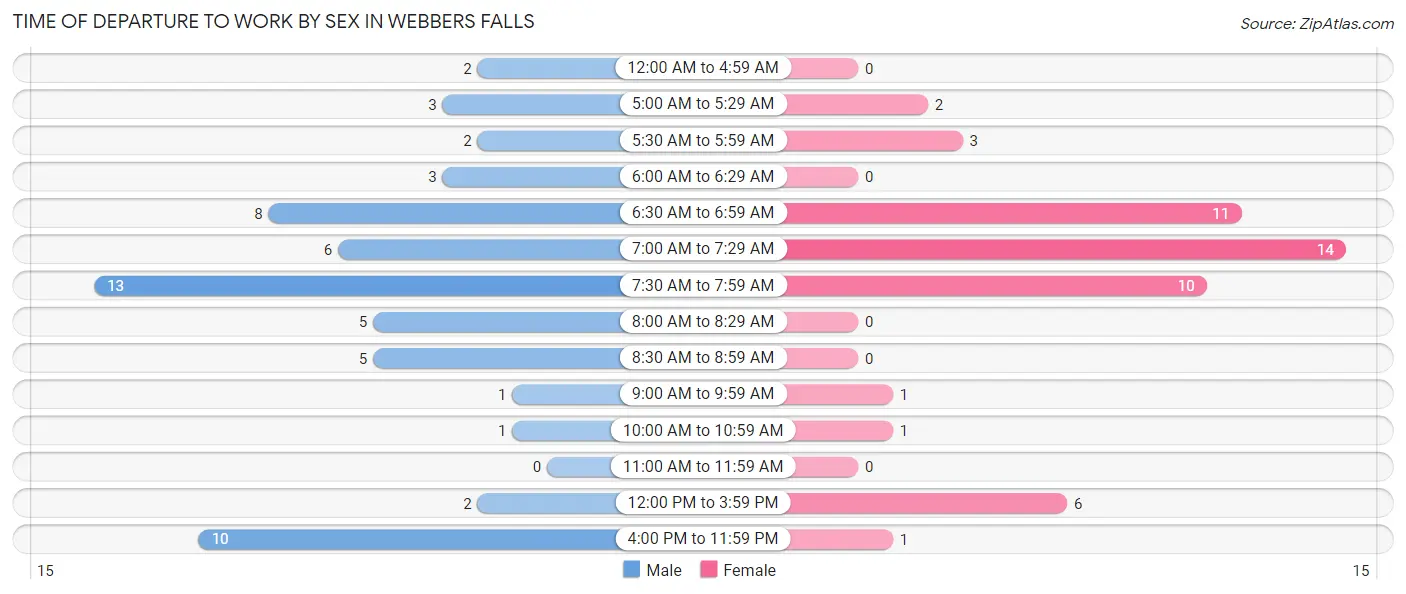
| Time of Departure | Male | Female |
| 12:00 AM to 4:59 AM | 2 (3.3%) | 0 (0.0%) |
| 5:00 AM to 5:29 AM | 3 (4.9%) | 2 (4.1%) |
| 5:30 AM to 5:59 AM | 2 (3.3%) | 3 (6.1%) |
| 6:00 AM to 6:29 AM | 3 (4.9%) | 0 (0.0%) |
| 6:30 AM to 6:59 AM | 8 (13.1%) | 11 (22.5%) |
| 7:00 AM to 7:29 AM | 6 (9.8%) | 14 (28.6%) |
| 7:30 AM to 7:59 AM | 13 (21.3%) | 10 (20.4%) |
| 8:00 AM to 8:29 AM | 5 (8.2%) | 0 (0.0%) |
| 8:30 AM to 8:59 AM | 5 (8.2%) | 0 (0.0%) |
| 9:00 AM to 9:59 AM | 1 (1.6%) | 1 (2.0%) |
| 10:00 AM to 10:59 AM | 1 (1.6%) | 1 (2.0%) |
| 11:00 AM to 11:59 AM | 0 (0.0%) | 0 (0.0%) |
| 12:00 PM to 3:59 PM | 2 (3.3%) | 6 (12.2%) |
| 4:00 PM to 11:59 PM | 10 (16.4%) | 1 (2.0%) |
| Total | 61 (100.0%) | 49 (100.0%) |
Housing Occupancy in Webbers Falls
Occupancy by Ownership in Webbers Falls
Of the total 173 dwellings in Webbers Falls, owner-occupied units account for 129 (74.6%), while renter-occupied units make up 44 (25.4%).
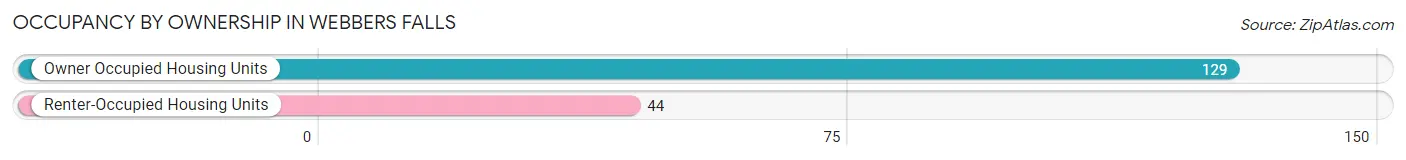
| Occupancy | # Housing Units | % Housing Units |
| Owner Occupied Housing Units | 129 | 74.6% |
| Renter-Occupied Housing Units | 44 | 25.4% |
| Total Occupied Housing Units | 173 | 100.0% |
Occupancy by Household Size in Webbers Falls
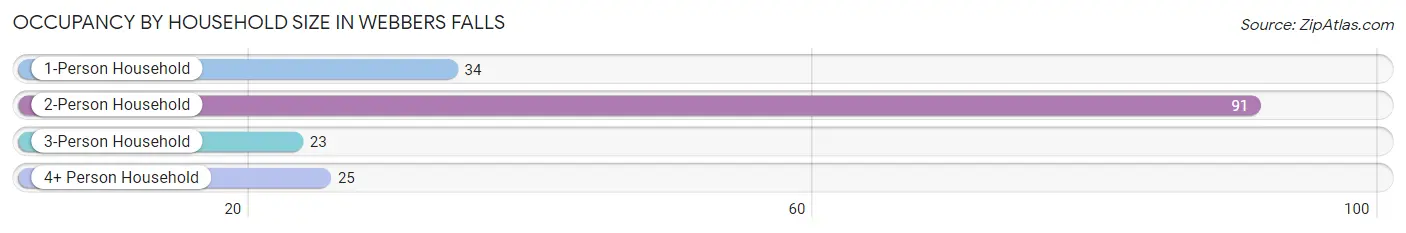
| Household Size | # Housing Units | % Housing Units |
| 1-Person Household | 34 | 19.7% |
| 2-Person Household | 91 | 52.6% |
| 3-Person Household | 23 | 13.3% |
| 4+ Person Household | 25 | 14.4% |
| Total Housing Units | 173 | 100.0% |
Occupancy by Ownership by Household Size in Webbers Falls

| Household Size | Owner-occupied | Renter-occupied |
| 1-Person Household | 18 (52.9%) | 16 (47.1%) |
| 2-Person Household | 75 (82.4%) | 16 (17.6%) |
| 3-Person Household | 15 (65.2%) | 8 (34.8%) |
| 4+ Person Household | 21 (84.0%) | 4 (16.0%) |
| Total Housing Units | 129 (74.6%) | 44 (25.4%) |
Occupancy by Educational Attainment in Webbers Falls
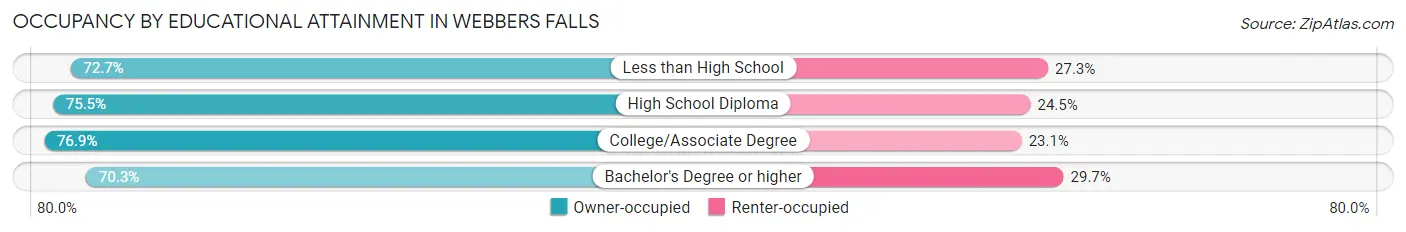
| Household Size | Owner-occupied | Renter-occupied |
| Less than High School | 16 (72.7%) | 6 (27.3%) |
| High School Diploma | 37 (75.5%) | 12 (24.5%) |
| College/Associate Degree | 50 (76.9%) | 15 (23.1%) |
| Bachelor's Degree or higher | 26 (70.3%) | 11 (29.7%) |
Occupancy by Age of Householder in Webbers Falls
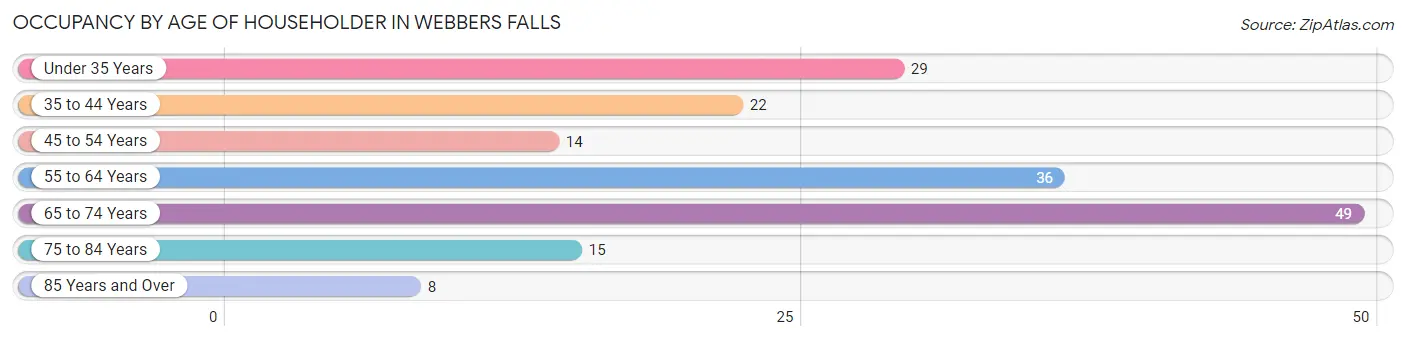
| Age Bracket | # Households | % Households |
| Under 35 Years | 29 | 16.8% |
| 35 to 44 Years | 22 | 12.7% |
| 45 to 54 Years | 14 | 8.1% |
| 55 to 64 Years | 36 | 20.8% |
| 65 to 74 Years | 49 | 28.3% |
| 75 to 84 Years | 15 | 8.7% |
| 85 Years and Over | 8 | 4.6% |
| Total | 173 | 100.0% |
Housing Finances in Webbers Falls
Median Income by Occupancy in Webbers Falls
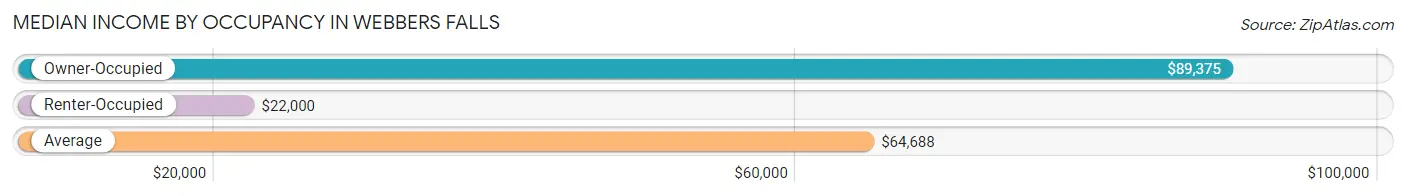
| Occupancy Type | # Households | Median Income |
| Owner-Occupied | 129 (74.6%) | $89,375 |
| Renter-Occupied | 44 (25.4%) | $22,000 |
| Average | 173 (100.0%) | $64,688 |
Occupancy by Householder Income Bracket in Webbers Falls
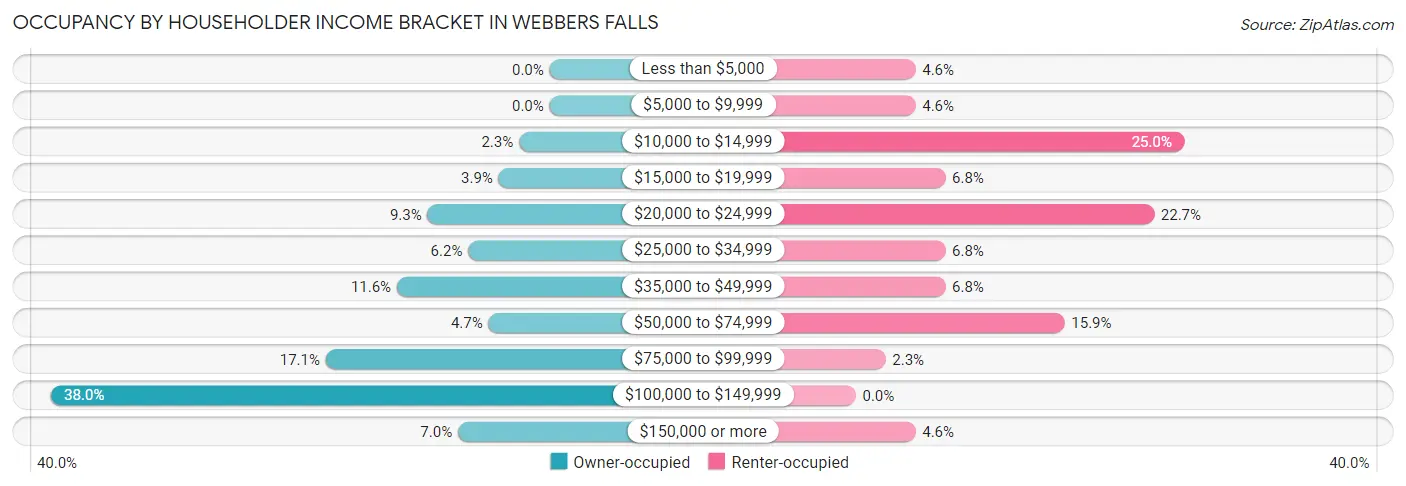
| Income Bracket | Owner-occupied | Renter-occupied |
| Less than $5,000 | 0 (0.0%) | 2 (4.5%) |
| $5,000 to $9,999 | 0 (0.0%) | 2 (4.5%) |
| $10,000 to $14,999 | 3 (2.3%) | 11 (25.0%) |
| $15,000 to $19,999 | 5 (3.9%) | 3 (6.8%) |
| $20,000 to $24,999 | 12 (9.3%) | 10 (22.7%) |
| $25,000 to $34,999 | 8 (6.2%) | 3 (6.8%) |
| $35,000 to $49,999 | 15 (11.6%) | 3 (6.8%) |
| $50,000 to $74,999 | 6 (4.6%) | 7 (15.9%) |
| $75,000 to $99,999 | 22 (17.1%) | 1 (2.3%) |
| $100,000 to $149,999 | 49 (38.0%) | 0 (0.0%) |
| $150,000 or more | 9 (7.0%) | 2 (4.5%) |
| Total | 129 (100.0%) | 44 (100.0%) |
Monthly Housing Cost Tiers in Webbers Falls
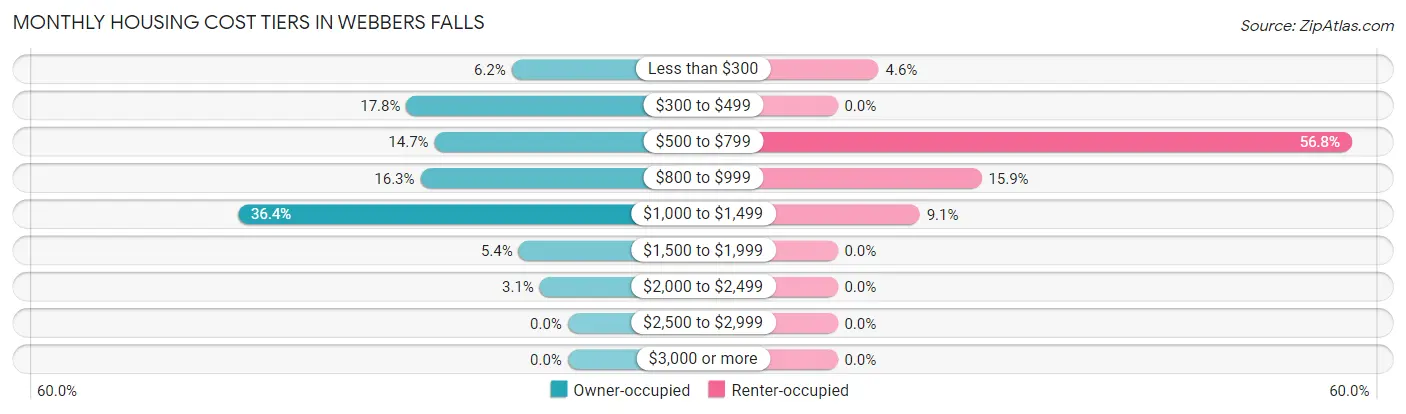
| Monthly Cost | Owner-occupied | Renter-occupied |
| Less than $300 | 8 (6.2%) | 2 (4.5%) |
| $300 to $499 | 23 (17.8%) | 0 (0.0%) |
| $500 to $799 | 19 (14.7%) | 25 (56.8%) |
| $800 to $999 | 21 (16.3%) | 7 (15.9%) |
| $1,000 to $1,499 | 47 (36.4%) | 4 (9.1%) |
| $1,500 to $1,999 | 7 (5.4%) | 0 (0.0%) |
| $2,000 to $2,499 | 4 (3.1%) | 0 (0.0%) |
| $2,500 to $2,999 | 0 (0.0%) | 0 (0.0%) |
| $3,000 or more | 0 (0.0%) | 0 (0.0%) |
| Total | 129 (100.0%) | 44 (100.0%) |
Physical Housing Characteristics in Webbers Falls
Housing Structures in Webbers Falls
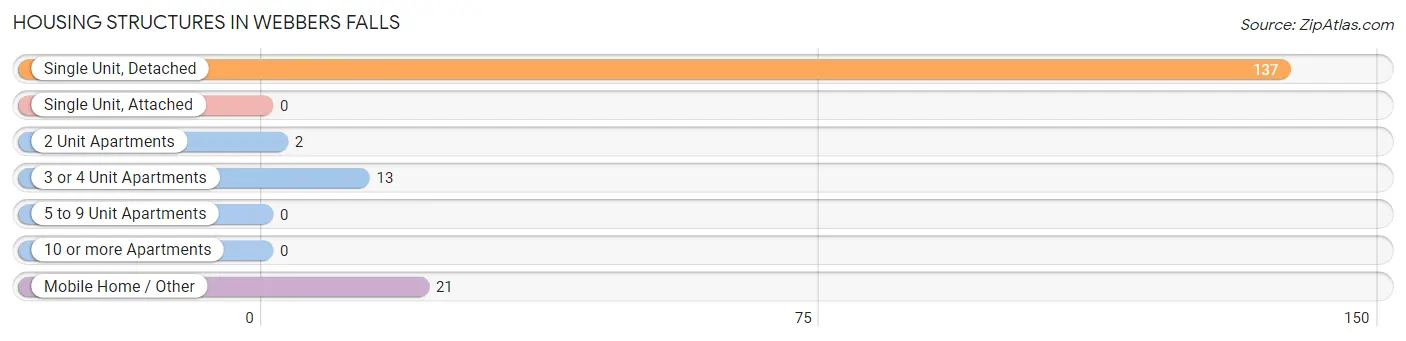
| Structure Type | # Housing Units | % Housing Units |
| Single Unit, Detached | 137 | 79.2% |
| Single Unit, Attached | 0 | 0.0% |
| 2 Unit Apartments | 2 | 1.2% |
| 3 or 4 Unit Apartments | 13 | 7.5% |
| 5 to 9 Unit Apartments | 0 | 0.0% |
| 10 or more Apartments | 0 | 0.0% |
| Mobile Home / Other | 21 | 12.1% |
| Total | 173 | 100.0% |
Housing Structures by Occupancy in Webbers Falls
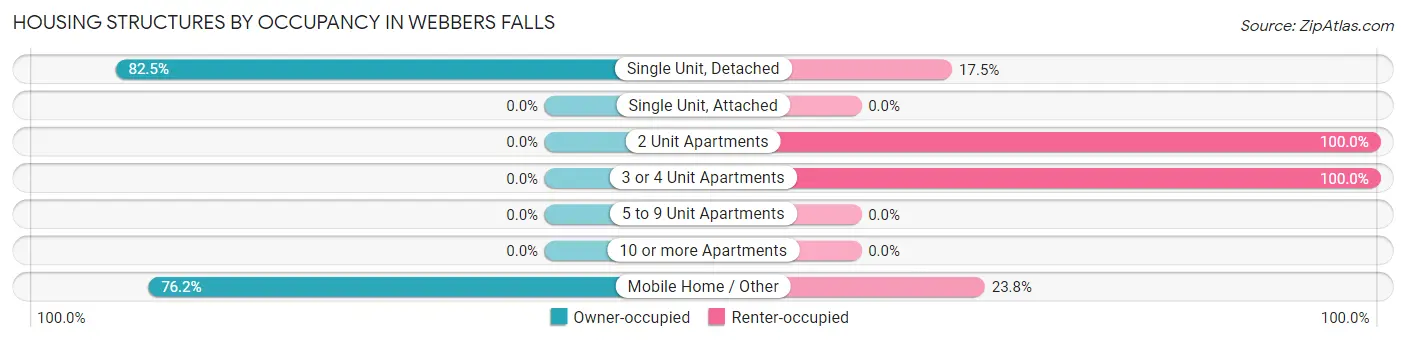
| Structure Type | Owner-occupied | Renter-occupied |
| Single Unit, Detached | 113 (82.5%) | 24 (17.5%) |
| Single Unit, Attached | 0 (0.0%) | 0 (0.0%) |
| 2 Unit Apartments | 0 (0.0%) | 2 (100.0%) |
| 3 or 4 Unit Apartments | 0 (0.0%) | 13 (100.0%) |
| 5 to 9 Unit Apartments | 0 (0.0%) | 0 (0.0%) |
| 10 or more Apartments | 0 (0.0%) | 0 (0.0%) |
| Mobile Home / Other | 16 (76.2%) | 5 (23.8%) |
| Total | 129 (74.6%) | 44 (25.4%) |
Housing Structures by Number of Rooms in Webbers Falls
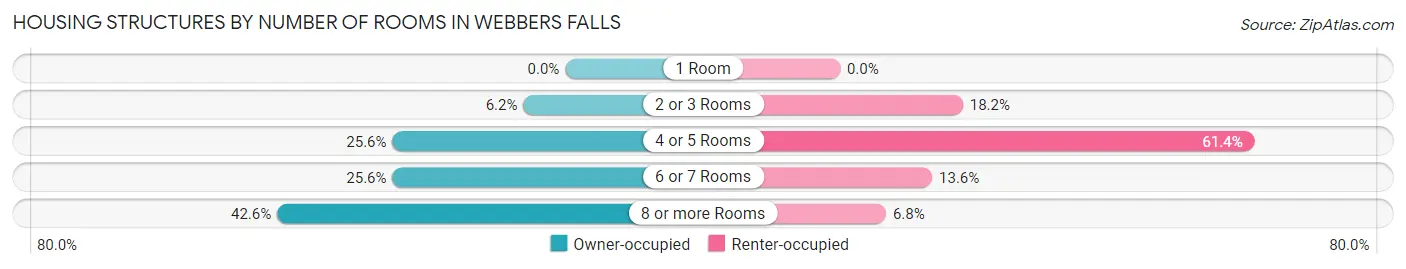
| Number of Rooms | Owner-occupied | Renter-occupied |
| 1 Room | 0 (0.0%) | 0 (0.0%) |
| 2 or 3 Rooms | 8 (6.2%) | 8 (18.2%) |
| 4 or 5 Rooms | 33 (25.6%) | 27 (61.4%) |
| 6 or 7 Rooms | 33 (25.6%) | 6 (13.6%) |
| 8 or more Rooms | 55 (42.6%) | 3 (6.8%) |
| Total | 129 (100.0%) | 44 (100.0%) |
Housing Structure by Heating Type in Webbers Falls
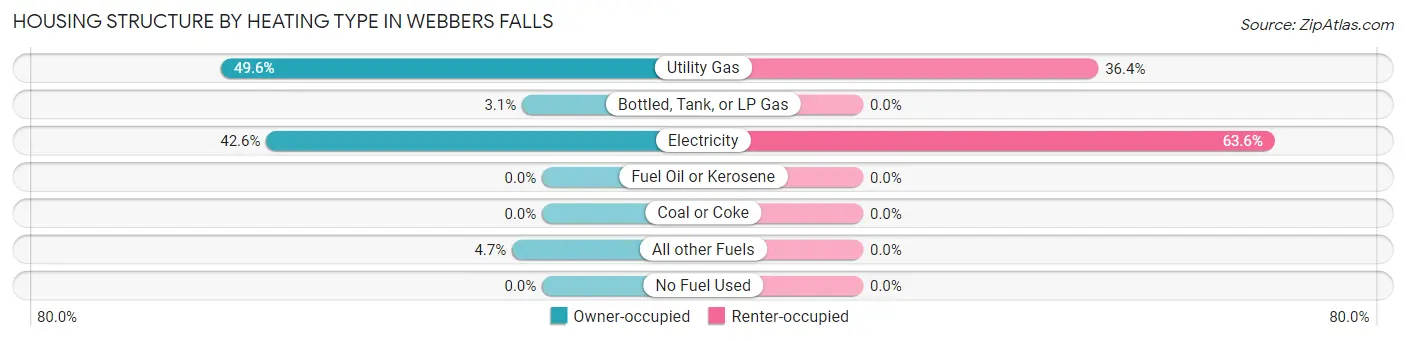
| Heating Type | Owner-occupied | Renter-occupied |
| Utility Gas | 64 (49.6%) | 16 (36.4%) |
| Bottled, Tank, or LP Gas | 4 (3.1%) | 0 (0.0%) |
| Electricity | 55 (42.6%) | 28 (63.6%) |
| Fuel Oil or Kerosene | 0 (0.0%) | 0 (0.0%) |
| Coal or Coke | 0 (0.0%) | 0 (0.0%) |
| All other Fuels | 6 (4.6%) | 0 (0.0%) |
| No Fuel Used | 0 (0.0%) | 0 (0.0%) |
| Total | 129 (100.0%) | 44 (100.0%) |
Household Vehicle Usage in Webbers Falls
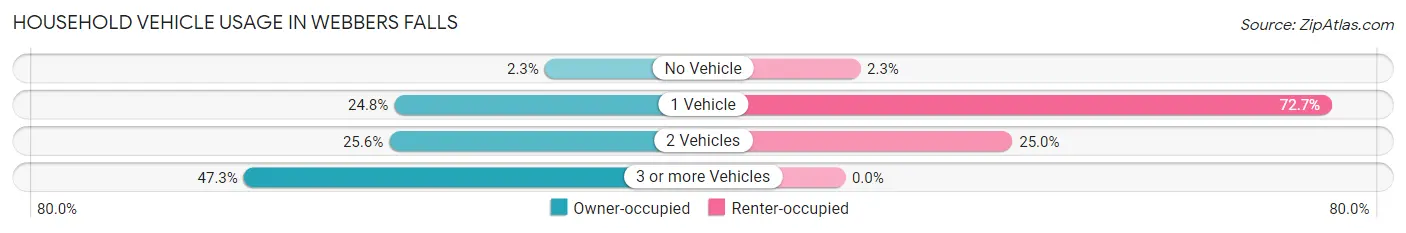
| Vehicles per Household | Owner-occupied | Renter-occupied |
| No Vehicle | 3 (2.3%) | 1 (2.3%) |
| 1 Vehicle | 32 (24.8%) | 32 (72.7%) |
| 2 Vehicles | 33 (25.6%) | 11 (25.0%) |
| 3 or more Vehicles | 61 (47.3%) | 0 (0.0%) |
| Total | 129 (100.0%) | 44 (100.0%) |
Real Estate & Mortgages in Webbers Falls
Real Estate and Mortgage Overview in Webbers Falls
| Characteristic | Without Mortgage | With Mortgage |
| Housing Units | 56 | 73 |
| Median Property Value | $78,300 | $94,900 |
| Median Household Income | $41,875 | $3 |
| Monthly Housing Costs | $440 | $0 |
| Real Estate Taxes | - | - |
Property Value by Mortgage Status in Webbers Falls
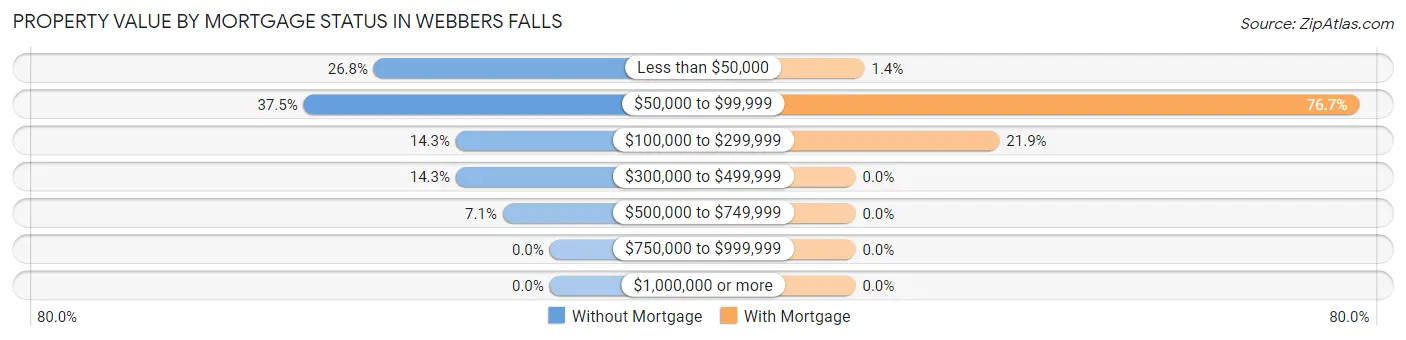
| Property Value | Without Mortgage | With Mortgage |
| Less than $50,000 | 15 (26.8%) | 1 (1.4%) |
| $50,000 to $99,999 | 21 (37.5%) | 56 (76.7%) |
| $100,000 to $299,999 | 8 (14.3%) | 16 (21.9%) |
| $300,000 to $499,999 | 8 (14.3%) | 0 (0.0%) |
| $500,000 to $749,999 | 4 (7.1%) | 0 (0.0%) |
| $750,000 to $999,999 | 0 (0.0%) | 0 (0.0%) |
| $1,000,000 or more | 0 (0.0%) | 0 (0.0%) |
| Total | 56 (100.0%) | 73 (100.0%) |
Household Income by Mortgage Status in Webbers Falls
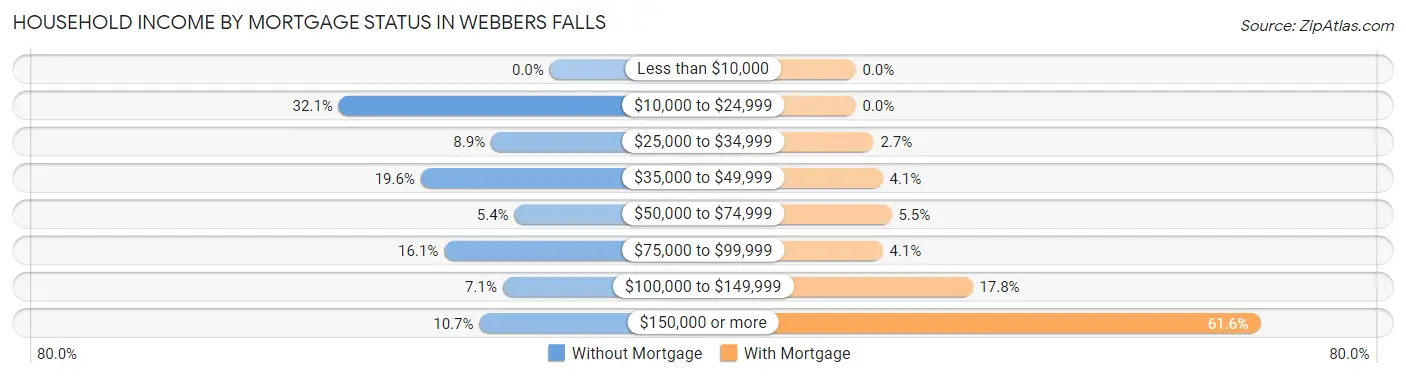
| Household Income | Without Mortgage | With Mortgage |
| Less than $10,000 | 0 (0.0%) | 0 (0.0%) |
| $10,000 to $24,999 | 18 (32.1%) | 0 (0.0%) |
| $25,000 to $34,999 | 5 (8.9%) | 2 (2.7%) |
| $35,000 to $49,999 | 11 (19.6%) | 3 (4.1%) |
| $50,000 to $74,999 | 3 (5.4%) | 4 (5.5%) |
| $75,000 to $99,999 | 9 (16.1%) | 3 (4.1%) |
| $100,000 to $149,999 | 4 (7.1%) | 13 (17.8%) |
| $150,000 or more | 6 (10.7%) | 45 (61.6%) |
| Total | 56 (100.0%) | 73 (100.0%) |
Property Value to Household Income Ratio in Webbers Falls
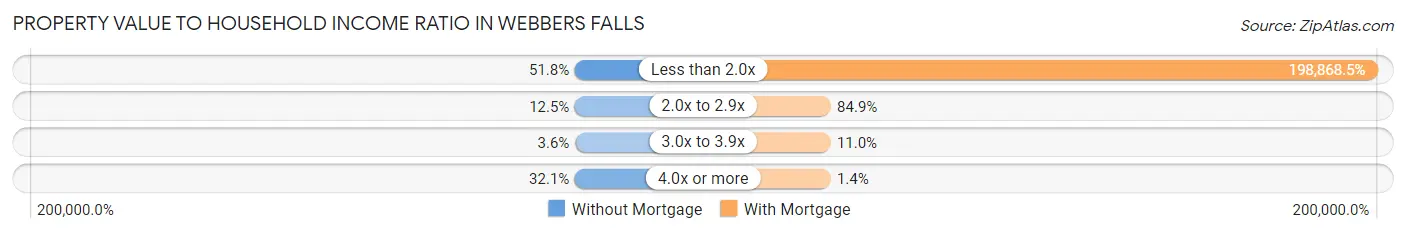
| Value-to-Income Ratio | Without Mortgage | With Mortgage |
| Less than 2.0x | 29 (51.8%) | 145,174 (198,868.5%) |
| 2.0x to 2.9x | 7 (12.5%) | 62 (84.9%) |
| 3.0x to 3.9x | 2 (3.6%) | 8 (11.0%) |
| 4.0x or more | 18 (32.1%) | 1 (1.4%) |
| Total | 56 (100.0%) | 73 (100.0%) |
Real Estate Taxes by Mortgage Status in Webbers Falls
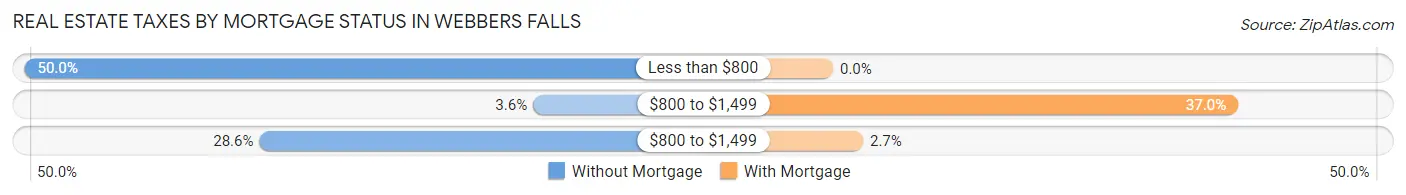
| Property Taxes | Without Mortgage | With Mortgage |
| Less than $800 | 28 (50.0%) | 0 (0.0%) |
| $800 to $1,499 | 2 (3.6%) | 27 (37.0%) |
| $800 to $1,499 | 16 (28.6%) | 2 (2.7%) |
| Total | 56 (100.0%) | 73 (100.0%) |
Health & Disability in Webbers Falls
Health Insurance Coverage by Age in Webbers Falls
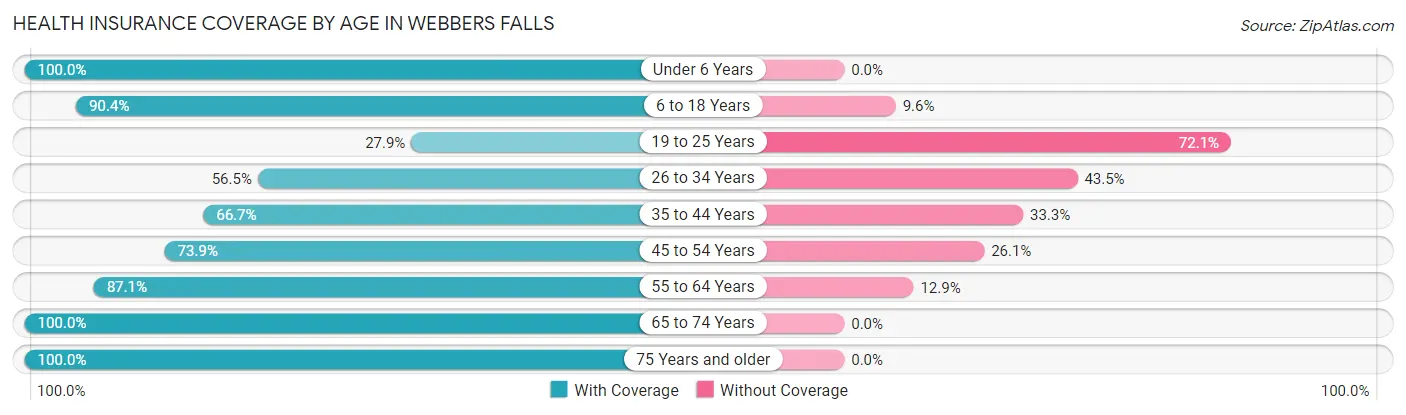
| Age Bracket | With Coverage | Without Coverage |
| Under 6 Years | 16 (100.0%) | 0 (0.0%) |
| 6 to 18 Years | 66 (90.4%) | 7 (9.6%) |
| 19 to 25 Years | 12 (27.9%) | 31 (72.1%) |
| 26 to 34 Years | 26 (56.5%) | 20 (43.5%) |
| 35 to 44 Years | 20 (66.7%) | 10 (33.3%) |
| 45 to 54 Years | 17 (73.9%) | 6 (26.1%) |
| 55 to 64 Years | 54 (87.1%) | 8 (12.9%) |
| 65 to 74 Years | 62 (100.0%) | 0 (0.0%) |
| 75 Years and older | 38 (100.0%) | 0 (0.0%) |
| Total | 311 (79.1%) | 82 (20.9%) |
Health Insurance Coverage by Citizenship Status in Webbers Falls
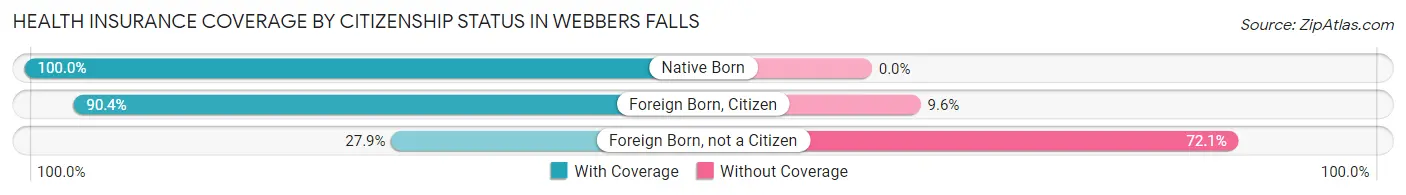
| Citizenship Status | With Coverage | Without Coverage |
| Native Born | 16 (100.0%) | 0 (0.0%) |
| Foreign Born, Citizen | 66 (90.4%) | 7 (9.6%) |
| Foreign Born, not a Citizen | 12 (27.9%) | 31 (72.1%) |
Health Insurance Coverage by Household Income in Webbers Falls
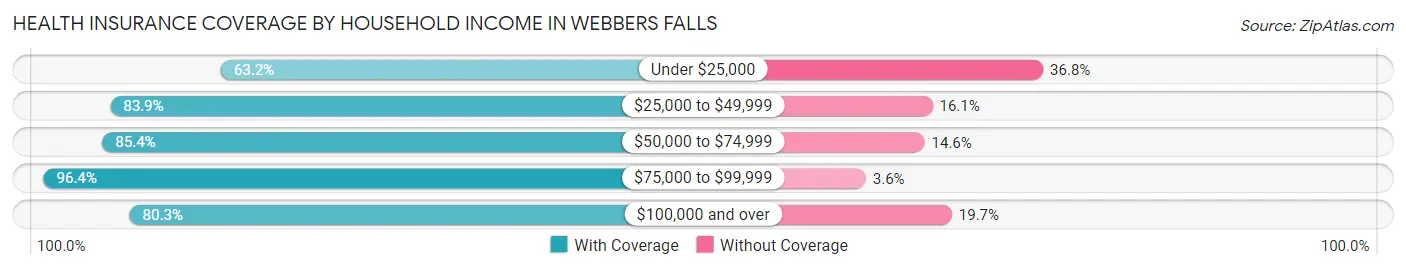
| Household Income | With Coverage | Without Coverage |
| Under $25,000 | 67 (63.2%) | 39 (36.8%) |
| $25,000 to $49,999 | 47 (83.9%) | 9 (16.1%) |
| $50,000 to $74,999 | 41 (85.4%) | 7 (14.6%) |
| $75,000 to $99,999 | 54 (96.4%) | 2 (3.6%) |
| $100,000 and over | 102 (80.3%) | 25 (19.7%) |
Public vs Private Health Insurance Coverage by Age in Webbers Falls
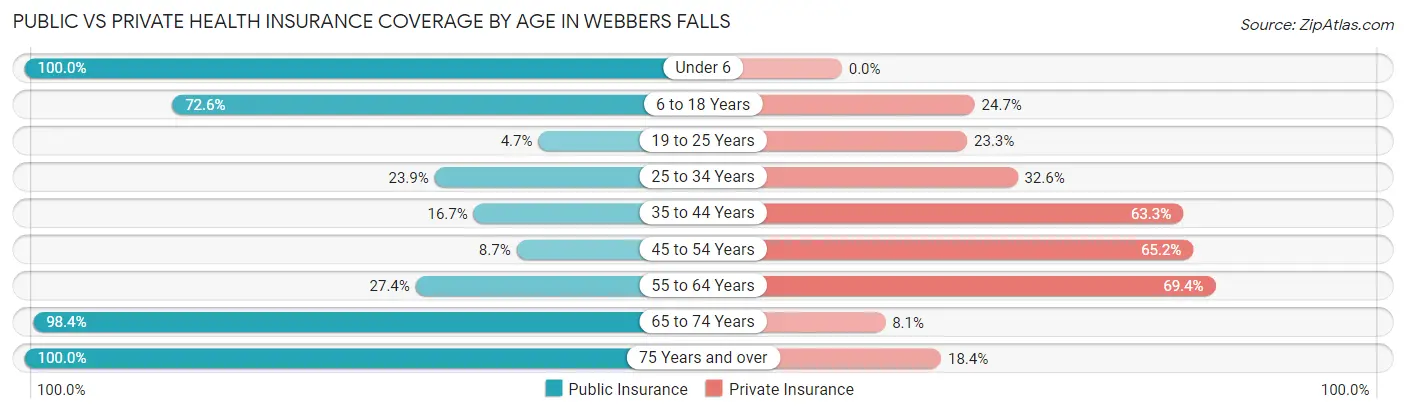
| Age Bracket | Public Insurance | Private Insurance |
| Under 6 | 16 (100.0%) | 0 (0.0%) |
| 6 to 18 Years | 53 (72.6%) | 18 (24.7%) |
| 19 to 25 Years | 2 (4.6%) | 10 (23.3%) |
| 25 to 34 Years | 11 (23.9%) | 15 (32.6%) |
| 35 to 44 Years | 5 (16.7%) | 19 (63.3%) |
| 45 to 54 Years | 2 (8.7%) | 15 (65.2%) |
| 55 to 64 Years | 17 (27.4%) | 43 (69.4%) |
| 65 to 74 Years | 61 (98.4%) | 5 (8.1%) |
| 75 Years and over | 38 (100.0%) | 7 (18.4%) |
| Total | 205 (52.2%) | 132 (33.6%) |
Disability Status by Sex by Age in Webbers Falls
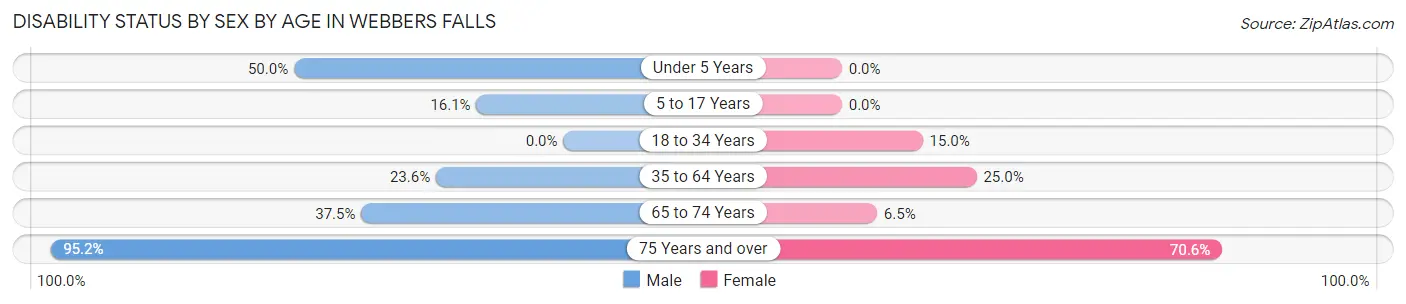
| Age Bracket | Male | Female |
| Under 5 Years | 1 (50.0%) | 0 (0.0%) |
| 5 to 17 Years | 5 (16.1%) | 0 (0.0%) |
| 18 to 34 Years | 0 (0.0%) | 6 (15.0%) |
| 35 to 64 Years | 13 (23.6%) | 15 (25.0%) |
| 65 to 74 Years | 6 (37.5%) | 3 (6.5%) |
| 75 Years and over | 20 (95.2%) | 12 (70.6%) |
Disability Class by Sex by Age in Webbers Falls
Disability Class: Hearing Difficulty
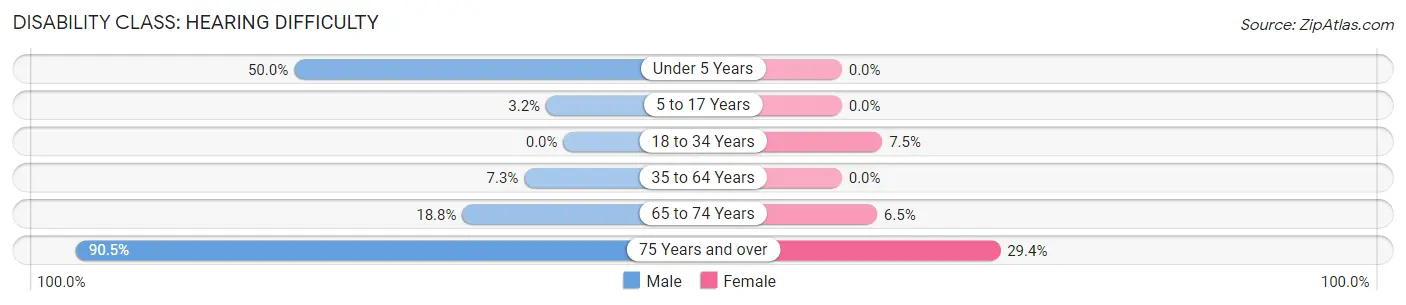
| Age Bracket | Male | Female |
| Under 5 Years | 1 (50.0%) | 0 (0.0%) |
| 5 to 17 Years | 1 (3.2%) | 0 (0.0%) |
| 18 to 34 Years | 0 (0.0%) | 3 (7.5%) |
| 35 to 64 Years | 4 (7.3%) | 0 (0.0%) |
| 65 to 74 Years | 3 (18.8%) | 3 (6.5%) |
| 75 Years and over | 19 (90.5%) | 5 (29.4%) |
Disability Class: Vision Difficulty
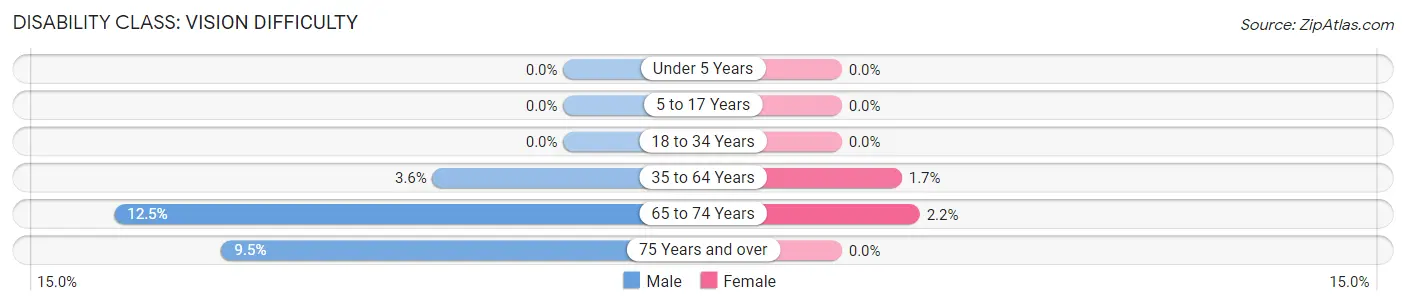
| Age Bracket | Male | Female |
| Under 5 Years | 0 (0.0%) | 0 (0.0%) |
| 5 to 17 Years | 0 (0.0%) | 0 (0.0%) |
| 18 to 34 Years | 0 (0.0%) | 0 (0.0%) |
| 35 to 64 Years | 2 (3.6%) | 1 (1.7%) |
| 65 to 74 Years | 2 (12.5%) | 1 (2.2%) |
| 75 Years and over | 2 (9.5%) | 0 (0.0%) |
Disability Class: Cognitive Difficulty
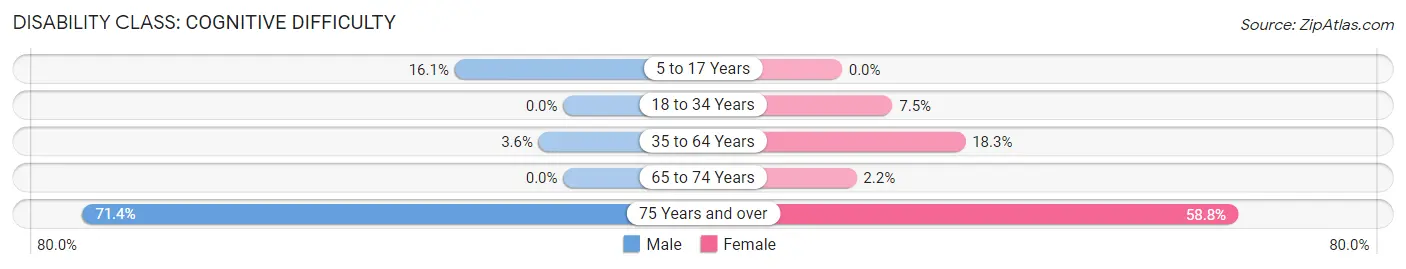
| Age Bracket | Male | Female |
| 5 to 17 Years | 5 (16.1%) | 0 (0.0%) |
| 18 to 34 Years | 0 (0.0%) | 3 (7.5%) |
| 35 to 64 Years | 2 (3.6%) | 11 (18.3%) |
| 65 to 74 Years | 0 (0.0%) | 1 (2.2%) |
| 75 Years and over | 15 (71.4%) | 10 (58.8%) |
Disability Class: Ambulatory Difficulty
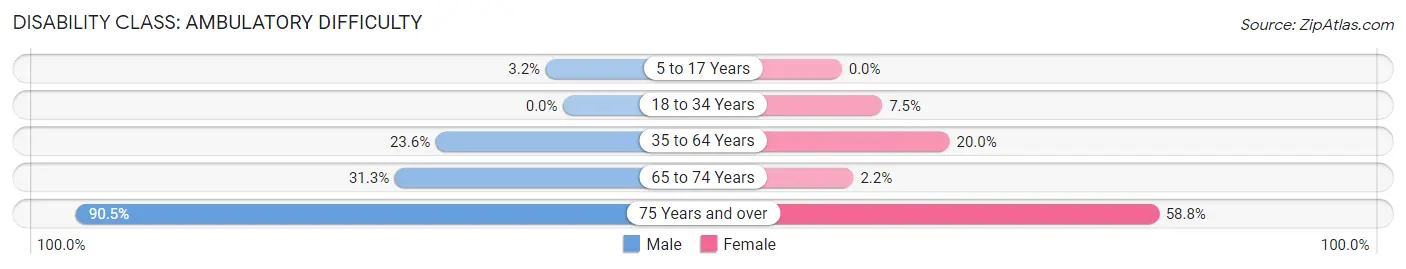
| Age Bracket | Male | Female |
| 5 to 17 Years | 1 (3.2%) | 0 (0.0%) |
| 18 to 34 Years | 0 (0.0%) | 3 (7.5%) |
| 35 to 64 Years | 13 (23.6%) | 12 (20.0%) |
| 65 to 74 Years | 5 (31.2%) | 1 (2.2%) |
| 75 Years and over | 19 (90.5%) | 10 (58.8%) |
Disability Class: Self-Care Difficulty
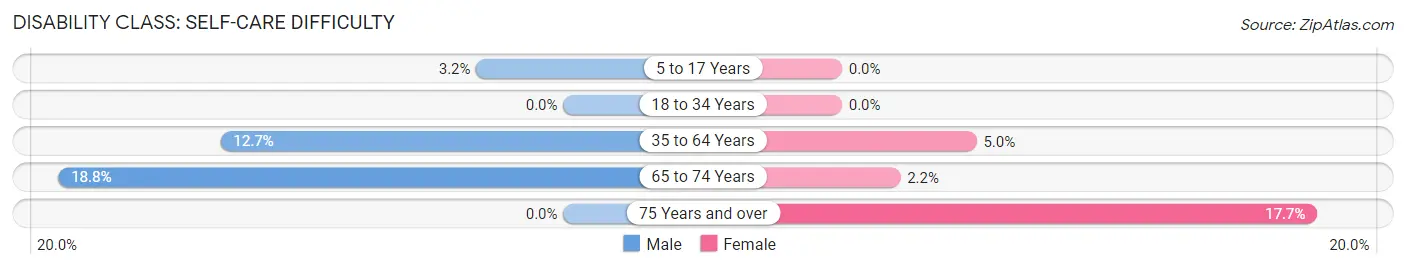
| Age Bracket | Male | Female |
| 5 to 17 Years | 1 (3.2%) | 0 (0.0%) |
| 18 to 34 Years | 0 (0.0%) | 0 (0.0%) |
| 35 to 64 Years | 7 (12.7%) | 3 (5.0%) |
| 65 to 74 Years | 3 (18.8%) | 1 (2.2%) |
| 75 Years and over | 0 (0.0%) | 3 (17.6%) |
Technology Access in Webbers Falls
Computing Device Access in Webbers Falls
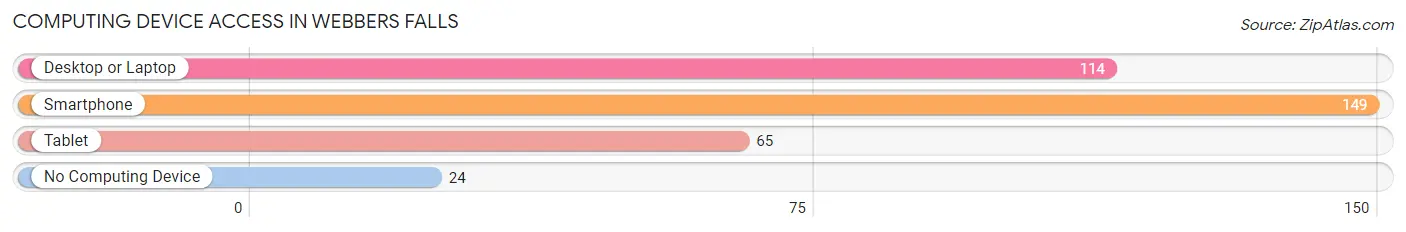
| Device Type | # Households | % Households |
| Desktop or Laptop | 114 | 65.9% |
| Smartphone | 149 | 86.1% |
| Tablet | 65 | 37.6% |
| No Computing Device | 24 | 13.9% |
| Total | 173 | 100.0% |
Internet Access in Webbers Falls
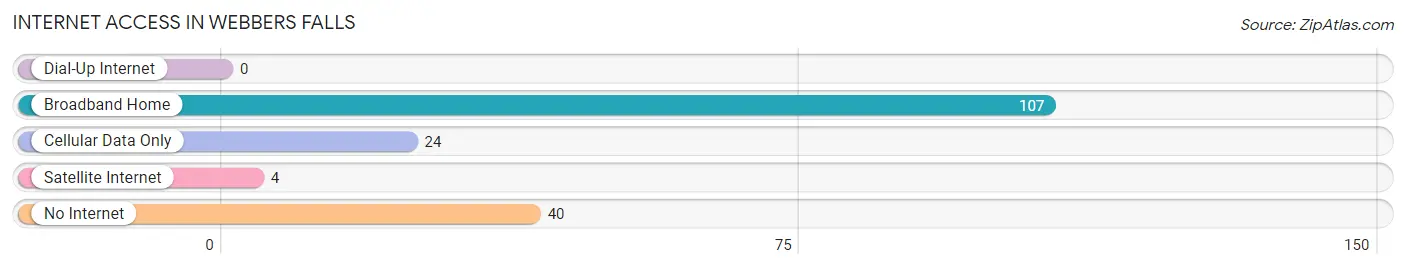
| Internet Type | # Households | % Households |
| Dial-Up Internet | 0 | 0.0% |
| Broadband Home | 107 | 61.9% |
| Cellular Data Only | 24 | 13.9% |
| Satellite Internet | 4 | 2.3% |
| No Internet | 40 | 23.1% |
| Total | 173 | 100.0% |
Webbers Falls Summary
Webers Falls is a small town located in Muskogee County, Oklahoma. It is situated on the Arkansas River, approximately 20 miles east of Muskogee. The town was founded in 1872 and named after Chief Walter Webber of the Creek Nation. The town has a population of approximately 1,000 people and is known for its historic sites, outdoor recreation, and friendly atmosphere.
History
Webers Falls was founded in 1872 by the Creek Nation. The town was named after Chief Walter Webber, who was a prominent leader of the Creek Nation. The town was originally a trading post and ferry crossing on the Arkansas River. In 1873, the first post office was established in the town.
In the late 1800s, the town began to grow and develop. The first school was built in 1883 and the first church was built in 1885. The town also had a cotton gin, a grist mill, and a sawmill.
In the early 1900s, the town continued to grow and develop. The first bank was established in 1906 and the first newspaper was published in 1907. The town also had a hotel, a movie theater, and a variety of stores.
In the 1920s, the town experienced a period of decline. The Great Depression caused many businesses to close and the population of the town decreased.
In the 1940s, the town began to experience a period of growth. The population increased and new businesses opened. The town also had a variety of recreational activities, including a golf course and a swimming pool.
In the 1950s, the town experienced a period of decline. The population decreased and many businesses closed.
In the 1960s, the town began to experience a period of growth. The population increased and new businesses opened. The town also had a variety of recreational activities, including a golf course and a swimming pool.
In the 1970s, the town experienced a period of decline. The population decreased and many businesses closed.
In the 1980s, the town began to experience a period of growth. The population increased and new businesses opened. The town also had a variety of recreational activities, including a golf course and a swimming pool.
In the 1990s, the town experienced a period of decline. The population decreased and many businesses closed.
Geography
Webers Falls is located in Muskogee County, Oklahoma. It is situated on the Arkansas River, approximately 20 miles east of Muskogee. The town is located in a rural area and is surrounded by rolling hills and farmland. The town has a total area of 1.2 square miles, all of which is land.
Economy
The economy of Webers Falls is largely based on agriculture and tourism. The town is home to a variety of farms, including cattle, poultry, and vegetable farms. The town also has a variety of tourist attractions, including historic sites, outdoor recreation, and a variety of shops and restaurants.
Demographics
Webers Falls has a population of approximately 1,000 people. The town is predominantly white, with a small percentage of African Americans and Native Americans. The median household income is $30,000 and the median home value is $80,000. The town has a high school graduation rate of 85%.
Common Questions
What is Per Capita Income in Webbers Falls?
Per Capita income in Webbers Falls is $38,116.
What is the Median Family Income in Webbers Falls?
Median Family Income in Webbers Falls is $86,042.
What is the Median Household income in Webbers Falls?
Median Household Income in Webbers Falls is $64,688.
What is Income or Wage Gap in Webbers Falls?
Income or Wage Gap in Webbers Falls is 5.4%.
Women in Webbers Falls earn 94.6 cents for every dollar earned by a man.
What is Inequality or Gini Index in Webbers Falls?
Inequality or Gini Index in Webbers Falls is 0.54.
What is the Total Population of Webbers Falls?
Total Population of Webbers Falls is 393.
What is the Total Male Population of Webbers Falls?
Total Male Population of Webbers Falls is 174.
What is the Total Female Population of Webbers Falls?
Total Female Population of Webbers Falls is 219.
What is the Ratio of Males per 100 Females in Webbers Falls?
There are 79.45 Males per 100 Females in Webbers Falls.
What is the Ratio of Females per 100 Males in Webbers Falls?
There are 125.86 Females per 100 Males in Webbers Falls.
What is the Median Population Age in Webbers Falls?
Median Population Age in Webbers Falls is 43.9 Years.
What is the Average Family Size in Webbers Falls
Average Family Size in Webbers Falls is 2.5 People.
What is the Average Household Size in Webbers Falls
Average Household Size in Webbers Falls is 2.3 People.
How Large is the Labor Force in Webbers Falls?
There are 151 People in the Labor Forcein in Webbers Falls.
What is the Percentage of People in the Labor Force in Webbers Falls?
46.2% of People are in the Labor Force in Webbers Falls.
What is the Unemployment Rate in Webbers Falls?
Unemployment Rate in Webbers Falls is 17.9%.