Elgin, OK Map & Demographics
Elgin Map
Elgin Overview
$32,750
PER CAPITA INCOME
$88,958
AVG FAMILY INCOME
$78,288
AVG HOUSEHOLD INCOME
40.2%
WAGE / INCOME GAP [ % ]
59.8¢/ $1
WAGE / INCOME GAP [ $ ]
$9,517
FAMILY INCOME DEFICIT
0.34
INEQUALITY / GINI INDEX
3,498
TOTAL POPULATION
1,715
MALE POPULATION
1,783
FEMALE POPULATION
96.19
MALES / 100 FEMALES
103.97
FEMALES / 100 MALES
31.3
MEDIAN AGE
3.5
AVG FAMILY SIZE
2.8
AVG HOUSEHOLD SIZE
1,598
LABOR FORCE [ PEOPLE ]
66.6%
PERCENT IN LABOR FORCE
4.2%
UNEMPLOYMENT RATE
Elgin Zip Codes
Elgin Area Codes
Income in Elgin
Income Overview in Elgin
Per Capita Income in Elgin is $32,750, while median incomes of families and households are $88,958 and $78,288 respectively.
| Characteristic | Number | Measure |
| Per Capita Income | 3,498 | $32,750 |
| Median Family Income | 884 | $88,958 |
| Mean Family Income | 884 | $103,942 |
| Median Household Income | 1,235 | $78,288 |
| Mean Household Income | 1,235 | $91,498 |
| Income Deficit | 884 | $9,517 |
| Wage / Income Gap (%) | 3,498 | 40.17% |
| Wage / Income Gap ($) | 3,498 | 59.83¢ per $1 |
| Gini / Inequality Index | 3,498 | 0.34 |
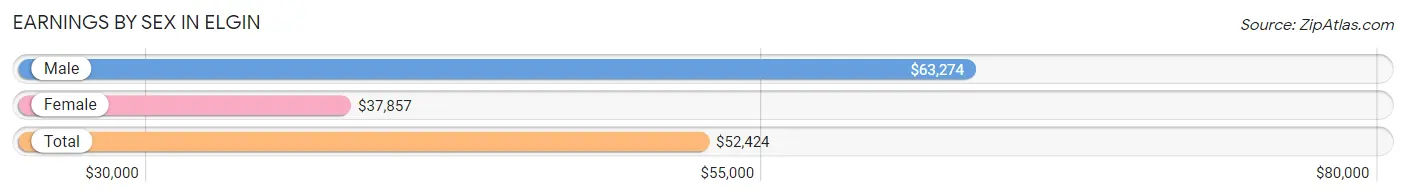
Earnings by Sex in Elgin
Average Earnings in Elgin are $52,424, $63,274 for men and $37,857 for women, a difference of 40.2%.
| Sex | Number | Average Earnings |
| Male | 912 (54.7%) | $63,274 |
| Female | 756 (45.3%) | $37,857 |
| Total | 1,668 (100.0%) | $52,424 |
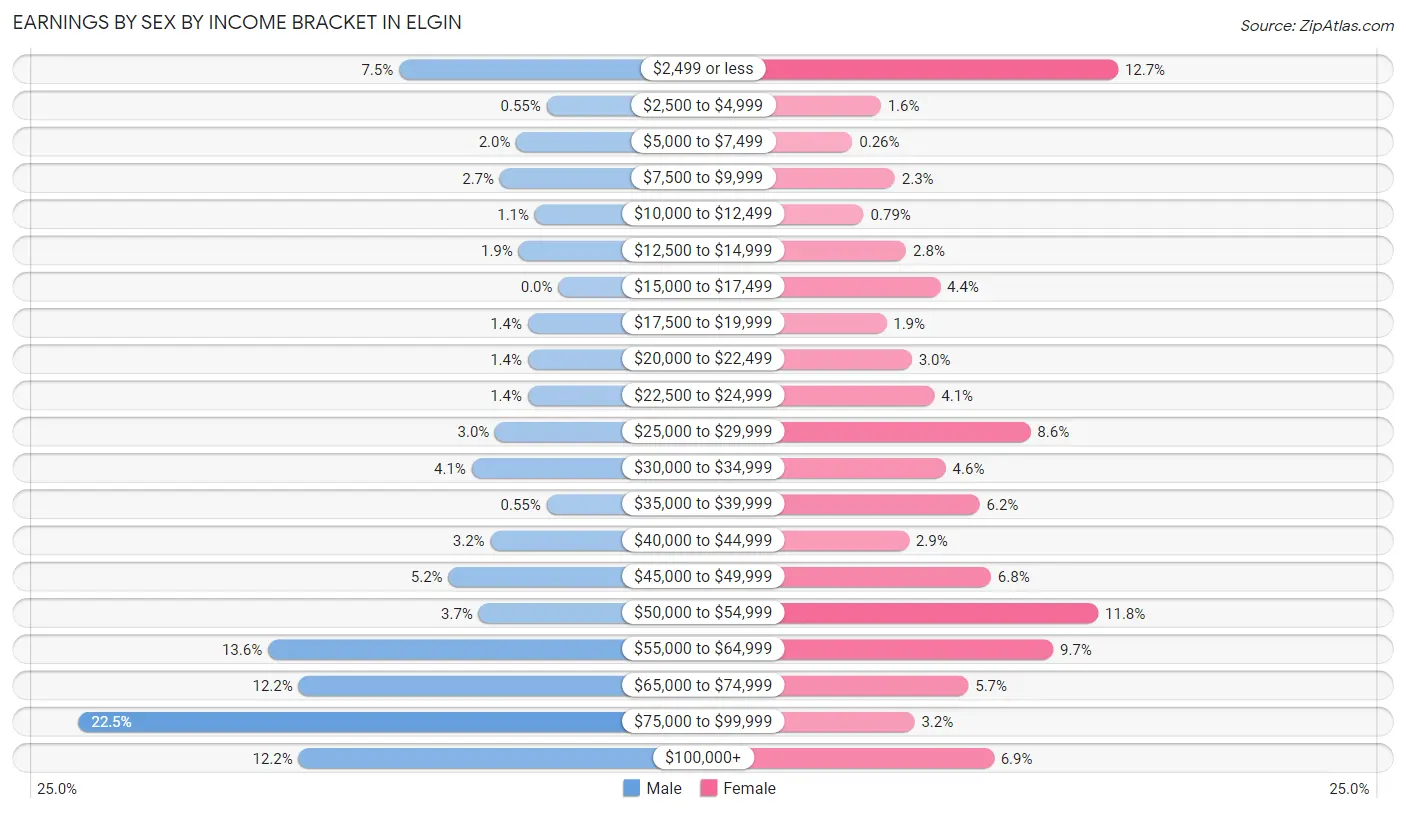
Earnings by Sex by Income Bracket in Elgin
The most common earnings brackets in Elgin are $75,000 to $99,999 for men (205 | 22.5%) and $2,499 or less for women (96 | 12.7%).
| Income | Male | Female |
| $2,499 or less | 68 (7.5%) | 96 (12.7%) |
| $2,500 to $4,999 | 5 (0.5%) | 12 (1.6%) |
| $5,000 to $7,499 | 18 (2.0%) | 2 (0.3%) |
| $7,500 to $9,999 | 25 (2.7%) | 17 (2.2%) |
| $10,000 to $12,499 | 10 (1.1%) | 6 (0.8%) |
| $12,500 to $14,999 | 17 (1.9%) | 21 (2.8%) |
| $15,000 to $17,499 | 0 (0.0%) | 33 (4.4%) |
| $17,500 to $19,999 | 13 (1.4%) | 14 (1.8%) |
| $20,000 to $22,499 | 13 (1.4%) | 23 (3.0%) |
| $22,500 to $24,999 | 13 (1.4%) | 31 (4.1%) |
| $25,000 to $29,999 | 27 (3.0%) | 65 (8.6%) |
| $30,000 to $34,999 | 37 (4.1%) | 35 (4.6%) |
| $35,000 to $39,999 | 5 (0.5%) | 47 (6.2%) |
| $40,000 to $44,999 | 29 (3.2%) | 22 (2.9%) |
| $45,000 to $49,999 | 47 (5.1%) | 51 (6.8%) |
| $50,000 to $54,999 | 34 (3.7%) | 89 (11.8%) |
| $55,000 to $64,999 | 124 (13.6%) | 73 (9.7%) |
| $65,000 to $74,999 | 111 (12.2%) | 43 (5.7%) |
| $75,000 to $99,999 | 205 (22.5%) | 24 (3.2%) |
| $100,000+ | 111 (12.2%) | 52 (6.9%) |
| Total | 912 (100.0%) | 756 (100.0%) |
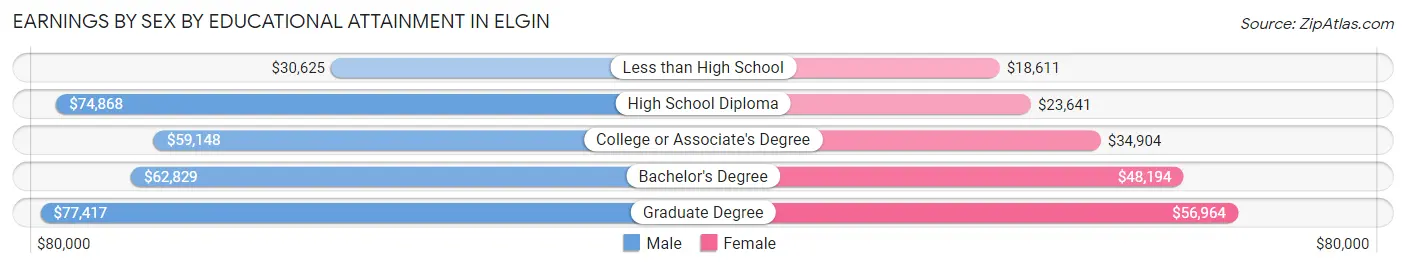
Earnings by Sex by Educational Attainment in Elgin
Average earnings in Elgin are $68,056 for men and $41,607 for women, a difference of 38.9%. Men with an educational attainment of graduate degree enjoy the highest average annual earnings of $77,417, while those with less than high school education earn the least with $30,625. Women with an educational attainment of graduate degree earn the most with the average annual earnings of $56,964, while those with less than high school education have the smallest earnings of $18,611.
| Educational Attainment | Male Income | Female Income |
| Less than High School | $30,625 | $18,611 |
| High School Diploma | $74,868 | $23,641 |
| College or Associate's Degree | $59,148 | $34,904 |
| Bachelor's Degree | $62,829 | $48,194 |
| Graduate Degree | $77,417 | $56,964 |
| Total | $68,056 | $41,607 |
Family Income in Elgin
Family Income Brackets in Elgin
According to the Elgin family income data, there are 207 families falling into the $100,000 to $149,999 income range, which is the most common income bracket and makes up 23.4% of all families. Conversely, the less than $10,000 income bracket is the least frequent group with only 12 families (1.4%) belonging to this category.
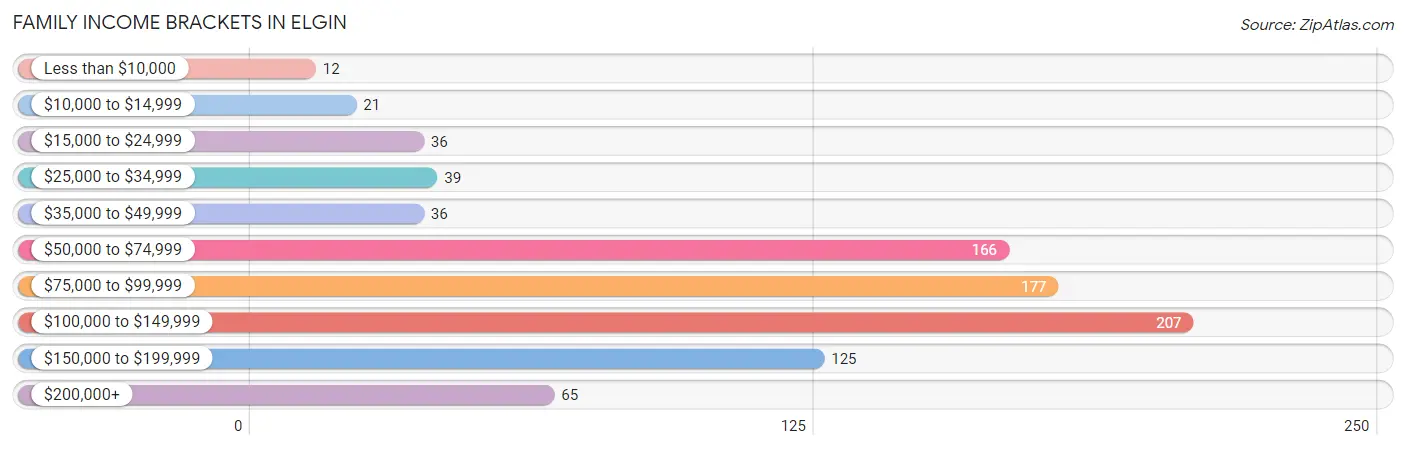
| Income Bracket | # Families | % Families |
| Less than $10,000 | 12 | 1.4% |
| $10,000 to $14,999 | 21 | 2.4% |
| $15,000 to $24,999 | 36 | 4.1% |
| $25,000 to $34,999 | 39 | 4.4% |
| $35,000 to $49,999 | 36 | 4.1% |
| $50,000 to $74,999 | 166 | 18.8% |
| $75,000 to $99,999 | 177 | 20.0% |
| $100,000 to $149,999 | 207 | 23.4% |
| $150,000 to $199,999 | 125 | 14.1% |
| $200,000+ | 65 | 7.4% |
Family Income by Famaliy Size in Elgin
6-person families (45 | 5.1%) account for the highest median family income in Elgin with $127,574 per family, while 3-person families (244 | 27.6%) have the highest median income of $41,759 per family member.
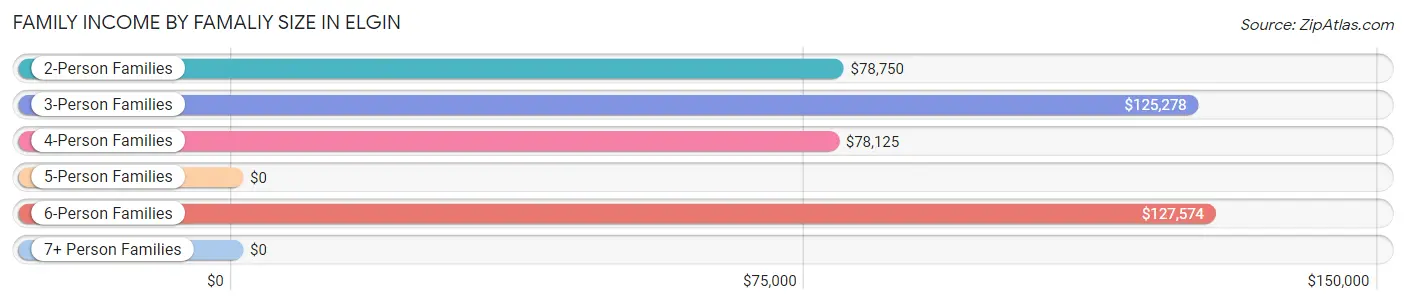
| Income Bracket | # Families | Median Income |
| 2-Person Families | 263 (29.7%) | $78,750 |
| 3-Person Families | 244 (27.6%) | $125,278 |
| 4-Person Families | 222 (25.1%) | $78,125 |
| 5-Person Families | 110 (12.4%) | $0 |
| 6-Person Families | 45 (5.1%) | $127,574 |
| 7+ Person Families | 0 (0.0%) | $0 |
| Total | 884 (100.0%) | $88,958 |
Family Income by Number of Earners in Elgin
The median family income in Elgin is $88,958, with families comprising 3+ earners (106) having the highest median family income of $135,250, while families with no earners (56) have the lowest median family income of $48,462, accounting for 12.0% and 6.3% of families, respectively.
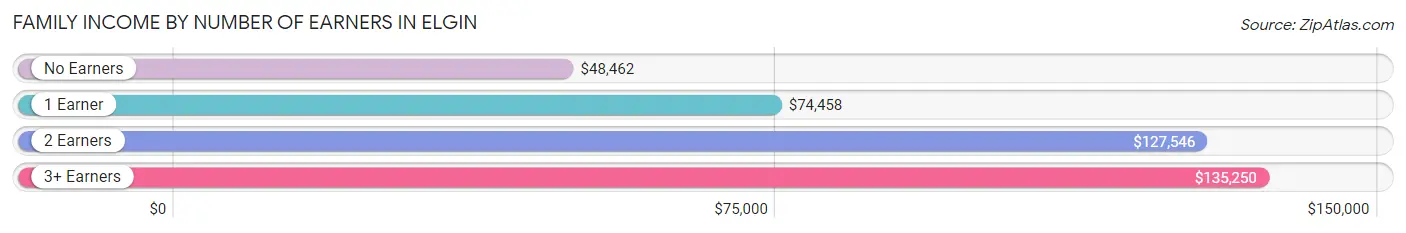
| Number of Earners | # Families | Median Income |
| No Earners | 56 (6.3%) | $48,462 |
| 1 Earner | 351 (39.7%) | $74,458 |
| 2 Earners | 371 (42.0%) | $127,546 |
| 3+ Earners | 106 (12.0%) | $135,250 |
| Total | 884 (100.0%) | $88,958 |
Household Income in Elgin
Household Income Brackets in Elgin
With 310 households falling in the category, the $50,000 to $74,999 income range is the most frequent in Elgin, accounting for 25.1% of all households. In contrast, only 25 households (2.0%) fall into the less than $10,000 income bracket, making it the least populous group.
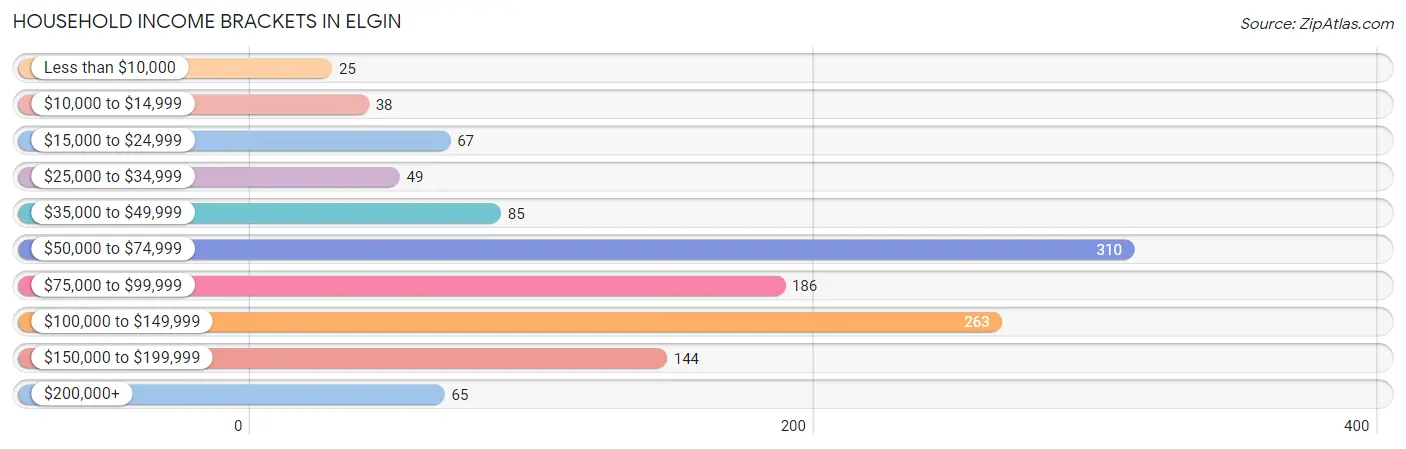
| Income Bracket | # Households | % Households |
| Less than $10,000 | 25 | 2.0% |
| $10,000 to $14,999 | 38 | 3.1% |
| $15,000 to $24,999 | 67 | 5.4% |
| $25,000 to $34,999 | 49 | 4.0% |
| $35,000 to $49,999 | 85 | 6.9% |
| $50,000 to $74,999 | 310 | 25.1% |
| $75,000 to $99,999 | 186 | 15.1% |
| $100,000 to $149,999 | 263 | 21.3% |
| $150,000 to $199,999 | 144 | 11.7% |
| $200,000+ | 65 | 5.3% |
Household Income by Householder Age in Elgin
The median household income in Elgin is $78,288, with the highest median household income of $127,222 found in the 45 to 64 years age bracket for the primary householder. A total of 364 households (29.5%) fall into this category. Meanwhile, the 15 to 24 years age bracket for the primary householder has the lowest median household income of $0, with 28 households (2.3%) in this group.
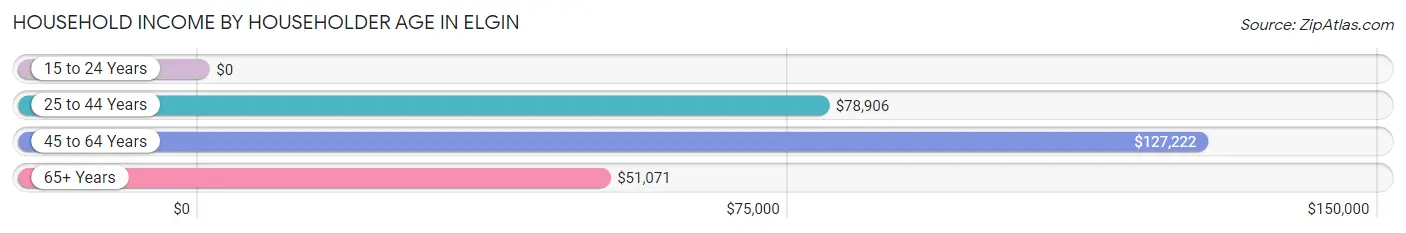
| Income Bracket | # Households | Median Income |
| 15 to 24 Years | 28 (2.3%) | $0 |
| 25 to 44 Years | 617 (50.0%) | $78,906 |
| 45 to 64 Years | 364 (29.5%) | $127,222 |
| 65+ Years | 226 (18.3%) | $51,071 |
| Total | 1,235 (100.0%) | $78,288 |
Poverty in Elgin
Income Below Poverty by Sex and Age in Elgin
With 10.1% poverty level for males and 12.3% for females among the residents of Elgin, 5 year old males and 15 year old females are the most vulnerable to poverty, with 42 males (75.0%) and 11 females (32.4%) in their respective age groups living below the poverty level.
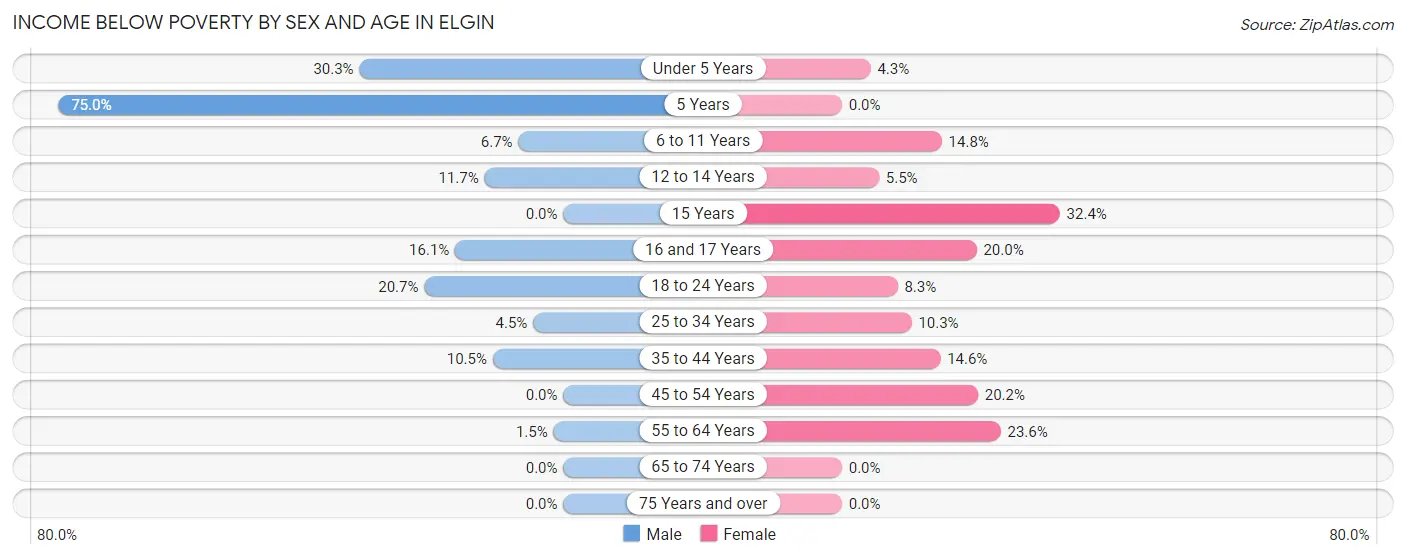
| Age Bracket | Male | Female |
| Under 5 Years | 33 (30.3%) | 6 (4.3%) |
| 5 Years | 42 (75.0%) | 0 (0.0%) |
| 6 to 11 Years | 13 (6.7%) | 35 (14.8%) |
| 12 to 14 Years | 11 (11.7%) | 6 (5.5%) |
| 15 Years | 0 (0.0%) | 11 (32.4%) |
| 16 and 17 Years | 9 (16.1%) | 8 (20.0%) |
| 18 to 24 Years | 19 (20.6%) | 10 (8.3%) |
| 25 to 34 Years | 12 (4.5%) | 36 (10.3%) |
| 35 to 44 Years | 31 (10.5%) | 32 (14.6%) |
| 45 to 54 Years | 0 (0.0%) | 43 (20.2%) |
| 55 to 64 Years | 2 (1.5%) | 33 (23.6%) |
| 65 to 74 Years | 0 (0.0%) | 0 (0.0%) |
| 75 Years and over | 0 (0.0%) | 0 (0.0%) |
| Total | 172 (10.1%) | 220 (12.3%) |
Income Above Poverty by Sex and Age in Elgin
According to the poverty statistics in Elgin, males aged 15 years and females aged 5 years are the age groups that are most secure financially, with 100.0% of males and 100.0% of females in these age groups living above the poverty line.
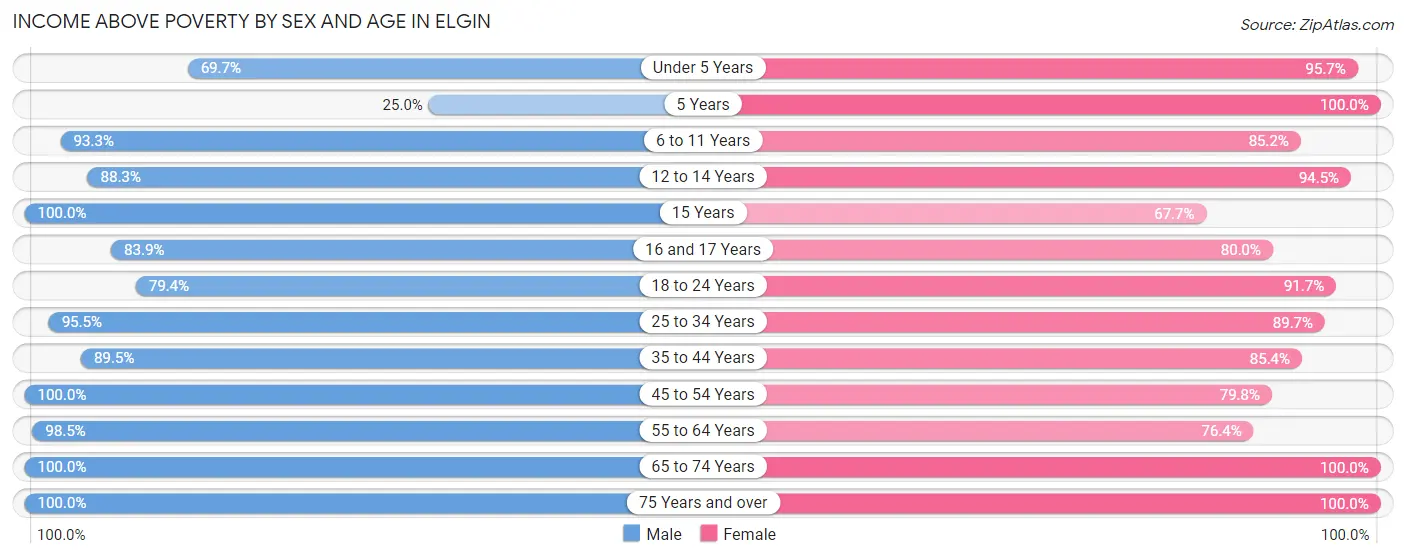
| Age Bracket | Male | Female |
| Under 5 Years | 76 (69.7%) | 135 (95.7%) |
| 5 Years | 14 (25.0%) | 51 (100.0%) |
| 6 to 11 Years | 182 (93.3%) | 201 (85.2%) |
| 12 to 14 Years | 83 (88.3%) | 103 (94.5%) |
| 15 Years | 70 (100.0%) | 23 (67.6%) |
| 16 and 17 Years | 47 (83.9%) | 32 (80.0%) |
| 18 to 24 Years | 73 (79.3%) | 111 (91.7%) |
| 25 to 34 Years | 256 (95.5%) | 312 (89.7%) |
| 35 to 44 Years | 265 (89.5%) | 187 (85.4%) |
| 45 to 54 Years | 153 (100.0%) | 170 (79.8%) |
| 55 to 64 Years | 135 (98.5%) | 107 (76.4%) |
| 65 to 74 Years | 143 (100.0%) | 101 (100.0%) |
| 75 Years and over | 42 (100.0%) | 30 (100.0%) |
| Total | 1,539 (89.9%) | 1,563 (87.7%) |
Income Below Poverty Among Married-Couple Families in Elgin
The poverty statistics for married-couple families in Elgin show that 6.2% or 46 of the total 741 families live below the poverty line. Families with 1 or 2 children have the highest poverty rate of 9.2%, comprising of 40 families. On the other hand, families with 3 or 4 children have the lowest poverty rate of 0.0%, which includes 0 families.
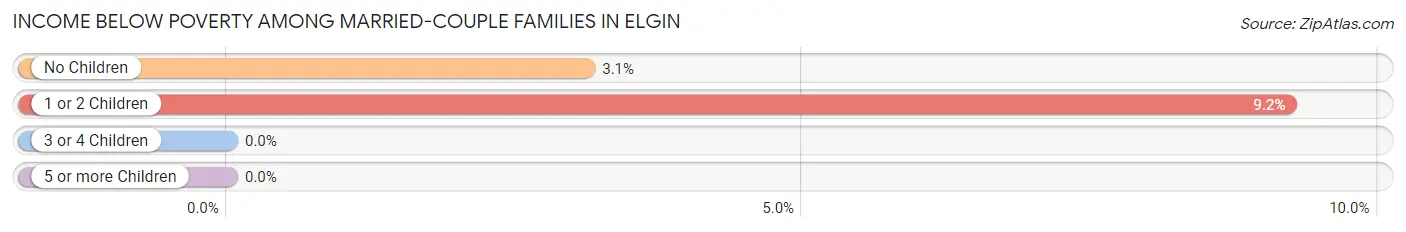
| Children | Above Poverty | Below Poverty |
| No Children | 187 (96.9%) | 6 (3.1%) |
| 1 or 2 Children | 394 (90.8%) | 40 (9.2%) |
| 3 or 4 Children | 114 (100.0%) | 0 (0.0%) |
| 5 or more Children | 0 (0.0%) | 0 (0.0%) |
| Total | 695 (93.8%) | 46 (6.2%) |
Income Below Poverty Among Single-Parent Households in Elgin
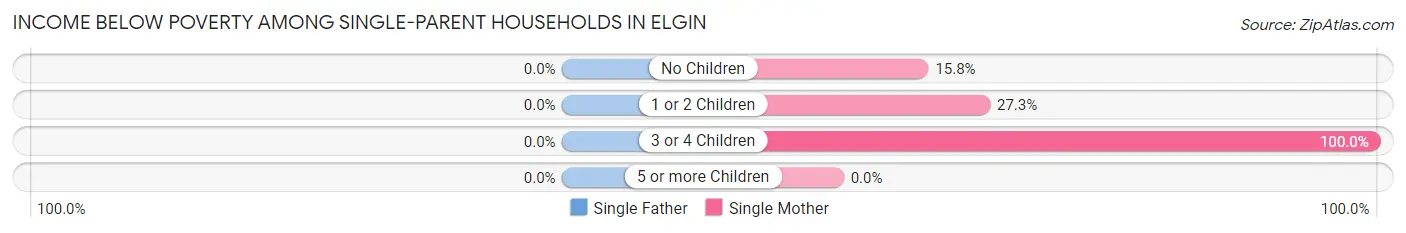
| Children | Single Father | Single Mother |
| No Children | 0 (0.0%) | 6 (15.8%) |
| 1 or 2 Children | 0 (0.0%) | 12 (27.3%) |
| 3 or 4 Children | 0 (0.0%) | 13 (100.0%) |
| 5 or more Children | 0 (0.0%) | 0 (0.0%) |
| Total | 0 (0.0%) | 31 (32.6%) |
Income Below Poverty Among Married-Couple vs Single-Parent Households in Elgin
The poverty data for Elgin shows that 46 of the married-couple family households (6.2%) and 31 of the single-parent households (21.7%) are living below the poverty level. Within the married-couple family households, those with 1 or 2 children have the highest poverty rate, with 40 households (9.2%) falling below the poverty line. Among the single-parent households, those with 3 or 4 children have the highest poverty rate, with 13 household (68.4%) living below poverty.
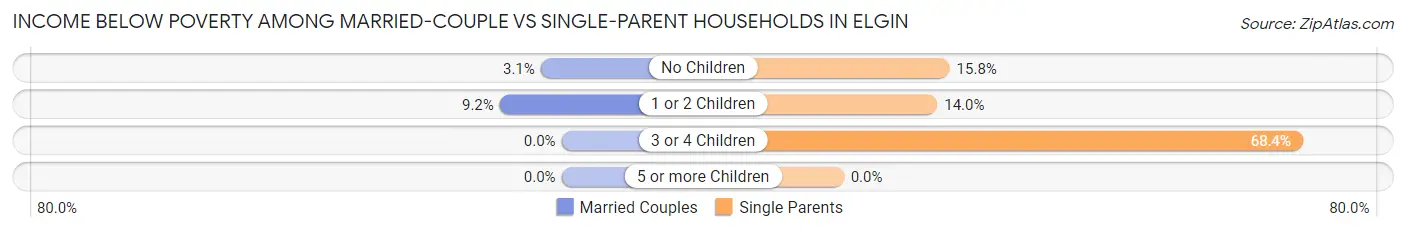
| Children | Married-Couple Families | Single-Parent Households |
| No Children | 6 (3.1%) | 6 (15.8%) |
| 1 or 2 Children | 40 (9.2%) | 12 (14.0%) |
| 3 or 4 Children | 0 (0.0%) | 13 (68.4%) |
| 5 or more Children | 0 (0.0%) | 0 (0.0%) |
| Total | 46 (6.2%) | 31 (21.7%) |
Race in Elgin
The most populous races in Elgin are White / Caucasian (2,480 | 70.9%), Two or more Races (680 | 19.4%), and Hispanic or Latino (607 | 17.3%).
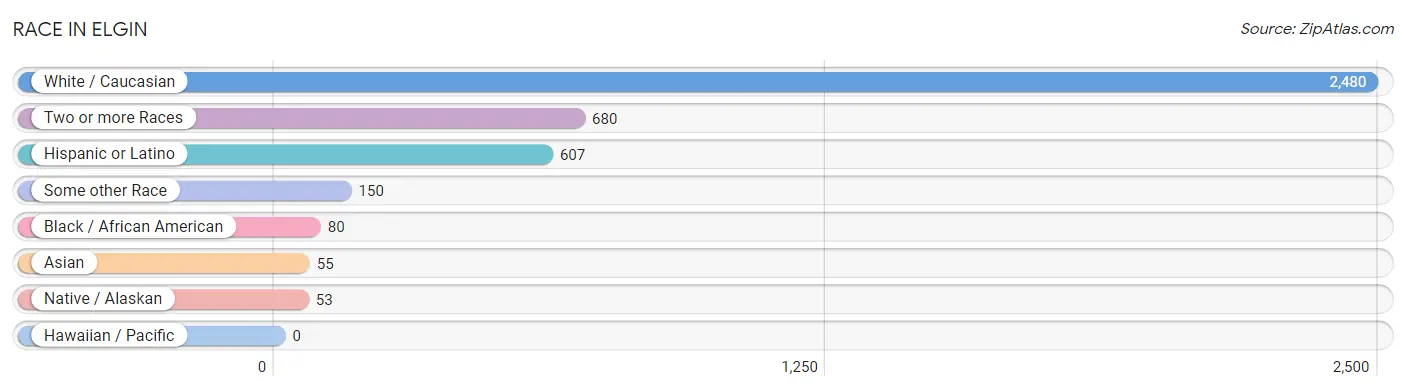
| Race | # Population | % Population |
| Asian | 55 | 1.6% |
| Black / African American | 80 | 2.3% |
| Hawaiian / Pacific | 0 | 0.0% |
| Hispanic or Latino | 607 | 17.3% |
| Native / Alaskan | 53 | 1.5% |
| White / Caucasian | 2,480 | 70.9% |
| Two or more Races | 680 | 19.4% |
| Some other Race | 150 | 4.3% |
| Total | 3,498 | 100.0% |
Ancestry in Elgin
The most populous ancestries reported in Elgin are German (502 | 14.3%), Mexican (426 | 12.2%), English (369 | 10.5%), Irish (314 | 9.0%), and American (175 | 5.0%), together accounting for 51.1% of all Elgin residents.
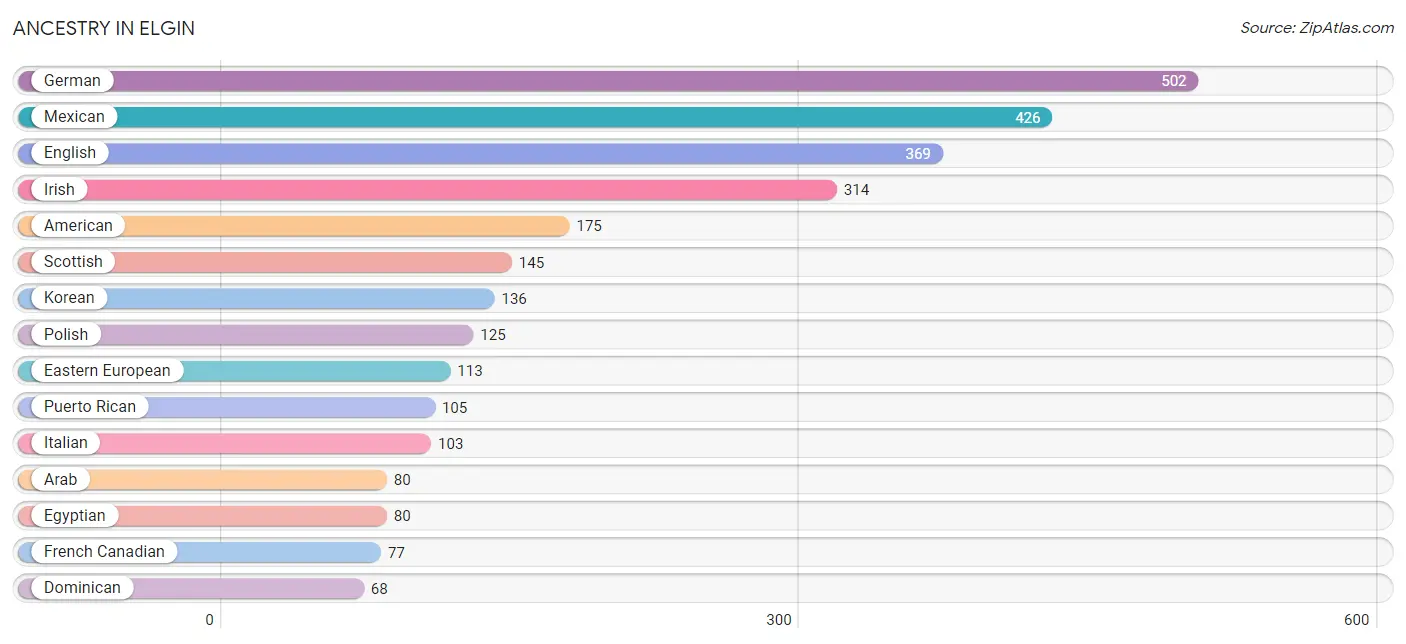
| Ancestry | # Population | % Population |
| African | 9 | 0.3% |
| American | 175 | 5.0% |
| Apache | 6 | 0.2% |
| Arab | 80 | 2.3% |
| Austrian | 5 | 0.1% |
| Bahamian | 10 | 0.3% |
| Bhutanese | 25 | 0.7% |
| British | 14 | 0.4% |
| Burmese | 11 | 0.3% |
| Cajun | 7 | 0.2% |
| Celtic | 31 | 0.9% |
| Central American | 8 | 0.2% |
| Central American Indian | 4 | 0.1% |
| Cherokee | 39 | 1.1% |
| Chickasaw | 3 | 0.1% |
| Choctaw | 19 | 0.5% |
| Comanche | 30 | 0.9% |
| Creek | 14 | 0.4% |
| Danish | 4 | 0.1% |
| Dominican | 68 | 1.9% |
| Dutch | 35 | 1.0% |
| Eastern European | 113 | 3.2% |
| Egyptian | 80 | 2.3% |
| English | 369 | 10.5% |
| European | 42 | 1.2% |
| French | 53 | 1.5% |
| French Canadian | 77 | 2.2% |
| German | 502 | 14.3% |
| Guatemalan | 8 | 0.2% |
| Irish | 314 | 9.0% |
| Italian | 103 | 2.9% |
| Korean | 136 | 3.9% |
| Mexican | 426 | 12.2% |
| Norwegian | 33 | 0.9% |
| Pakistani | 4 | 0.1% |
| Polish | 125 | 3.6% |
| Pueblo | 7 | 0.2% |
| Puerto Rican | 105 | 3.0% |
| Russian | 33 | 0.9% |
| Scandinavian | 14 | 0.4% |
| Scotch-Irish | 12 | 0.3% |
| Scottish | 145 | 4.2% |
| Sioux | 26 | 0.7% |
| Subsaharan African | 9 | 0.3% |
| Swedish | 7 | 0.2% |
| Welsh | 21 | 0.6% | View All 46 Rows |
Immigrants in Elgin
The most numerous immigrant groups reported in Elgin came from Europe (82 | 2.3%), Germany (66 | 1.9%), Western Europe (66 | 1.9%), Asia (26 | 0.7%), and Philippines (26 | 0.7%), together accounting for 7.6% of all Elgin residents.

| Immigration Origin | # Population | % Population |
| Africa | 13 | 0.4% |
| Asia | 26 | 0.7% |
| Central America | 4 | 0.1% |
| Eastern Europe | 16 | 0.5% |
| Egypt | 13 | 0.4% |
| Europe | 82 | 2.3% |
| Germany | 66 | 1.9% |
| Guatemala | 4 | 0.1% |
| Latin America | 4 | 0.1% |
| Northern Africa | 13 | 0.4% |
| Philippines | 26 | 0.7% |
| Romania | 16 | 0.5% |
| South Eastern Asia | 26 | 0.7% |
| Western Europe | 66 | 1.9% | View All 14 Rows |
Sex and Age in Elgin
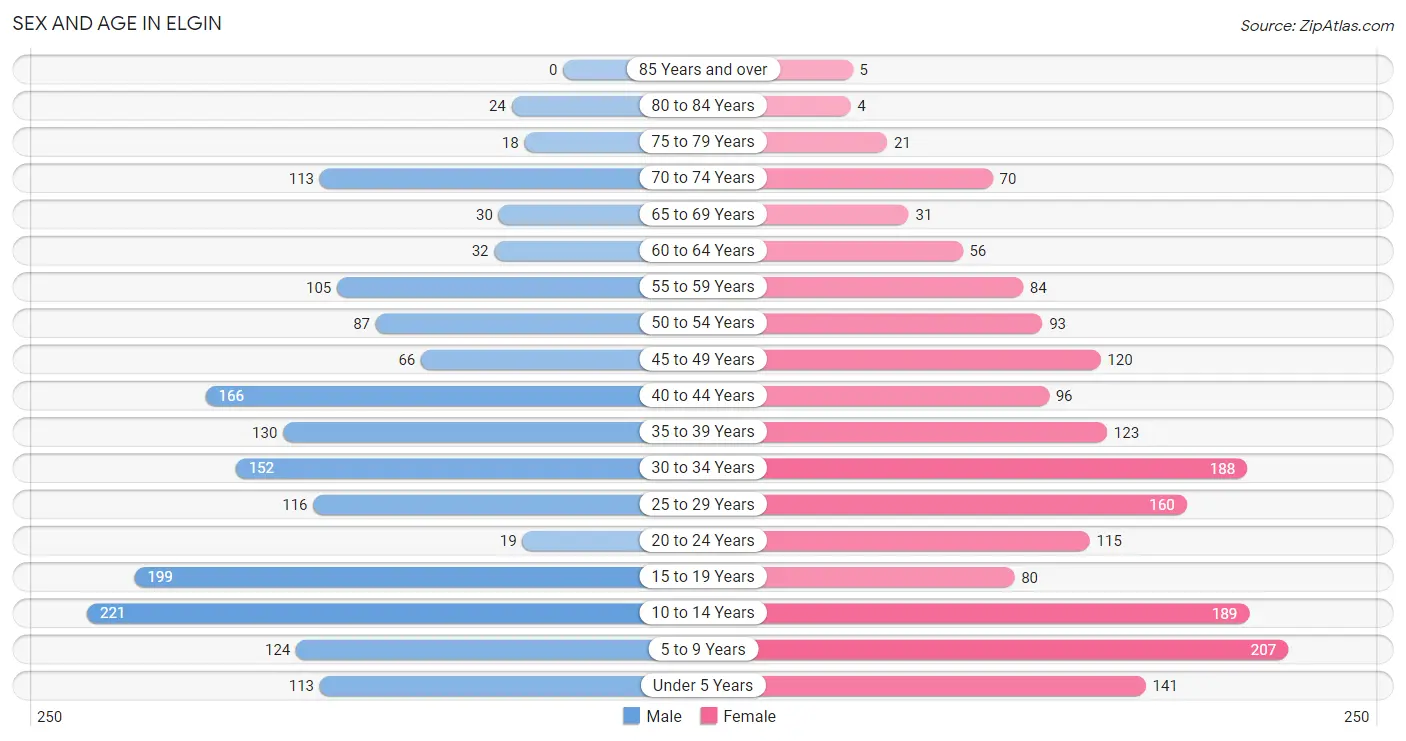
Sex and Age in Elgin
The most populous age groups in Elgin are 10 to 14 Years (221 | 12.9%) for men and 5 to 9 Years (207 | 11.6%) for women.
| Age Bracket | Male | Female |
| Under 5 Years | 113 (6.6%) | 141 (7.9%) |
| 5 to 9 Years | 124 (7.2%) | 207 (11.6%) |
| 10 to 14 Years | 221 (12.9%) | 189 (10.6%) |
| 15 to 19 Years | 199 (11.6%) | 80 (4.5%) |
| 20 to 24 Years | 19 (1.1%) | 115 (6.5%) |
| 25 to 29 Years | 116 (6.8%) | 160 (9.0%) |
| 30 to 34 Years | 152 (8.9%) | 188 (10.5%) |
| 35 to 39 Years | 130 (7.6%) | 123 (6.9%) |
| 40 to 44 Years | 166 (9.7%) | 96 (5.4%) |
| 45 to 49 Years | 66 (3.8%) | 120 (6.7%) |
| 50 to 54 Years | 87 (5.1%) | 93 (5.2%) |
| 55 to 59 Years | 105 (6.1%) | 84 (4.7%) |
| 60 to 64 Years | 32 (1.9%) | 56 (3.1%) |
| 65 to 69 Years | 30 (1.8%) | 31 (1.7%) |
| 70 to 74 Years | 113 (6.6%) | 70 (3.9%) |
| 75 to 79 Years | 18 (1.1%) | 21 (1.2%) |
| 80 to 84 Years | 24 (1.4%) | 4 (0.2%) |
| 85 Years and over | 0 (0.0%) | 5 (0.3%) |
| Total | 1,715 (100.0%) | 1,783 (100.0%) |
Families and Households in Elgin
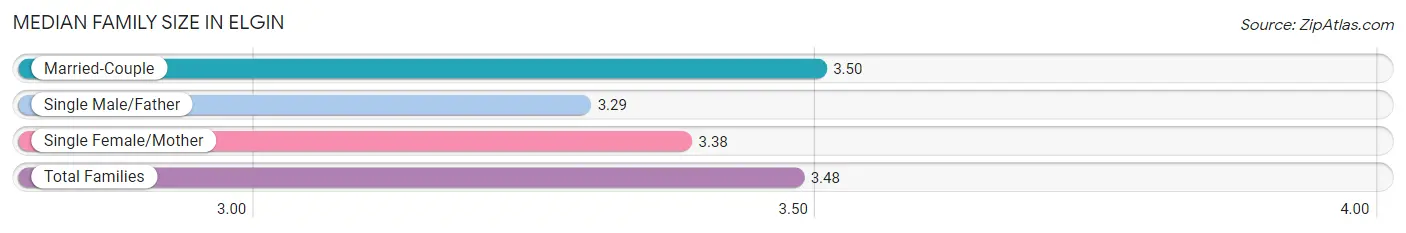
Median Family Size in Elgin
The median family size in Elgin is 3.48 persons per family, with married-couple families (741 | 83.8%) accounting for the largest median family size of 3.5 persons per family. On the other hand, single male/father families (48 | 5.4%) represent the smallest median family size with 3.29 persons per family.
| Family Type | # Families | Family Size |
| Married-Couple | 741 (83.8%) | 3.50 |
| Single Male/Father | 48 (5.4%) | 3.29 |
| Single Female/Mother | 95 (10.7%) | 3.38 |
| Total Families | 884 (100.0%) | 3.48 |
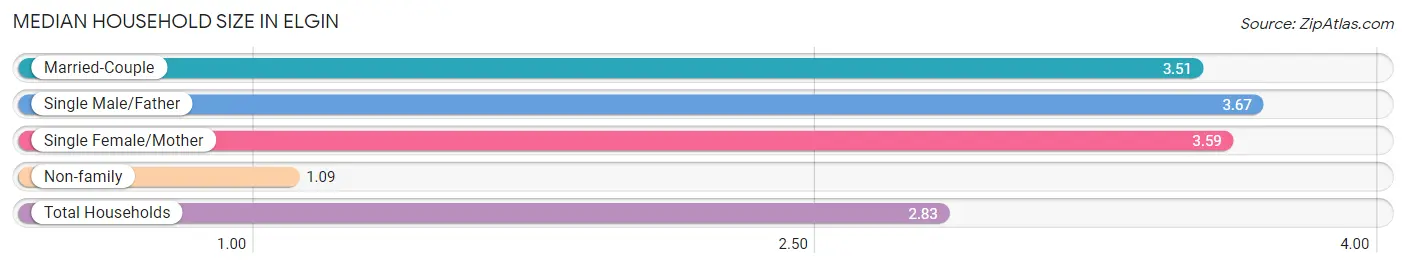
Median Household Size in Elgin
The median household size in Elgin is 2.83 persons per household, with single male/father households (48 | 3.9%) accounting for the largest median household size of 3.67 persons per household. non-family households (351 | 28.4%) represent the smallest median household size with 1.09 persons per household.
| Household Type | # Households | Household Size |
| Married-Couple | 741 (60.0%) | 3.51 |
| Single Male/Father | 48 (3.9%) | 3.67 |
| Single Female/Mother | 95 (7.7%) | 3.59 |
| Non-family | 351 (28.4%) | 1.09 |
| Total Households | 1,235 (100.0%) | 2.83 |
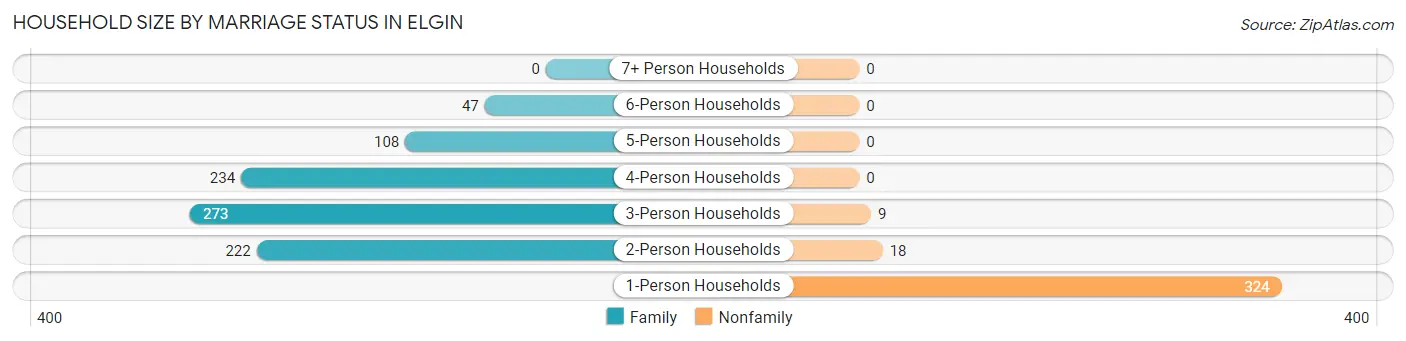
Household Size by Marriage Status in Elgin
Out of a total of 1,235 households in Elgin, 884 (71.6%) are family households, while 351 (28.4%) are nonfamily households. The most numerous type of family households are 3-person households, comprising 273, and the most common type of nonfamily households are 1-person households, comprising 324.
| Household Size | Family Households | Nonfamily Households |
| 1-Person Households | - | 324 (26.2%) |
| 2-Person Households | 222 (18.0%) | 18 (1.5%) |
| 3-Person Households | 273 (22.1%) | 9 (0.7%) |
| 4-Person Households | 234 (19.0%) | 0 (0.0%) |
| 5-Person Households | 108 (8.7%) | 0 (0.0%) |
| 6-Person Households | 47 (3.8%) | 0 (0.0%) |
| 7+ Person Households | 0 (0.0%) | 0 (0.0%) |
| Total | 884 (71.6%) | 351 (28.4%) |
Female Fertility in Elgin
Fertility by Age in Elgin
Average fertility rate in Elgin is 49.0 births per 1,000 women. Women in the age bracket of 35 to 50 years have the highest fertility rate with 104.0 births per 1,000 women. Women in the age bracket of 35 to 50 years acount for 88.9% of all women with births.
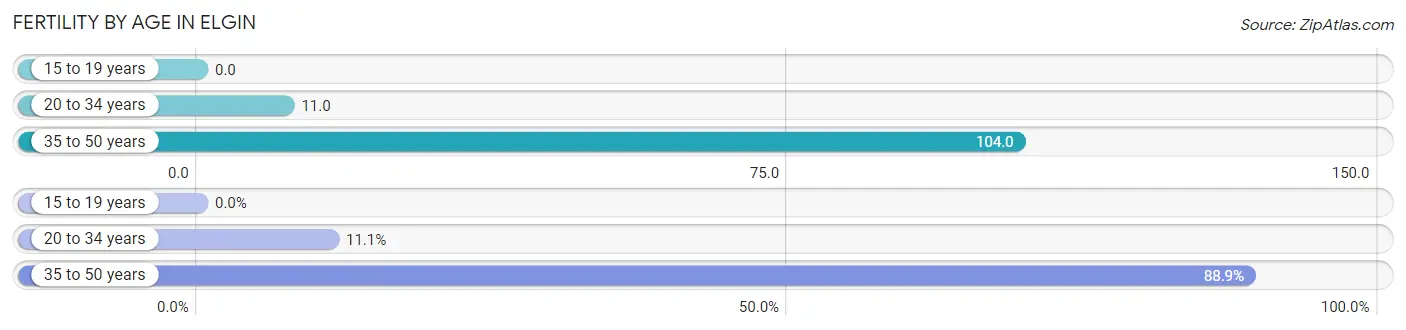
| Age Bracket | Women with Births | Births / 1,000 Women |
| 15 to 19 years | 0 (0.0%) | 0.0 |
| 20 to 34 years | 5 (11.1%) | 11.0 |
| 35 to 50 years | 40 (88.9%) | 104.0 |
| Total | 45 (100.0%) | 49.0 |
Fertility by Age by Marriage Status in Elgin
95.6% of women with births (45) in Elgin are married. The highest percentage of unmarried women with births falls into 20 to 34 years age bracket with 40.0% of them unmarried at the time of birth, while the lowest percentage of unmarried women with births belong to 35 to 50 years age bracket with 0.0% of them unmarried.

| Age Bracket | Married | Unmarried |
| 15 to 19 years | 0 (0.0%) | 0 (0.0%) |
| 20 to 34 years | 3 (60.0%) | 2 (40.0%) |
| 35 to 50 years | 40 (100.0%) | 0 (0.0%) |
| Total | 43 (95.6%) | 2 (4.4%) |
Fertility by Education in Elgin
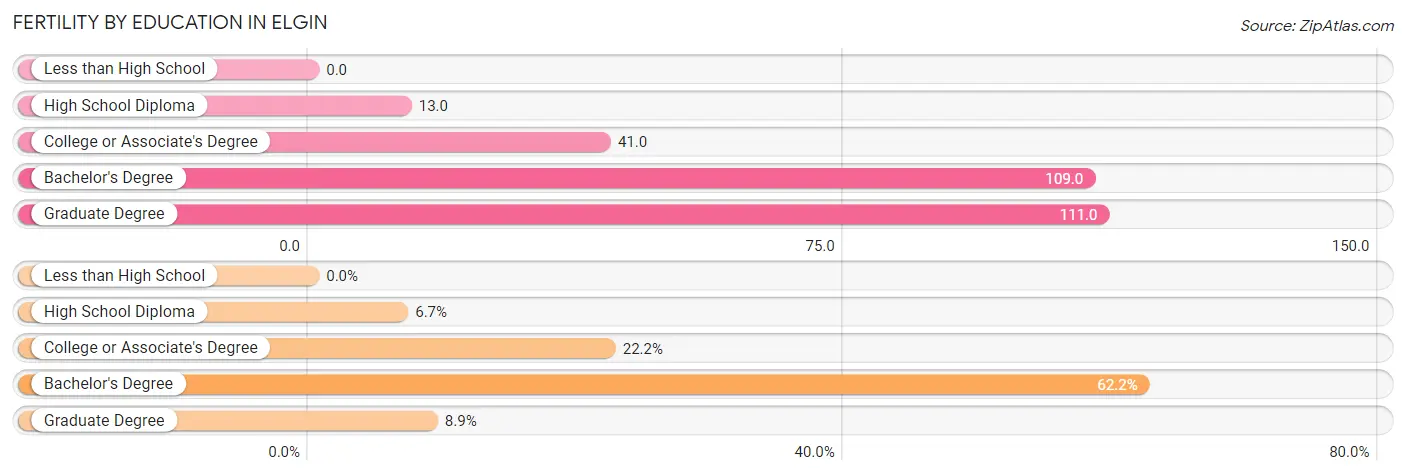
| Educational Attainment | Women with Births | Births / 1,000 Women |
| Less than High School | 0 (0.0%) | 0.0 |
| High School Diploma | 3 (6.7%) | 13.0 |
| College or Associate's Degree | 10 (22.2%) | 41.0 |
| Bachelor's Degree | 28 (62.2%) | 109.0 |
| Graduate Degree | 4 (8.9%) | 111.0 |
| Total | 45 (100.0%) | 49.0 |
Fertility by Education by Marriage Status in Elgin
4.4% of women with births in Elgin are unmarried. Women with the educational attainment of high school diploma are most likely to be married with 100.0% of them married at childbirth, while women with the educational attainment of college or associate's degree are least likely to be married with 20.0% of them unmarried at childbirth.
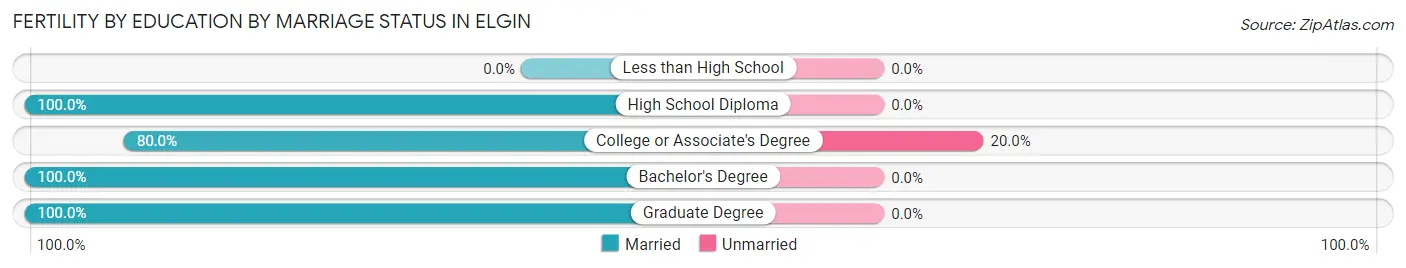
| Educational Attainment | Married | Unmarried |
| Less than High School | 0 (0.0%) | 0 (0.0%) |
| High School Diploma | 3 (100.0%) | 0 (0.0%) |
| College or Associate's Degree | 8 (80.0%) | 2 (20.0%) |
| Bachelor's Degree | 28 (100.0%) | 0 (0.0%) |
| Graduate Degree | 4 (100.0%) | 0 (0.0%) |
| Total | 43 (95.6%) | 2 (4.4%) |
Employment Characteristics in Elgin
Employment by Class of Employer in Elgin
Among the 1,446 employed individuals in Elgin, private company employees (597 | 41.3%), federal government employees (413 | 28.6%), and local government employees (148 | 10.2%) make up the most common classes of employment.
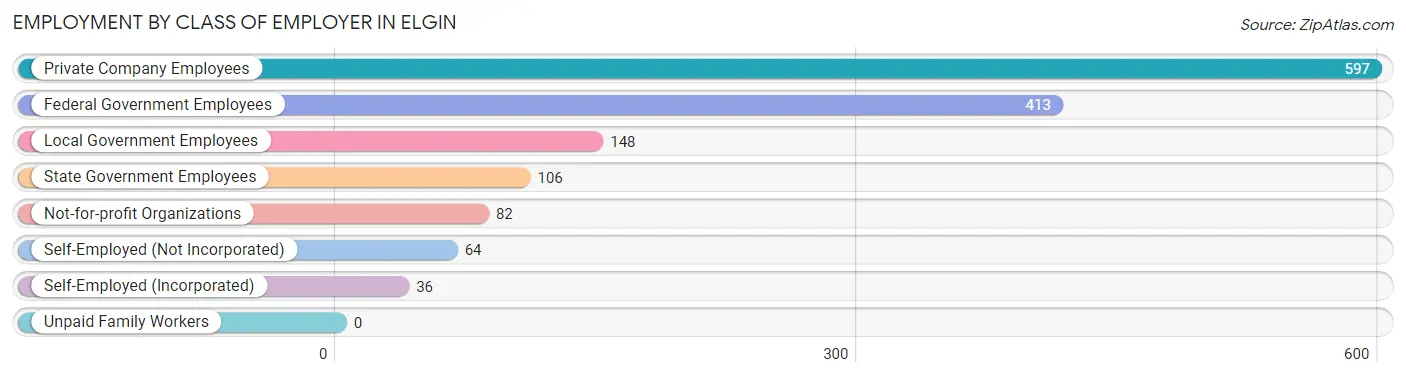
| Employer Class | # Employees | % Employees |
| Private Company Employees | 597 | 41.3% |
| Self-Employed (Incorporated) | 36 | 2.5% |
| Self-Employed (Not Incorporated) | 64 | 4.4% |
| Not-for-profit Organizations | 82 | 5.7% |
| Local Government Employees | 148 | 10.2% |
| State Government Employees | 106 | 7.3% |
| Federal Government Employees | 413 | 28.6% |
| Unpaid Family Workers | 0 | 0.0% |
| Total | 1,446 | 100.0% |
Employment Status by Age in Elgin
According to the labor force statistics for Elgin, out of the total population over 16 years of age (2,399), 66.6% or 1,598 individuals are in the labor force, with 4.2% or 67 of them unemployed. The age group with the highest labor force participation rate is 35 to 44 years, with 89.7% or 462 individuals in the labor force. Within the labor force, the 16 to 19 years age range has the highest percentage of unemployed individuals, with 35.3% or 36 of them being unemployed.
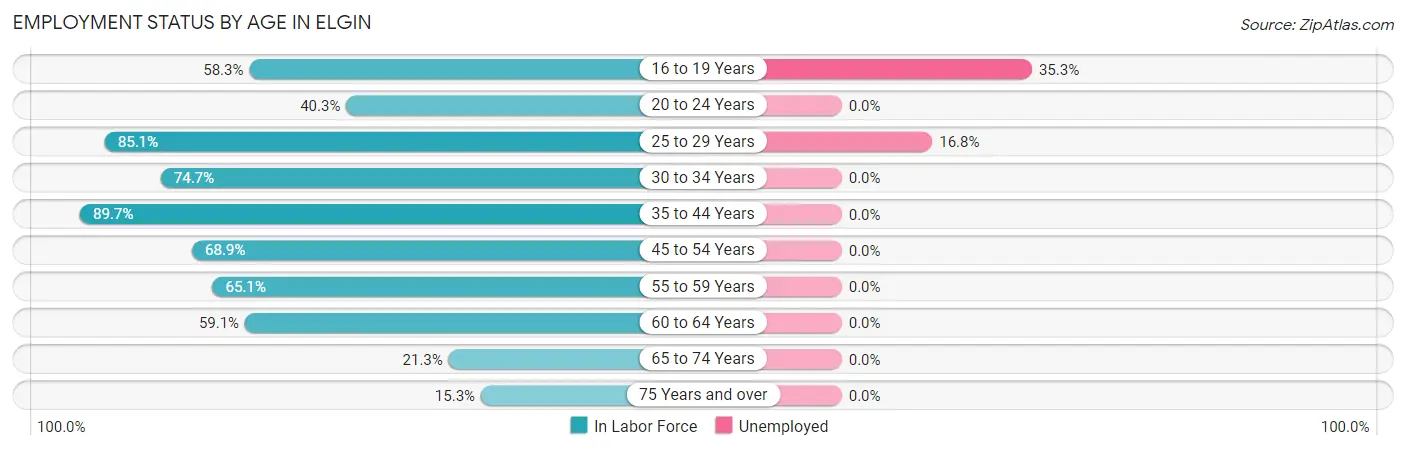
| Age Bracket | In Labor Force | Unemployed |
| 16 to 19 Years | 102 (58.3%) | 36 (35.3%) |
| 20 to 24 Years | 54 (40.3%) | 0 (0.0%) |
| 25 to 29 Years | 235 (85.1%) | 39 (16.8%) |
| 30 to 34 Years | 254 (74.7%) | 0 (0.0%) |
| 35 to 44 Years | 462 (89.7%) | 0 (0.0%) |
| 45 to 54 Years | 252 (68.9%) | 0 (0.0%) |
| 55 to 59 Years | 123 (65.1%) | 0 (0.0%) |
| 60 to 64 Years | 52 (59.1%) | 0 (0.0%) |
| 65 to 74 Years | 52 (21.3%) | 0 (0.0%) |
| 75 Years and over | 11 (15.3%) | 0 (0.0%) |
| Total | 1,598 (66.6%) | 67 (4.2%) |
Employment Status by Educational Attainment in Elgin
According to labor force statistics for Elgin, 77.7% of individuals (1,378) out of the total population between 25 and 64 years of age (1,774) are in the labor force, with 1.8% or 25 of them being unemployed. The group with the highest labor force participation rate are those with the educational attainment of bachelor's degree or higher, with 85.1% or 561 individuals in the labor force. Within the labor force, individuals with less than high school education have the highest percentage of unemployment, with 8.9% or 4 of them being unemployed.
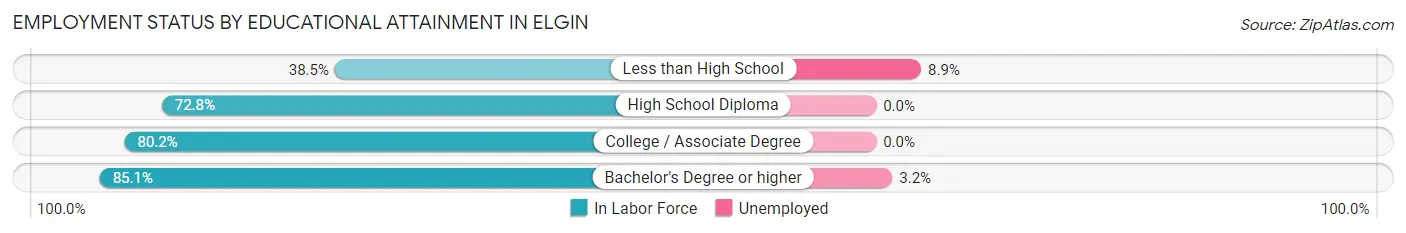
| Educational Attainment | In Labor Force | Unemployed |
| Less than High School | 45 (38.5%) | 10 (8.9%) |
| High School Diploma | 281 (72.8%) | 0 (0.0%) |
| College / Associate Degree | 491 (80.2%) | 0 (0.0%) |
| Bachelor's Degree or higher | 561 (85.1%) | 21 (3.2%) |
| Total | 1,378 (77.7%) | 32 (1.8%) |
Employment Occupations by Sex in Elgin
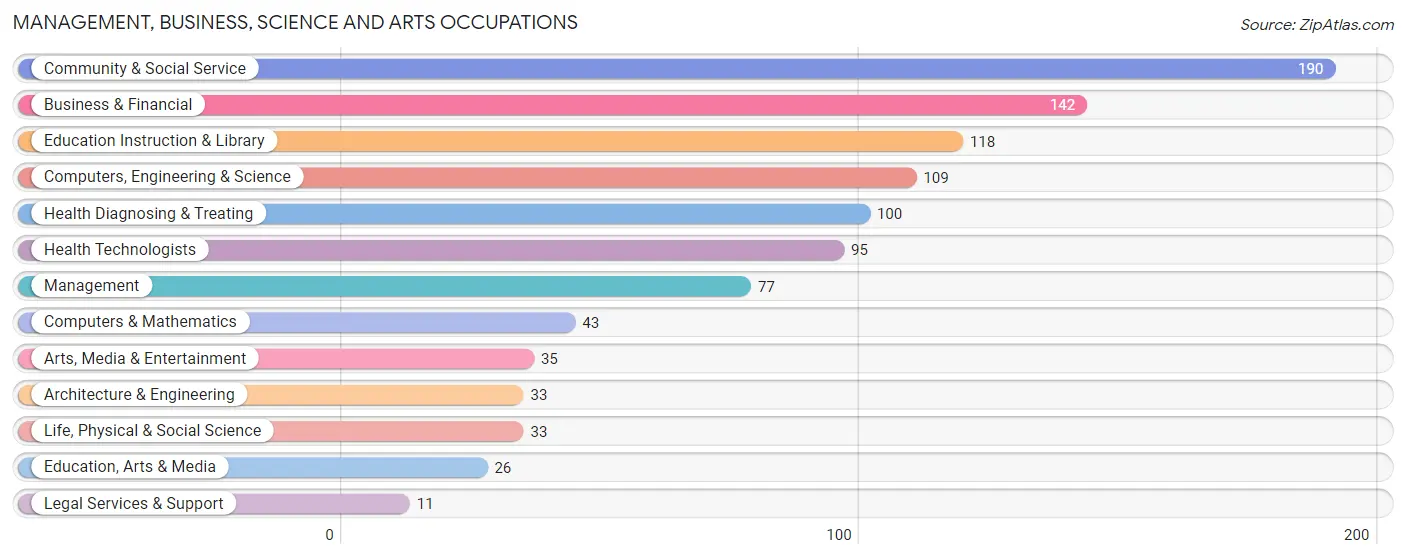
Management, Business, Science and Arts Occupations
The most common Management, Business, Science and Arts occupations in Elgin are Community & Social Service (190 | 15.3%), Business & Financial (142 | 11.4%), Education Instruction & Library (118 | 9.5%), Computers, Engineering & Science (109 | 8.8%), and Health Diagnosing & Treating (100 | 8.1%).
Management, Business, Science and Arts Occupations by Sex
Within the Management, Business, Science and Arts occupations in Elgin, the most male-oriented occupations are Computers & Mathematics (100.0%), Architecture & Engineering (100.0%), and Legal Services & Support (100.0%), while the most female-oriented occupations are Life, Physical & Social Science (100.0%), Health Diagnosing & Treating (91.0%), and Health Technologists (90.5%).
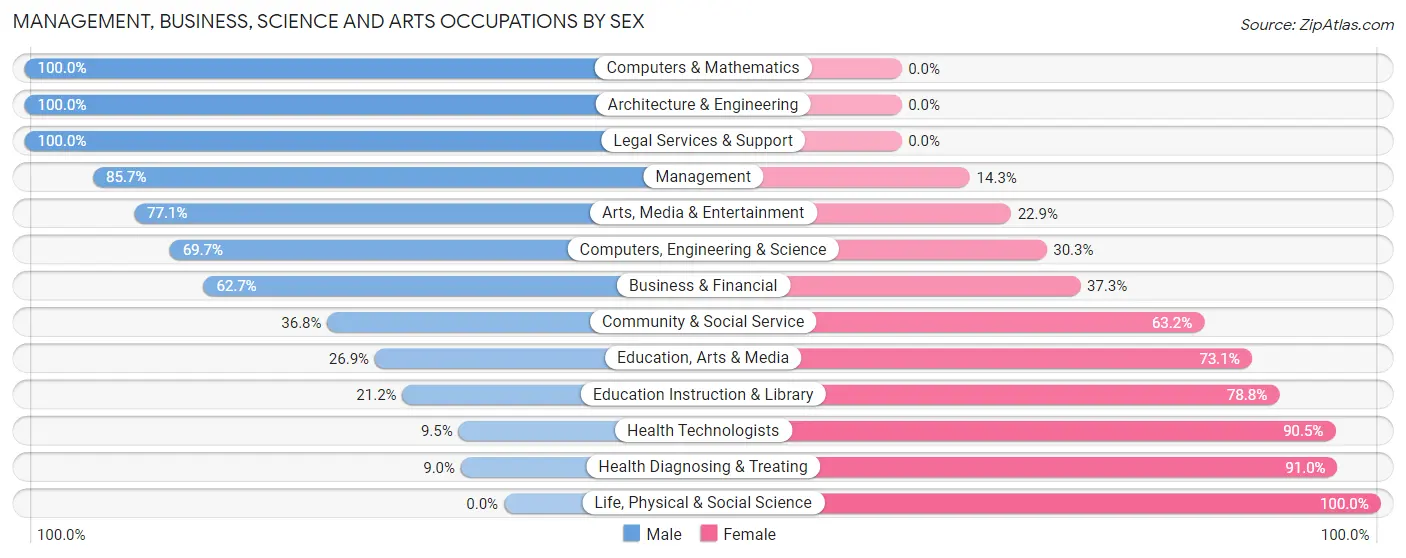
| Occupation | Male | Female |
| Management | 66 (85.7%) | 11 (14.3%) |
| Business & Financial | 89 (62.7%) | 53 (37.3%) |
| Computers, Engineering & Science | 76 (69.7%) | 33 (30.3%) |
| Computers & Mathematics | 43 (100.0%) | 0 (0.0%) |
| Architecture & Engineering | 33 (100.0%) | 0 (0.0%) |
| Life, Physical & Social Science | 0 (0.0%) | 33 (100.0%) |
| Community & Social Service | 70 (36.8%) | 120 (63.2%) |
| Education, Arts & Media | 7 (26.9%) | 19 (73.1%) |
| Legal Services & Support | 11 (100.0%) | 0 (0.0%) |
| Education Instruction & Library | 25 (21.2%) | 93 (78.8%) |
| Arts, Media & Entertainment | 27 (77.1%) | 8 (22.9%) |
| Health Diagnosing & Treating | 9 (9.0%) | 91 (91.0%) |
| Health Technologists | 9 (9.5%) | 86 (90.5%) |
| Total (Category) | 310 (50.2%) | 308 (49.8%) |
| Total (Overall) | 624 (50.2%) | 618 (49.8%) |
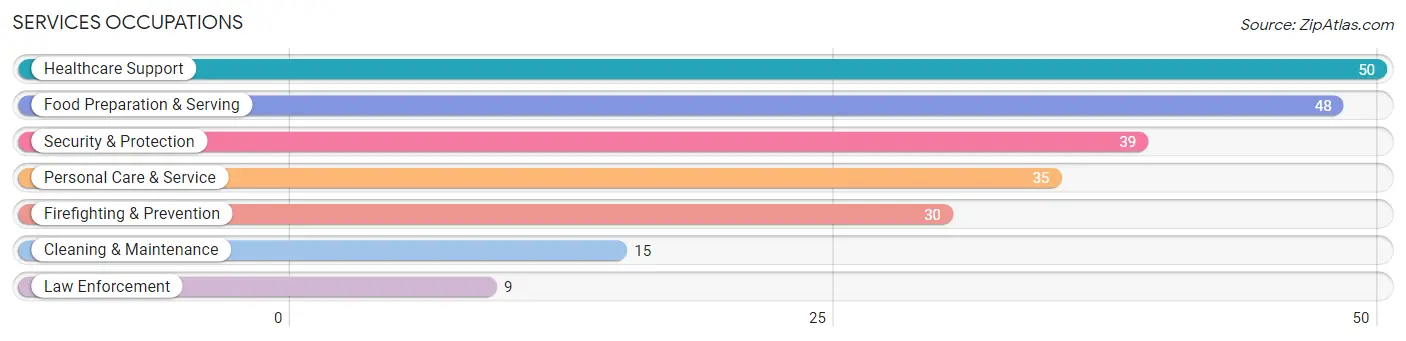
Services Occupations
The most common Services occupations in Elgin are Healthcare Support (50 | 4.0%), Food Preparation & Serving (48 | 3.9%), Security & Protection (39 | 3.1%), Personal Care & Service (35 | 2.8%), and Firefighting & Prevention (30 | 2.4%).
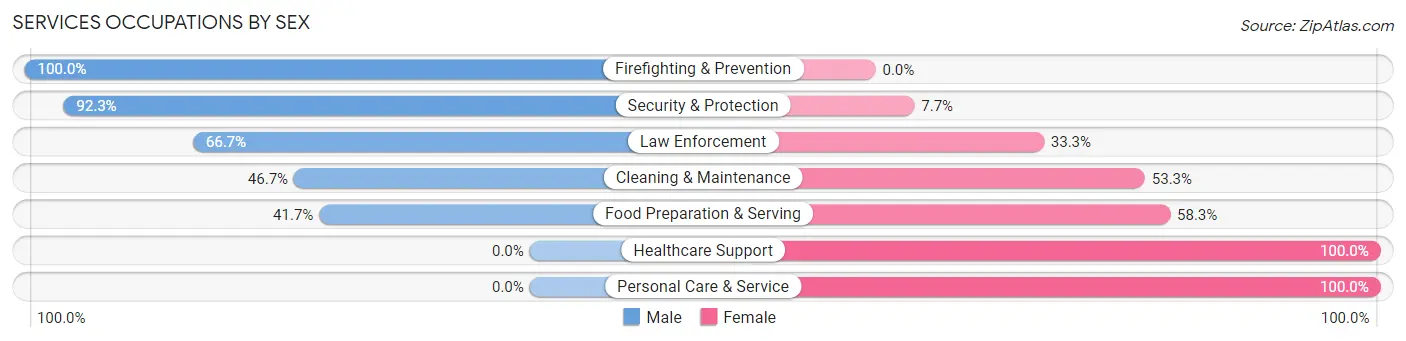
Services Occupations by Sex
Within the Services occupations in Elgin, the most male-oriented occupations are Firefighting & Prevention (100.0%), Security & Protection (92.3%), and Law Enforcement (66.7%), while the most female-oriented occupations are Healthcare Support (100.0%), Personal Care & Service (100.0%), and Food Preparation & Serving (58.3%).
| Occupation | Male | Female |
| Healthcare Support | 0 (0.0%) | 50 (100.0%) |
| Security & Protection | 36 (92.3%) | 3 (7.7%) |
| Firefighting & Prevention | 30 (100.0%) | 0 (0.0%) |
| Law Enforcement | 6 (66.7%) | 3 (33.3%) |
| Food Preparation & Serving | 20 (41.7%) | 28 (58.3%) |
| Cleaning & Maintenance | 7 (46.7%) | 8 (53.3%) |
| Personal Care & Service | 0 (0.0%) | 35 (100.0%) |
| Total (Category) | 63 (33.7%) | 124 (66.3%) |
| Total (Overall) | 624 (50.2%) | 618 (49.8%) |
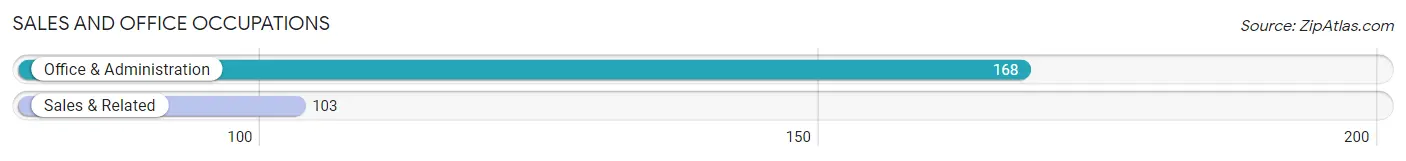
Sales and Office Occupations
The most common Sales and Office occupations in Elgin are Office & Administration (168 | 13.5%), and Sales & Related (103 | 8.3%).
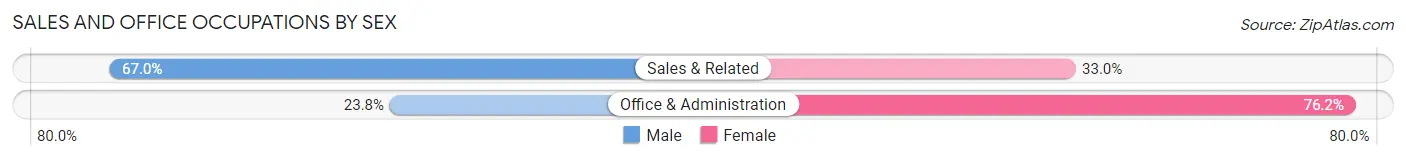
Sales and Office Occupations by Sex
| Occupation | Male | Female |
| Sales & Related | 69 (67.0%) | 34 (33.0%) |
| Office & Administration | 40 (23.8%) | 128 (76.2%) |
| Total (Category) | 109 (40.2%) | 162 (59.8%) |
| Total (Overall) | 624 (50.2%) | 618 (49.8%) |
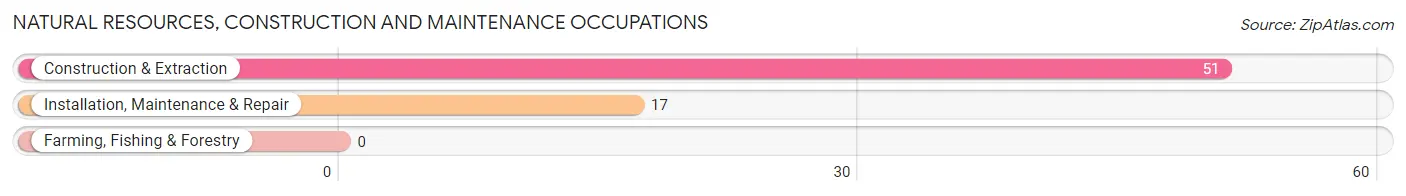
Natural Resources, Construction and Maintenance Occupations
The most common Natural Resources, Construction and Maintenance occupations in Elgin are Construction & Extraction (51 | 4.1%), and Installation, Maintenance & Repair (17 | 1.4%).
Natural Resources, Construction and Maintenance Occupations by Sex
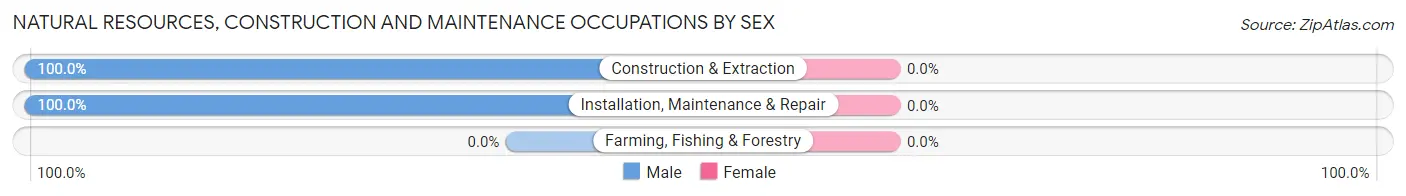
| Occupation | Male | Female |
| Farming, Fishing & Forestry | 0 (0.0%) | 0 (0.0%) |
| Construction & Extraction | 51 (100.0%) | 0 (0.0%) |
| Installation, Maintenance & Repair | 17 (100.0%) | 0 (0.0%) |
| Total (Category) | 68 (100.0%) | 0 (0.0%) |
| Total (Overall) | 624 (50.2%) | 618 (49.8%) |
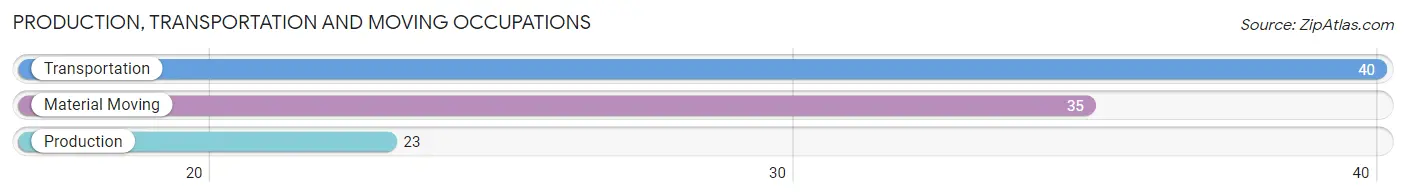
Production, Transportation and Moving Occupations
The most common Production, Transportation and Moving occupations in Elgin are Transportation (40 | 3.2%), Material Moving (35 | 2.8%), and Production (23 | 1.8%).
Production, Transportation and Moving Occupations by Sex
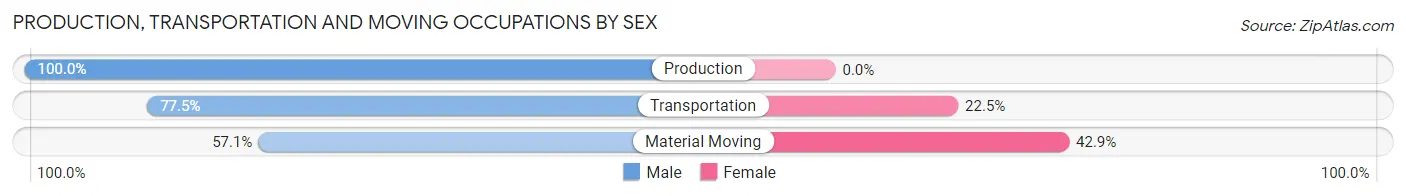
| Occupation | Male | Female |
| Production | 23 (100.0%) | 0 (0.0%) |
| Transportation | 31 (77.5%) | 9 (22.5%) |
| Material Moving | 20 (57.1%) | 15 (42.9%) |
| Total (Category) | 74 (75.5%) | 24 (24.5%) |
| Total (Overall) | 624 (50.2%) | 618 (49.8%) |
Employment Industries by Sex in Elgin
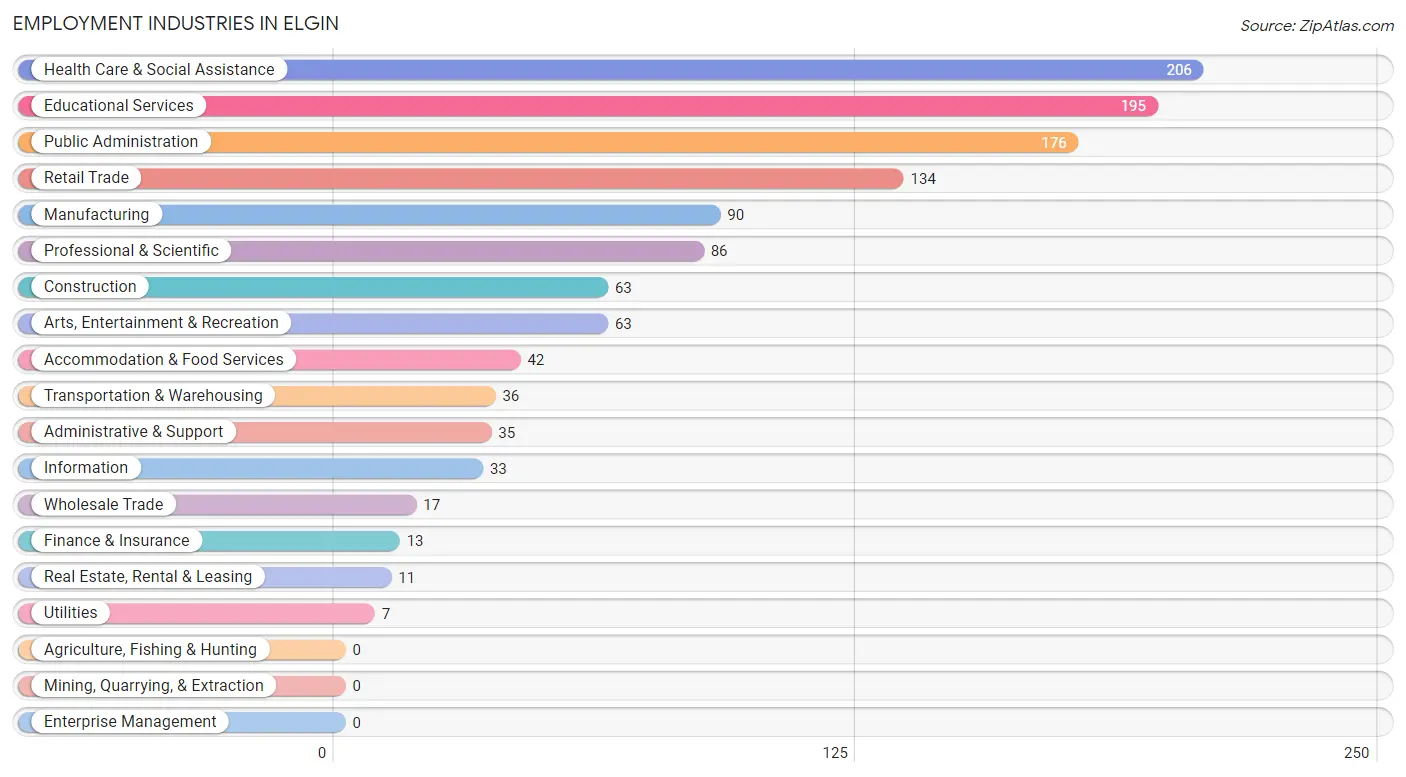
Employment Industries in Elgin
The major employment industries in Elgin include Health Care & Social Assistance (206 | 16.6%), Educational Services (195 | 15.7%), Public Administration (176 | 14.2%), Retail Trade (134 | 10.8%), and Manufacturing (90 | 7.2%).
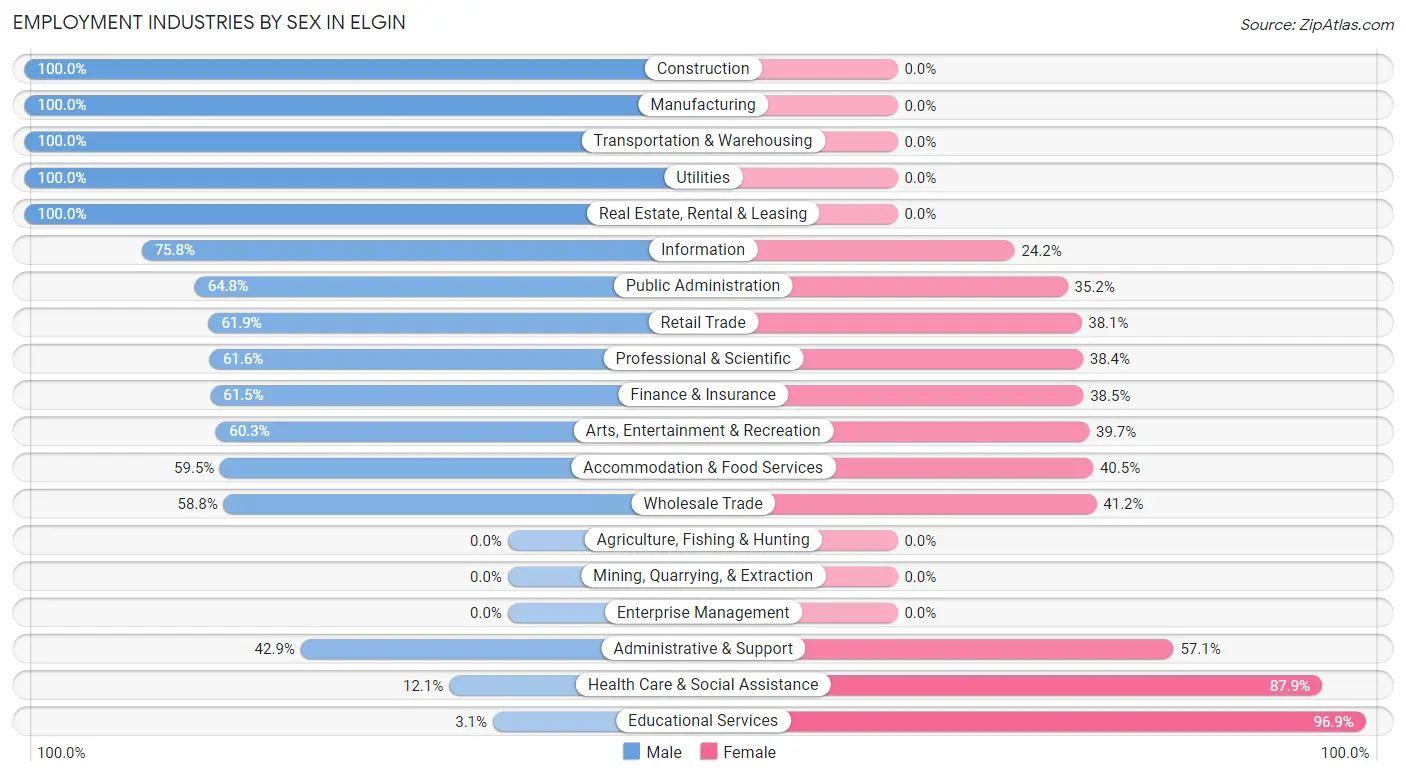
Employment Industries by Sex in Elgin
The Elgin industries that see more men than women are Construction (100.0%), Manufacturing (100.0%), and Transportation & Warehousing (100.0%), whereas the industries that tend to have a higher number of women are Educational Services (96.9%), Health Care & Social Assistance (87.9%), and Administrative & Support (57.1%).
| Industry | Male | Female |
| Agriculture, Fishing & Hunting | 0 (0.0%) | 0 (0.0%) |
| Mining, Quarrying, & Extraction | 0 (0.0%) | 0 (0.0%) |
| Construction | 63 (100.0%) | 0 (0.0%) |
| Manufacturing | 90 (100.0%) | 0 (0.0%) |
| Wholesale Trade | 10 (58.8%) | 7 (41.2%) |
| Retail Trade | 83 (61.9%) | 51 (38.1%) |
| Transportation & Warehousing | 36 (100.0%) | 0 (0.0%) |
| Utilities | 7 (100.0%) | 0 (0.0%) |
| Information | 25 (75.8%) | 8 (24.2%) |
| Finance & Insurance | 8 (61.5%) | 5 (38.5%) |
| Real Estate, Rental & Leasing | 11 (100.0%) | 0 (0.0%) |
| Professional & Scientific | 53 (61.6%) | 33 (38.4%) |
| Enterprise Management | 0 (0.0%) | 0 (0.0%) |
| Administrative & Support | 15 (42.9%) | 20 (57.1%) |
| Educational Services | 6 (3.1%) | 189 (96.9%) |
| Health Care & Social Assistance | 25 (12.1%) | 181 (87.9%) |
| Arts, Entertainment & Recreation | 38 (60.3%) | 25 (39.7%) |
| Accommodation & Food Services | 25 (59.5%) | 17 (40.5%) |
| Public Administration | 114 (64.8%) | 62 (35.2%) |
| Total | 624 (50.2%) | 618 (49.8%) |
Education in Elgin
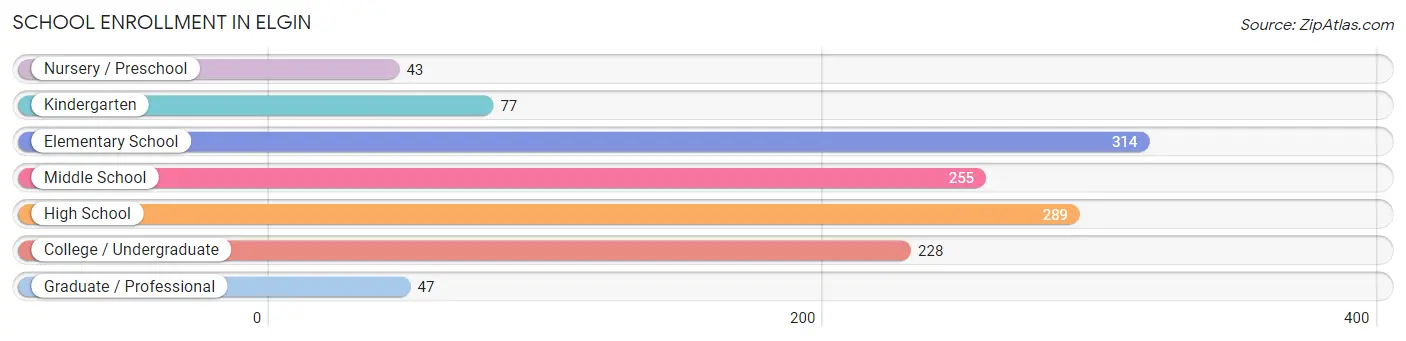
School Enrollment in Elgin
The most common levels of schooling among the 1,253 students in Elgin are elementary school (314 | 25.1%), high school (289 | 23.1%), and middle school (255 | 20.3%).
| School Level | # Students | % Students |
| Nursery / Preschool | 43 | 3.4% |
| Kindergarten | 77 | 6.1% |
| Elementary School | 314 | 25.1% |
| Middle School | 255 | 20.3% |
| High School | 289 | 23.1% |
| College / Undergraduate | 228 | 18.2% |
| Graduate / Professional | 47 | 3.7% |
| Total | 1,253 | 100.0% |
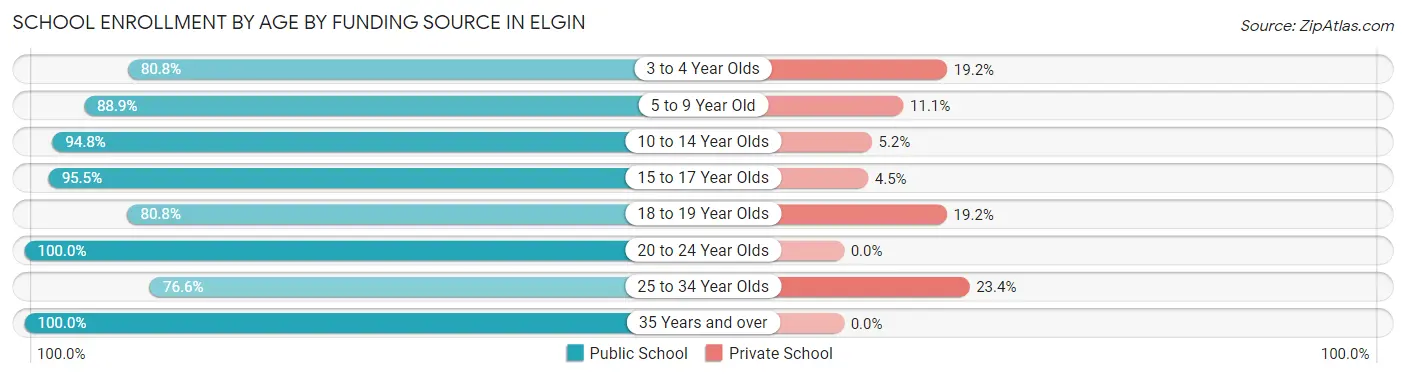
School Enrollment by Age by Funding Source in Elgin
Out of a total of 1,253 students who are enrolled in schools in Elgin, 110 (8.8%) attend a private institution, while the remaining 1,143 (91.2%) are enrolled in public schools. The age group of 25 to 34 year olds has the highest likelihood of being enrolled in private schools, with 29 (23.4% in the age bracket) enrolled. Conversely, the age group of 20 to 24 year olds has the lowest likelihood of being enrolled in a private school, with 73 (100.0% in the age bracket) attending a public institution.
| Age Bracket | Public School | Private School |
| 3 to 4 Year Olds | 21 (80.8%) | 5 (19.2%) |
| 5 to 9 Year Old | 257 (88.9%) | 32 (11.1%) |
| 10 to 14 Year Olds | 384 (94.8%) | 21 (5.2%) |
| 15 to 17 Year Olds | 191 (95.5%) | 9 (4.5%) |
| 18 to 19 Year Olds | 59 (80.8%) | 14 (19.2%) |
| 20 to 24 Year Olds | 73 (100.0%) | 0 (0.0%) |
| 25 to 34 Year Olds | 95 (76.6%) | 29 (23.4%) |
| 35 Years and over | 63 (100.0%) | 0 (0.0%) |
| Total | 1,143 (91.2%) | 110 (8.8%) |
Educational Attainment by Field of Study in Elgin
Business (210 | 26.3%), education (133 | 16.6%), science & technology (106 | 13.3%), arts & humanities (100 | 12.5%), and social sciences (94 | 11.7%) are the most common fields of study among 800 individuals in Elgin who have obtained a bachelor's degree or higher.
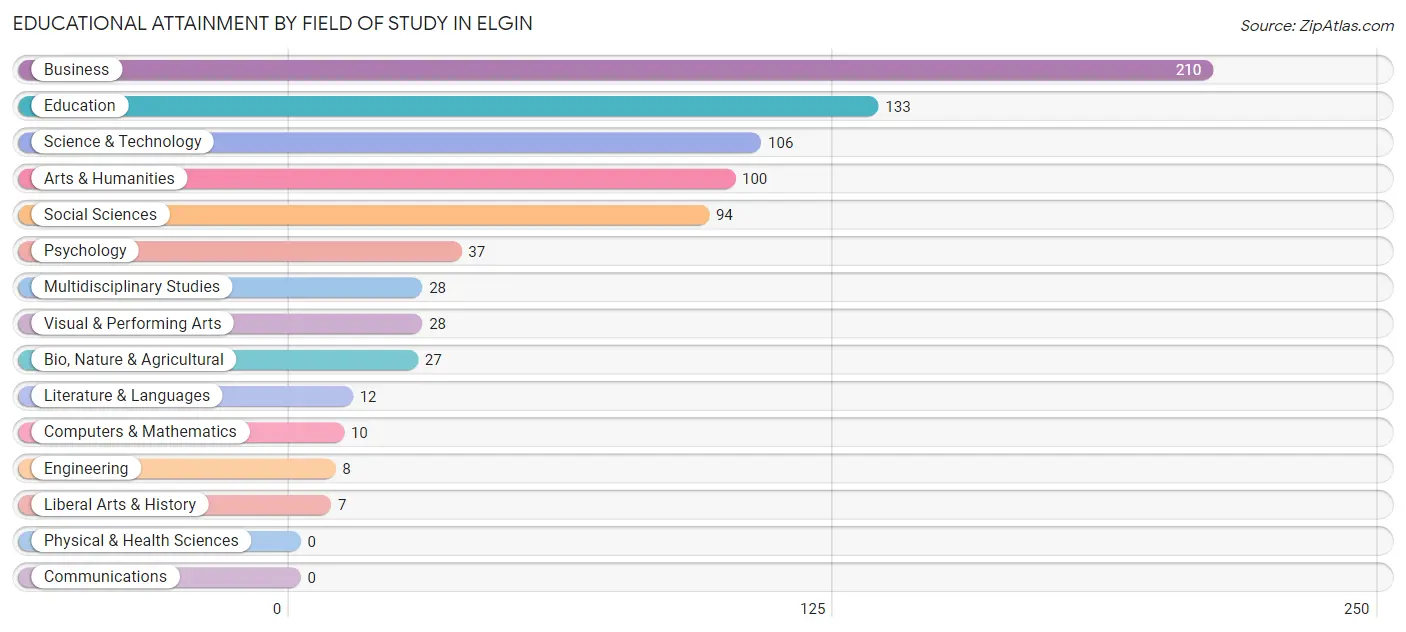
| Field of Study | # Graduates | % Graduates |
| Computers & Mathematics | 10 | 1.3% |
| Bio, Nature & Agricultural | 27 | 3.4% |
| Physical & Health Sciences | 0 | 0.0% |
| Psychology | 37 | 4.6% |
| Social Sciences | 94 | 11.7% |
| Engineering | 8 | 1.0% |
| Multidisciplinary Studies | 28 | 3.5% |
| Science & Technology | 106 | 13.3% |
| Business | 210 | 26.3% |
| Education | 133 | 16.6% |
| Literature & Languages | 12 | 1.5% |
| Liberal Arts & History | 7 | 0.9% |
| Visual & Performing Arts | 28 | 3.5% |
| Communications | 0 | 0.0% |
| Arts & Humanities | 100 | 12.5% |
| Total | 800 | 100.0% |
Transportation & Commute in Elgin
Vehicle Availability by Sex in Elgin
The most prevalent vehicle ownership categories in Elgin are males with 2 vehicles (376, accounting for 45.4%) and females with 2 vehicles (302, making up 60.9%).
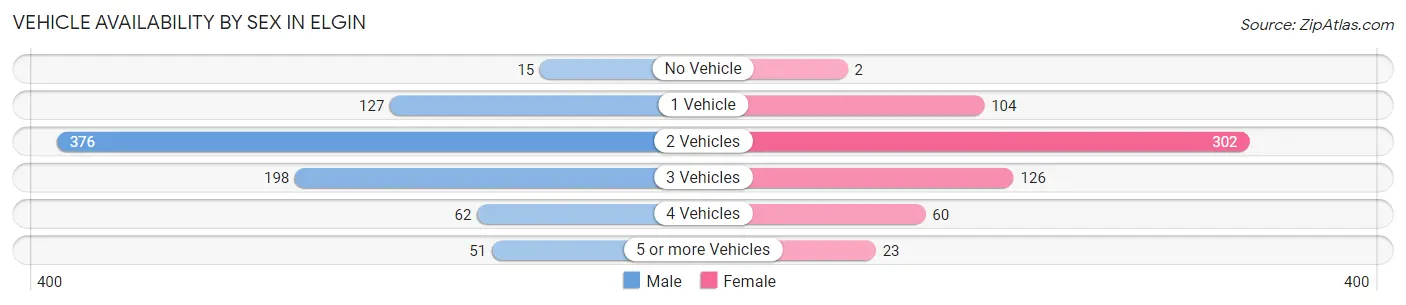
| Vehicles Available | Male | Female |
| No Vehicle | 15 (1.8%) | 2 (0.3%) |
| 1 Vehicle | 127 (15.3%) | 104 (16.9%) |
| 2 Vehicles | 376 (45.4%) | 302 (48.9%) |
| 3 Vehicles | 198 (23.9%) | 126 (20.4%) |
| 4 Vehicles | 62 (7.5%) | 60 (9.7%) |
| 5 or more Vehicles | 51 (6.1%) | 23 (3.7%) |
| Total | 829 (100.0%) | 617 (100.0%) |
Commute Time in Elgin
The most frequently occuring commute durations in Elgin are 20 to 24 minutes (377 commuters, 27.9%), 15 to 19 minutes (222 commuters, 16.4%), and 30 to 34 minutes (207 commuters, 15.3%).
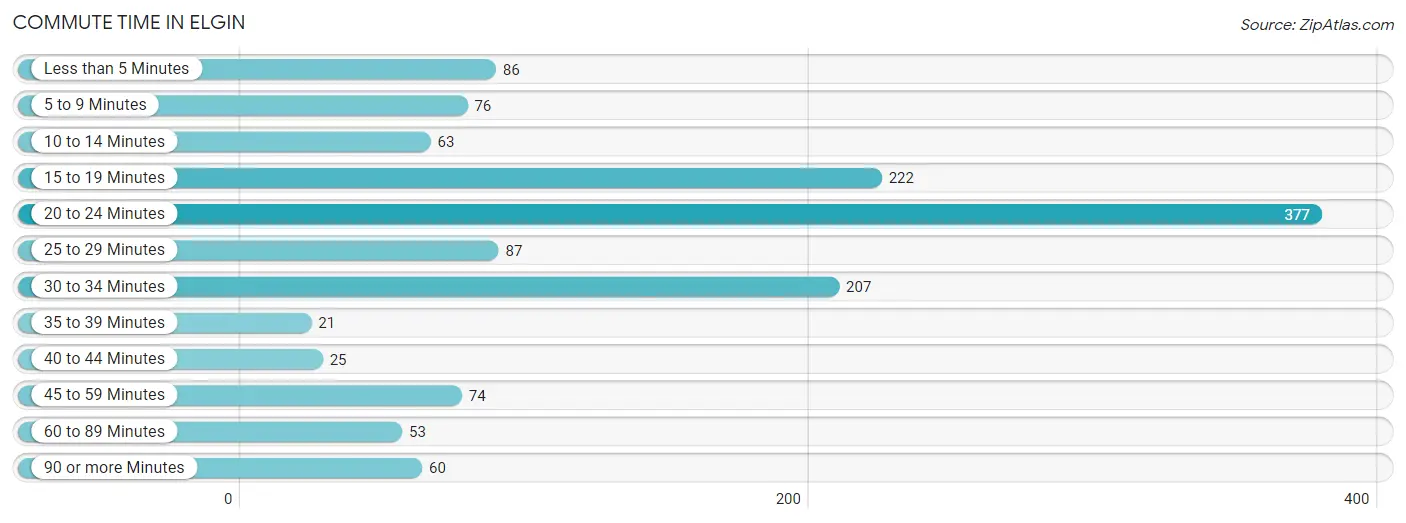
| Commute Time | # Commuters | % Commuters |
| Less than 5 Minutes | 86 | 6.4% |
| 5 to 9 Minutes | 76 | 5.6% |
| 10 to 14 Minutes | 63 | 4.7% |
| 15 to 19 Minutes | 222 | 16.4% |
| 20 to 24 Minutes | 377 | 27.9% |
| 25 to 29 Minutes | 87 | 6.4% |
| 30 to 34 Minutes | 207 | 15.3% |
| 35 to 39 Minutes | 21 | 1.5% |
| 40 to 44 Minutes | 25 | 1.8% |
| 45 to 59 Minutes | 74 | 5.5% |
| 60 to 89 Minutes | 53 | 3.9% |
| 90 or more Minutes | 60 | 4.4% |
Commute Time by Sex in Elgin
The most common commute times in Elgin are 20 to 24 minutes (232 commuters, 29.8%) for males and 20 to 24 minutes (145 commuters, 25.4%) for females.
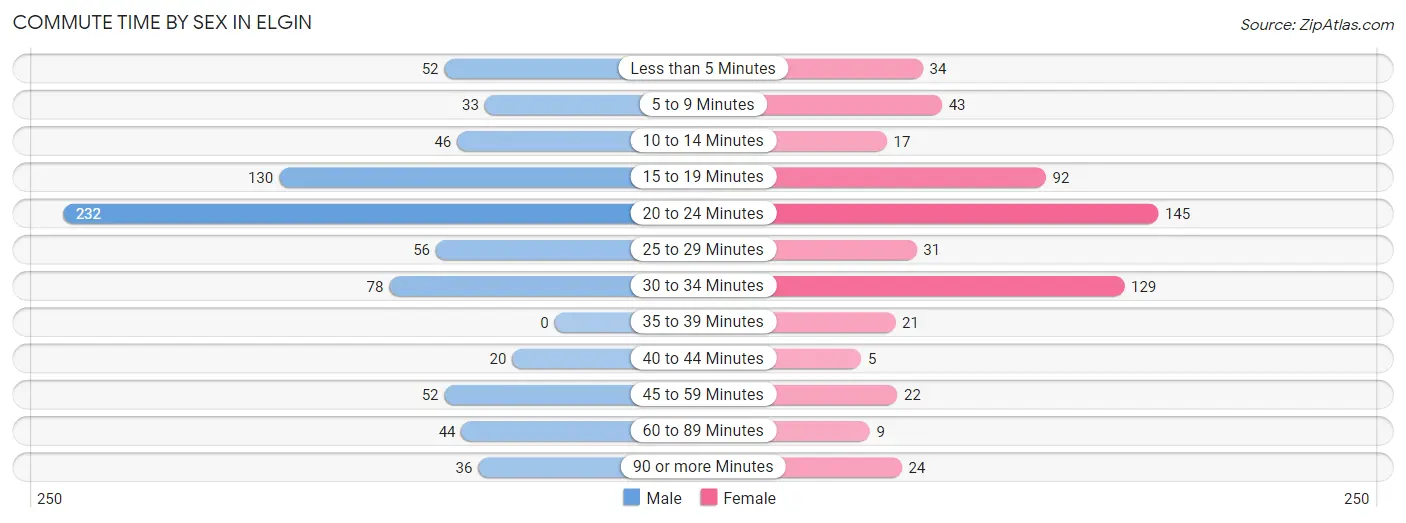
| Commute Time | Male | Female |
| Less than 5 Minutes | 52 (6.7%) | 34 (5.9%) |
| 5 to 9 Minutes | 33 (4.2%) | 43 (7.5%) |
| 10 to 14 Minutes | 46 (5.9%) | 17 (3.0%) |
| 15 to 19 Minutes | 130 (16.7%) | 92 (16.1%) |
| 20 to 24 Minutes | 232 (29.8%) | 145 (25.4%) |
| 25 to 29 Minutes | 56 (7.2%) | 31 (5.4%) |
| 30 to 34 Minutes | 78 (10.0%) | 129 (22.6%) |
| 35 to 39 Minutes | 0 (0.0%) | 21 (3.7%) |
| 40 to 44 Minutes | 20 (2.6%) | 5 (0.9%) |
| 45 to 59 Minutes | 52 (6.7%) | 22 (3.8%) |
| 60 to 89 Minutes | 44 (5.7%) | 9 (1.6%) |
| 90 or more Minutes | 36 (4.6%) | 24 (4.2%) |
Time of Departure to Work by Sex in Elgin
The most frequent times of departure to work in Elgin are 7:00 AM to 7:29 AM (159, 20.4%) for males and 7:00 AM to 7:29 AM (99, 17.3%) for females.
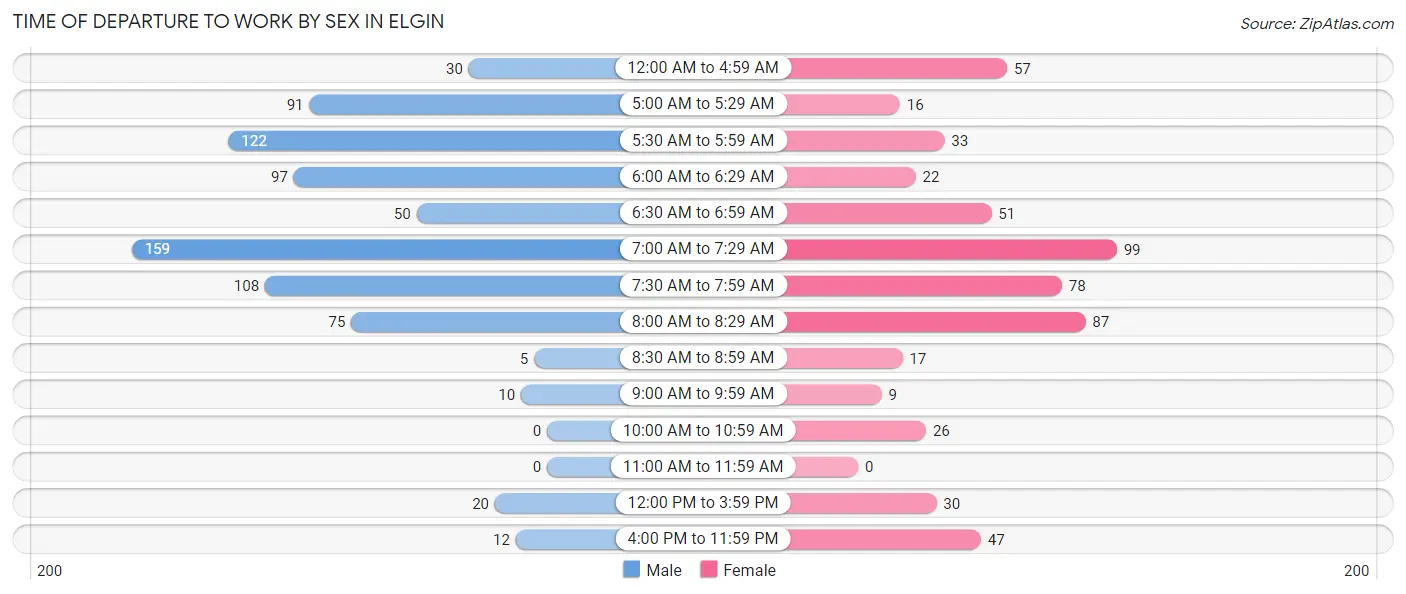
| Time of Departure | Male | Female |
| 12:00 AM to 4:59 AM | 30 (3.8%) | 57 (10.0%) |
| 5:00 AM to 5:29 AM | 91 (11.7%) | 16 (2.8%) |
| 5:30 AM to 5:59 AM | 122 (15.7%) | 33 (5.8%) |
| 6:00 AM to 6:29 AM | 97 (12.4%) | 22 (3.8%) |
| 6:30 AM to 6:59 AM | 50 (6.4%) | 51 (8.9%) |
| 7:00 AM to 7:29 AM | 159 (20.4%) | 99 (17.3%) |
| 7:30 AM to 7:59 AM | 108 (13.9%) | 78 (13.6%) |
| 8:00 AM to 8:29 AM | 75 (9.6%) | 87 (15.2%) |
| 8:30 AM to 8:59 AM | 5 (0.6%) | 17 (3.0%) |
| 9:00 AM to 9:59 AM | 10 (1.3%) | 9 (1.6%) |
| 10:00 AM to 10:59 AM | 0 (0.0%) | 26 (4.5%) |
| 11:00 AM to 11:59 AM | 0 (0.0%) | 0 (0.0%) |
| 12:00 PM to 3:59 PM | 20 (2.6%) | 30 (5.2%) |
| 4:00 PM to 11:59 PM | 12 (1.5%) | 47 (8.2%) |
| Total | 779 (100.0%) | 572 (100.0%) |
Housing Occupancy in Elgin
Occupancy by Ownership in Elgin
Of the total 1,235 dwellings in Elgin, owner-occupied units account for 832 (67.4%), while renter-occupied units make up 403 (32.6%).
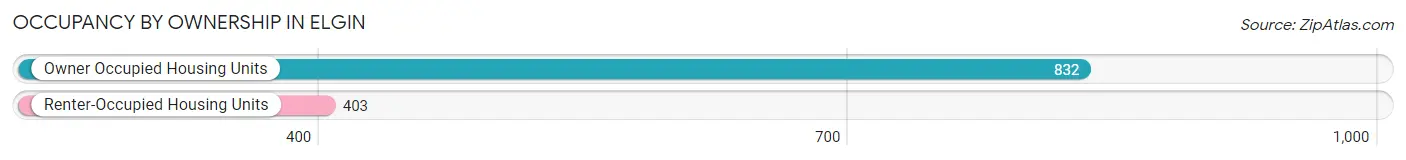
| Occupancy | # Housing Units | % Housing Units |
| Owner Occupied Housing Units | 832 | 67.4% |
| Renter-Occupied Housing Units | 403 | 32.6% |
| Total Occupied Housing Units | 1,235 | 100.0% |
Occupancy by Household Size in Elgin
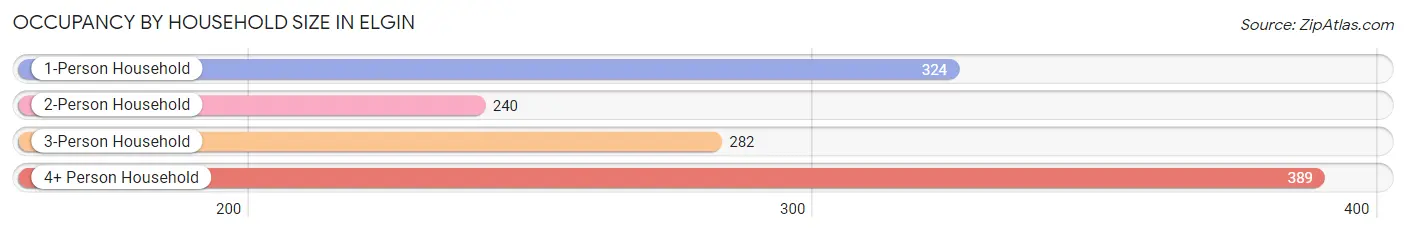
| Household Size | # Housing Units | % Housing Units |
| 1-Person Household | 324 | 26.2% |
| 2-Person Household | 240 | 19.4% |
| 3-Person Household | 282 | 22.8% |
| 4+ Person Household | 389 | 31.5% |
| Total Housing Units | 1,235 | 100.0% |
Occupancy by Ownership by Household Size in Elgin

| Household Size | Owner-occupied | Renter-occupied |
| 1-Person Household | 123 (38.0%) | 201 (62.0%) |
| 2-Person Household | 171 (71.3%) | 69 (28.7%) |
| 3-Person Household | 229 (81.2%) | 53 (18.8%) |
| 4+ Person Household | 309 (79.4%) | 80 (20.6%) |
| Total Housing Units | 832 (67.4%) | 403 (32.6%) |
Occupancy by Educational Attainment in Elgin
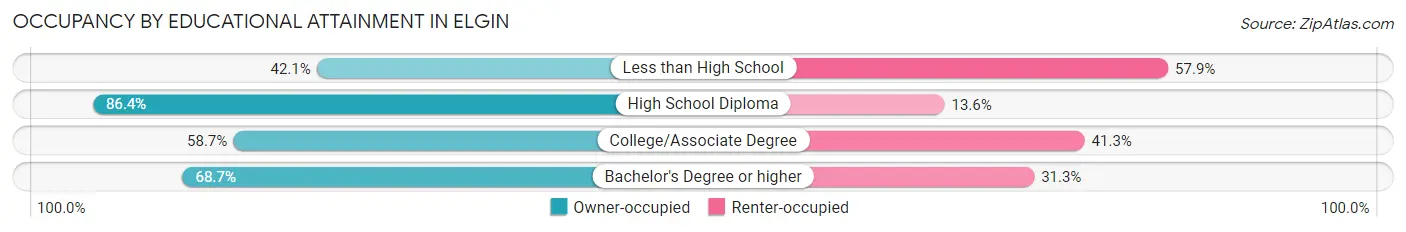
| Household Size | Owner-occupied | Renter-occupied |
| Less than High School | 16 (42.1%) | 22 (57.9%) |
| High School Diploma | 204 (86.4%) | 32 (13.6%) |
| College/Associate Degree | 281 (58.7%) | 198 (41.3%) |
| Bachelor's Degree or higher | 331 (68.7%) | 151 (31.3%) |
Occupancy by Age of Householder in Elgin

| Age Bracket | # Households | % Households |
| Under 35 Years | 363 | 29.4% |
| 35 to 44 Years | 282 | 22.8% |
| 45 to 54 Years | 198 | 16.0% |
| 55 to 64 Years | 166 | 13.4% |
| 65 to 74 Years | 178 | 14.4% |
| 75 to 84 Years | 43 | 3.5% |
| 85 Years and Over | 5 | 0.4% |
| Total | 1,235 | 100.0% |
Housing Finances in Elgin
Median Income by Occupancy in Elgin
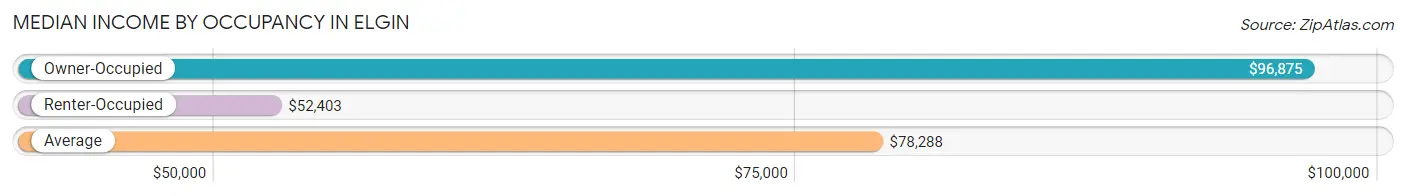
| Occupancy Type | # Households | Median Income |
| Owner-Occupied | 832 (67.4%) | $96,875 |
| Renter-Occupied | 403 (32.6%) | $52,403 |
| Average | 1,235 (100.0%) | $78,288 |
Occupancy by Householder Income Bracket in Elgin
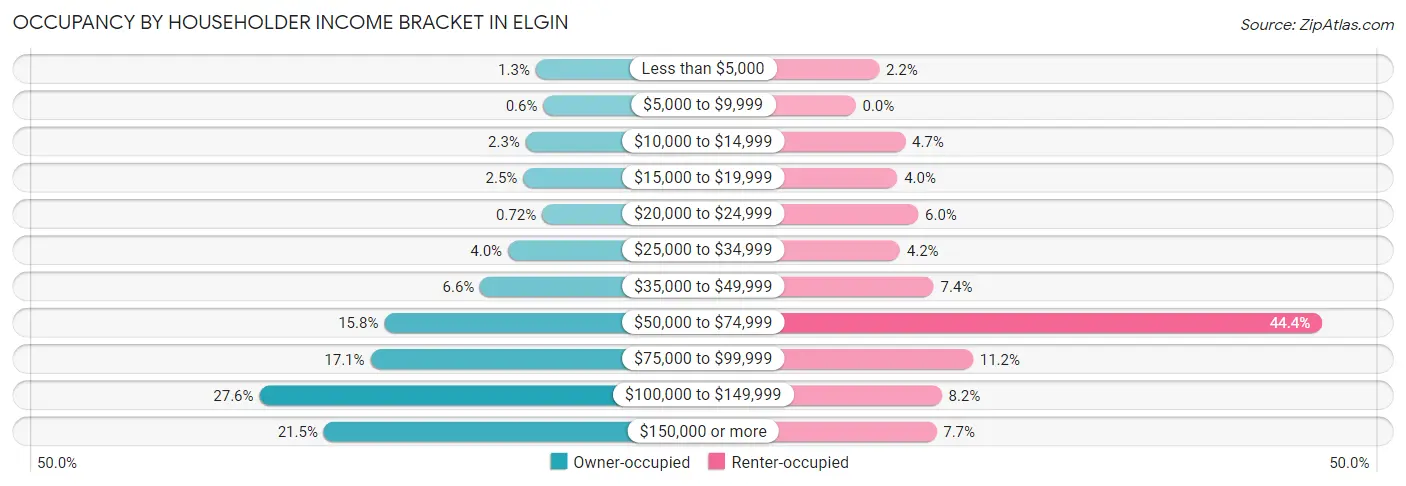
| Income Bracket | Owner-occupied | Renter-occupied |
| Less than $5,000 | 11 (1.3%) | 9 (2.2%) |
| $5,000 to $9,999 | 5 (0.6%) | 0 (0.0%) |
| $10,000 to $14,999 | 19 (2.3%) | 19 (4.7%) |
| $15,000 to $19,999 | 21 (2.5%) | 16 (4.0%) |
| $20,000 to $24,999 | 6 (0.7%) | 24 (6.0%) |
| $25,000 to $34,999 | 33 (4.0%) | 17 (4.2%) |
| $35,000 to $49,999 | 55 (6.6%) | 30 (7.4%) |
| $50,000 to $74,999 | 131 (15.8%) | 179 (44.4%) |
| $75,000 to $99,999 | 142 (17.1%) | 45 (11.2%) |
| $100,000 to $149,999 | 230 (27.6%) | 33 (8.2%) |
| $150,000 or more | 179 (21.5%) | 31 (7.7%) |
| Total | 832 (100.0%) | 403 (100.0%) |
Monthly Housing Cost Tiers in Elgin
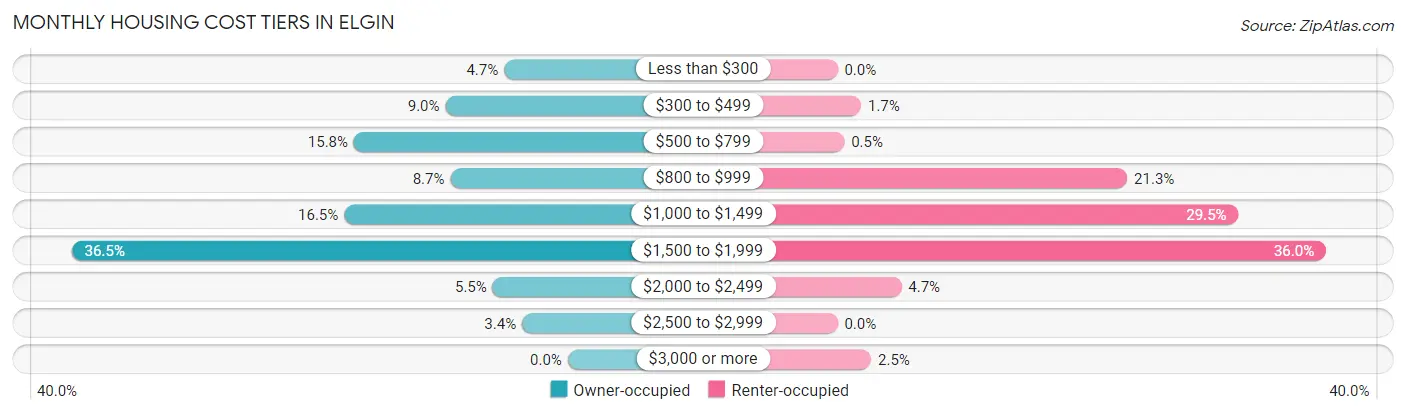
| Monthly Cost | Owner-occupied | Renter-occupied |
| Less than $300 | 39 (4.7%) | 0 (0.0%) |
| $300 to $499 | 75 (9.0%) | 7 (1.7%) |
| $500 to $799 | 131 (15.8%) | 2 (0.5%) |
| $800 to $999 | 72 (8.6%) | 86 (21.3%) |
| $1,000 to $1,499 | 137 (16.5%) | 119 (29.5%) |
| $1,500 to $1,999 | 304 (36.5%) | 145 (36.0%) |
| $2,000 to $2,499 | 46 (5.5%) | 19 (4.7%) |
| $2,500 to $2,999 | 28 (3.4%) | 0 (0.0%) |
| $3,000 or more | 0 (0.0%) | 10 (2.5%) |
| Total | 832 (100.0%) | 403 (100.0%) |
Physical Housing Characteristics in Elgin
Housing Structures in Elgin
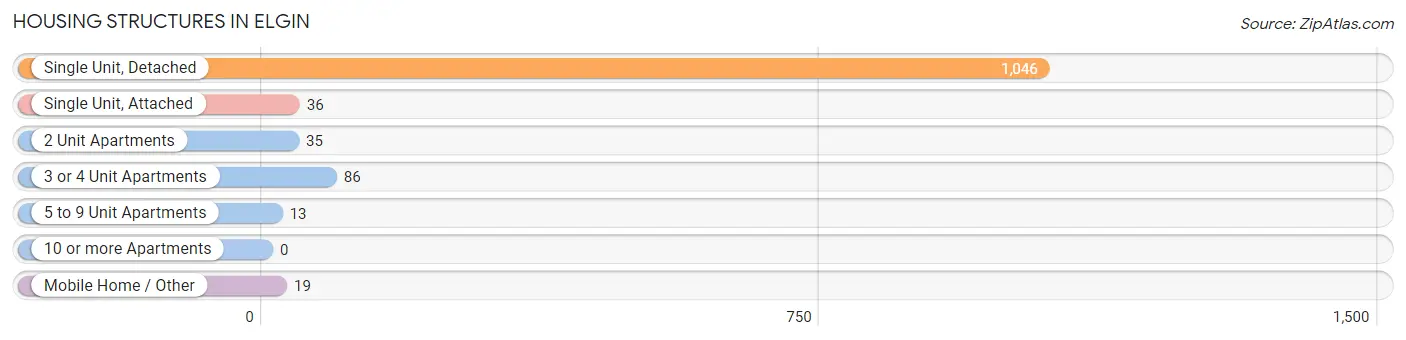
| Structure Type | # Housing Units | % Housing Units |
| Single Unit, Detached | 1,046 | 84.7% |
| Single Unit, Attached | 36 | 2.9% |
| 2 Unit Apartments | 35 | 2.8% |
| 3 or 4 Unit Apartments | 86 | 7.0% |
| 5 to 9 Unit Apartments | 13 | 1.1% |
| 10 or more Apartments | 0 | 0.0% |
| Mobile Home / Other | 19 | 1.5% |
| Total | 1,235 | 100.0% |
Housing Structures by Occupancy in Elgin
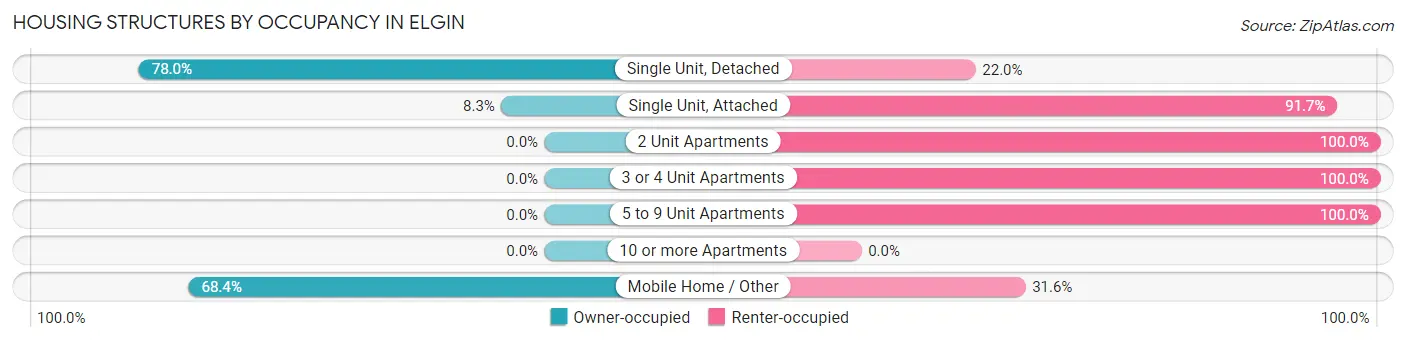
| Structure Type | Owner-occupied | Renter-occupied |
| Single Unit, Detached | 816 (78.0%) | 230 (22.0%) |
| Single Unit, Attached | 3 (8.3%) | 33 (91.7%) |
| 2 Unit Apartments | 0 (0.0%) | 35 (100.0%) |
| 3 or 4 Unit Apartments | 0 (0.0%) | 86 (100.0%) |
| 5 to 9 Unit Apartments | 0 (0.0%) | 13 (100.0%) |
| 10 or more Apartments | 0 (0.0%) | 0 (0.0%) |
| Mobile Home / Other | 13 (68.4%) | 6 (31.6%) |
| Total | 832 (67.4%) | 403 (32.6%) |
Housing Structures by Number of Rooms in Elgin
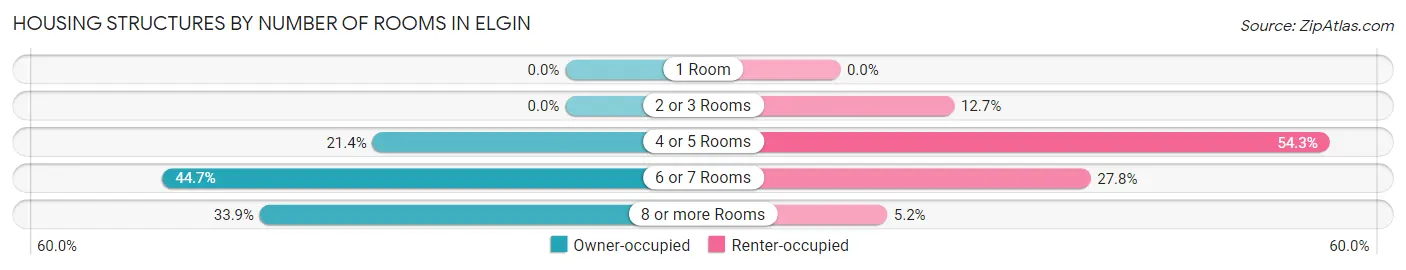
| Number of Rooms | Owner-occupied | Renter-occupied |
| 1 Room | 0 (0.0%) | 0 (0.0%) |
| 2 or 3 Rooms | 0 (0.0%) | 51 (12.7%) |
| 4 or 5 Rooms | 178 (21.4%) | 219 (54.3%) |
| 6 or 7 Rooms | 372 (44.7%) | 112 (27.8%) |
| 8 or more Rooms | 282 (33.9%) | 21 (5.2%) |
| Total | 832 (100.0%) | 403 (100.0%) |
Housing Structure by Heating Type in Elgin
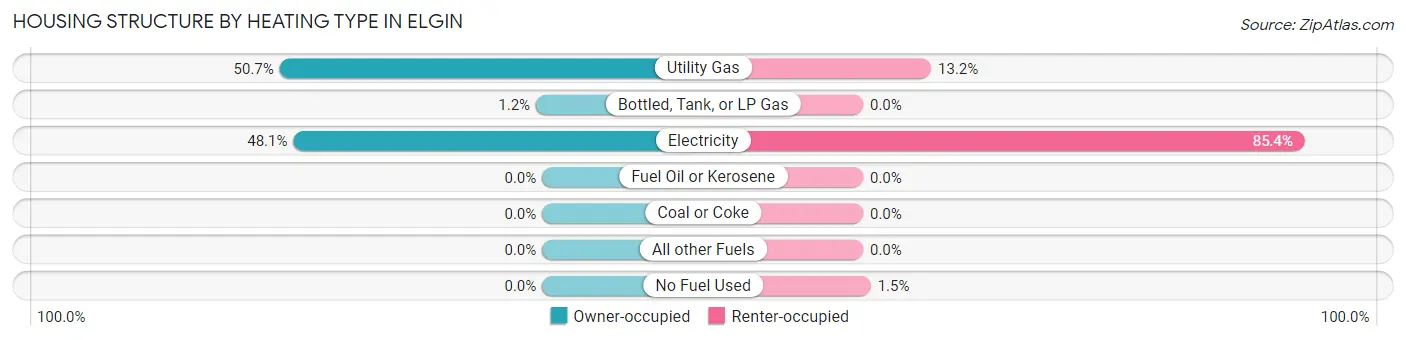
| Heating Type | Owner-occupied | Renter-occupied |
| Utility Gas | 422 (50.7%) | 53 (13.2%) |
| Bottled, Tank, or LP Gas | 10 (1.2%) | 0 (0.0%) |
| Electricity | 400 (48.1%) | 344 (85.4%) |
| Fuel Oil or Kerosene | 0 (0.0%) | 0 (0.0%) |
| Coal or Coke | 0 (0.0%) | 0 (0.0%) |
| All other Fuels | 0 (0.0%) | 0 (0.0%) |
| No Fuel Used | 0 (0.0%) | 6 (1.5%) |
| Total | 832 (100.0%) | 403 (100.0%) |
Household Vehicle Usage in Elgin
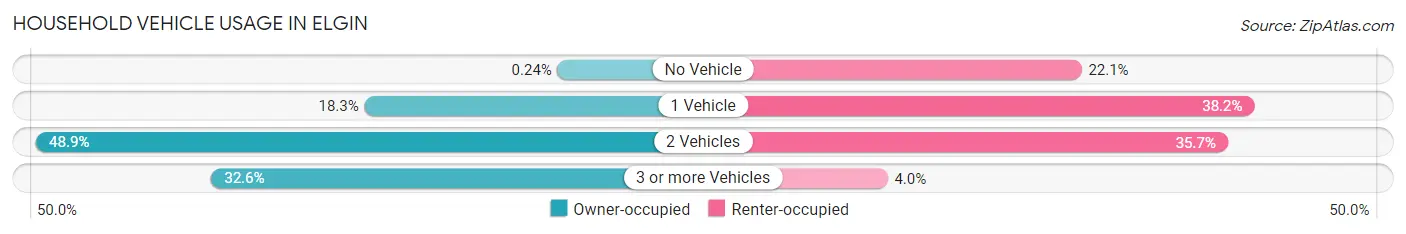
| Vehicles per Household | Owner-occupied | Renter-occupied |
| No Vehicle | 2 (0.2%) | 89 (22.1%) |
| 1 Vehicle | 152 (18.3%) | 154 (38.2%) |
| 2 Vehicles | 407 (48.9%) | 144 (35.7%) |
| 3 or more Vehicles | 271 (32.6%) | 16 (4.0%) |
| Total | 832 (100.0%) | 403 (100.0%) |
Real Estate & Mortgages in Elgin
Real Estate and Mortgage Overview in Elgin
| Characteristic | Without Mortgage | With Mortgage |
| Housing Units | 272 | 560 |
| Median Property Value | $230,700 | $237,300 |
| Median Household Income | $89,643 | $107 |
| Monthly Housing Costs | $650 | $0 |
| Real Estate Taxes | $2,380 | $78 |
Property Value by Mortgage Status in Elgin
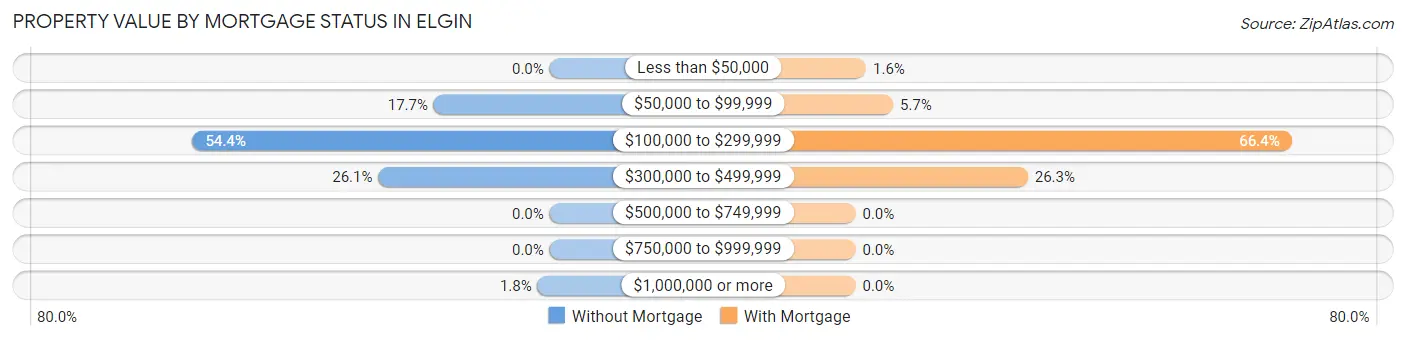
| Property Value | Without Mortgage | With Mortgage |
| Less than $50,000 | 0 (0.0%) | 9 (1.6%) |
| $50,000 to $99,999 | 48 (17.6%) | 32 (5.7%) |
| $100,000 to $299,999 | 148 (54.4%) | 372 (66.4%) |
| $300,000 to $499,999 | 71 (26.1%) | 147 (26.3%) |
| $500,000 to $749,999 | 0 (0.0%) | 0 (0.0%) |
| $750,000 to $999,999 | 0 (0.0%) | 0 (0.0%) |
| $1,000,000 or more | 5 (1.8%) | 0 (0.0%) |
| Total | 272 (100.0%) | 560 (100.0%) |
Household Income by Mortgage Status in Elgin
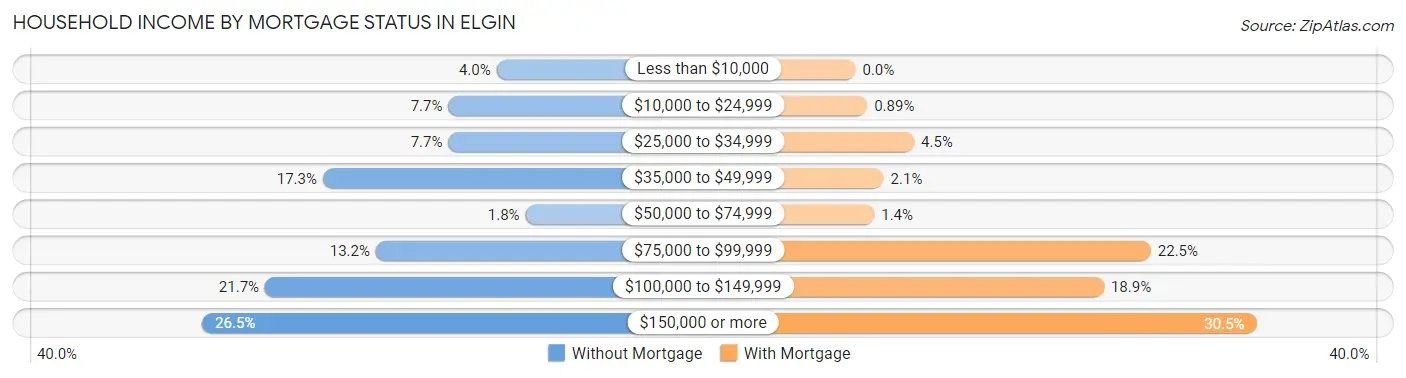
| Household Income | Without Mortgage | With Mortgage |
| Less than $10,000 | 11 (4.0%) | 0 (0.0%) |
| $10,000 to $24,999 | 21 (7.7%) | 5 (0.9%) |
| $25,000 to $34,999 | 21 (7.7%) | 25 (4.5%) |
| $35,000 to $49,999 | 47 (17.3%) | 12 (2.1%) |
| $50,000 to $74,999 | 5 (1.8%) | 8 (1.4%) |
| $75,000 to $99,999 | 36 (13.2%) | 126 (22.5%) |
| $100,000 to $149,999 | 59 (21.7%) | 106 (18.9%) |
| $150,000 or more | 72 (26.5%) | 171 (30.5%) |
| Total | 272 (100.0%) | 560 (100.0%) |
Property Value to Household Income Ratio in Elgin
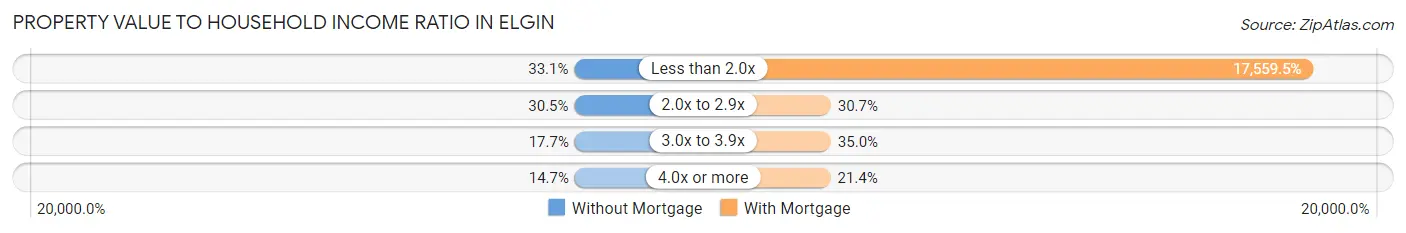
| Value-to-Income Ratio | Without Mortgage | With Mortgage |
| Less than 2.0x | 90 (33.1%) | 98,333 (17,559.5%) |
| 2.0x to 2.9x | 83 (30.5%) | 172 (30.7%) |
| 3.0x to 3.9x | 48 (17.6%) | 196 (35.0%) |
| 4.0x or more | 40 (14.7%) | 120 (21.4%) |
| Total | 272 (100.0%) | 560 (100.0%) |
Real Estate Taxes by Mortgage Status in Elgin
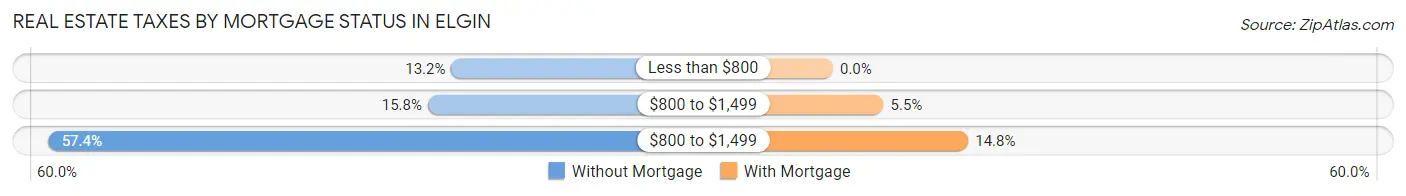
| Property Taxes | Without Mortgage | With Mortgage |
| Less than $800 | 36 (13.2%) | 0 (0.0%) |
| $800 to $1,499 | 43 (15.8%) | 31 (5.5%) |
| $800 to $1,499 | 156 (57.4%) | 83 (14.8%) |
| Total | 272 (100.0%) | 560 (100.0%) |
Health & Disability in Elgin
Health Insurance Coverage by Age in Elgin
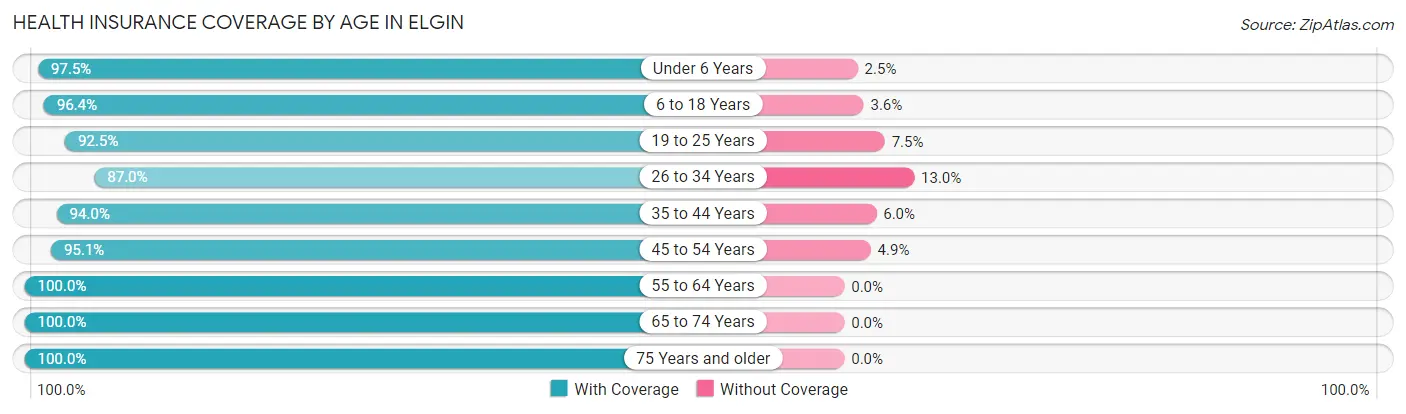
| Age Bracket | With Coverage | Without Coverage |
| Under 6 Years | 352 (97.5%) | 9 (2.5%) |
| 6 to 18 Years | 860 (96.4%) | 32 (3.6%) |
| 19 to 25 Years | 184 (92.5%) | 15 (7.5%) |
| 26 to 34 Years | 334 (87.0%) | 50 (13.0%) |
| 35 to 44 Years | 379 (94.0%) | 24 (6.0%) |
| 45 to 54 Years | 348 (95.1%) | 18 (4.9%) |
| 55 to 64 Years | 277 (100.0%) | 0 (0.0%) |
| 65 to 74 Years | 244 (100.0%) | 0 (0.0%) |
| 75 Years and older | 72 (100.0%) | 0 (0.0%) |
| Total | 3,050 (95.4%) | 148 (4.6%) |
Health Insurance Coverage by Citizenship Status in Elgin
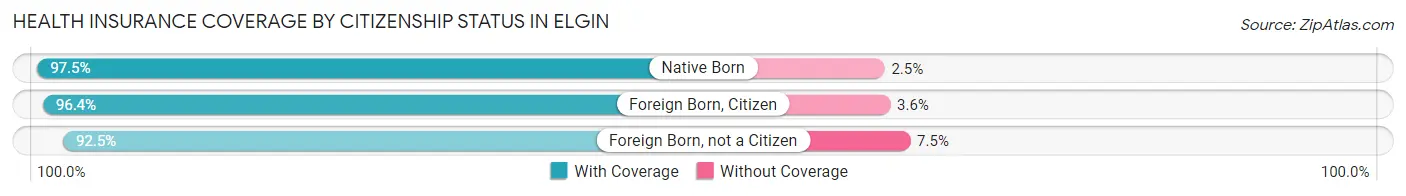
| Citizenship Status | With Coverage | Without Coverage |
| Native Born | 352 (97.5%) | 9 (2.5%) |
| Foreign Born, Citizen | 860 (96.4%) | 32 (3.6%) |
| Foreign Born, not a Citizen | 184 (92.5%) | 15 (7.5%) |
Health Insurance Coverage by Household Income in Elgin
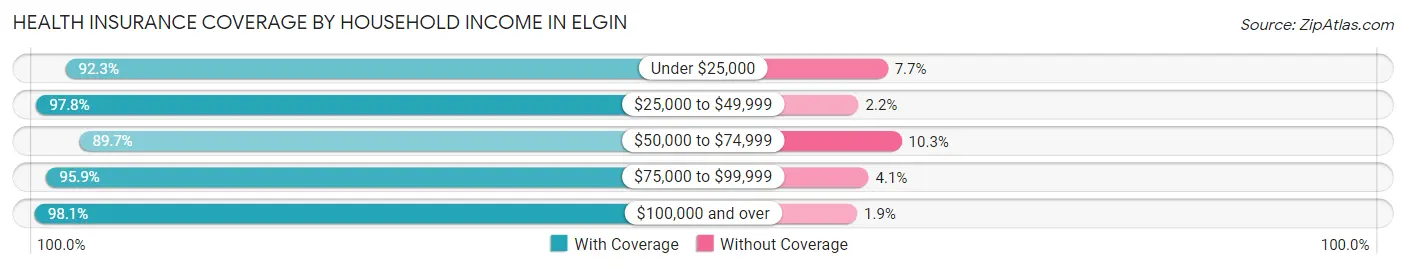
| Household Income | With Coverage | Without Coverage |
| Under $25,000 | 313 (92.3%) | 26 (7.7%) |
| $25,000 to $49,999 | 266 (97.8%) | 6 (2.2%) |
| $50,000 to $74,999 | 602 (89.7%) | 69 (10.3%) |
| $75,000 to $99,999 | 446 (95.9%) | 19 (4.1%) |
| $100,000 and over | 1,423 (98.1%) | 28 (1.9%) |
Public vs Private Health Insurance Coverage by Age in Elgin
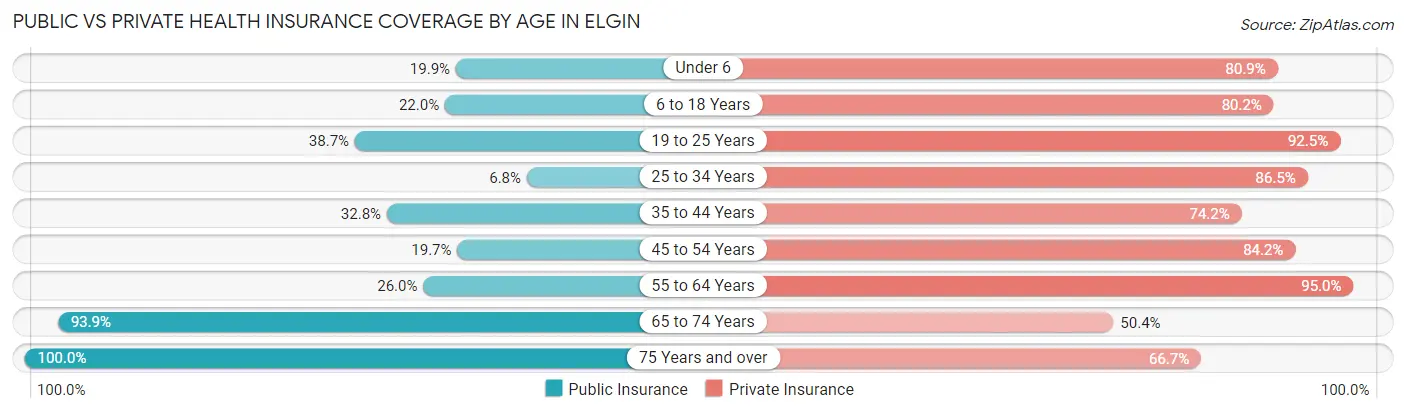
| Age Bracket | Public Insurance | Private Insurance |
| Under 6 | 72 (19.9%) | 292 (80.9%) |
| 6 to 18 Years | 196 (22.0%) | 715 (80.2%) |
| 19 to 25 Years | 77 (38.7%) | 184 (92.5%) |
| 25 to 34 Years | 26 (6.8%) | 332 (86.5%) |
| 35 to 44 Years | 132 (32.8%) | 299 (74.2%) |
| 45 to 54 Years | 72 (19.7%) | 308 (84.2%) |
| 55 to 64 Years | 72 (26.0%) | 263 (95.0%) |
| 65 to 74 Years | 229 (93.9%) | 123 (50.4%) |
| 75 Years and over | 72 (100.0%) | 48 (66.7%) |
| Total | 948 (29.6%) | 2,564 (80.2%) |
Disability Status by Sex by Age in Elgin
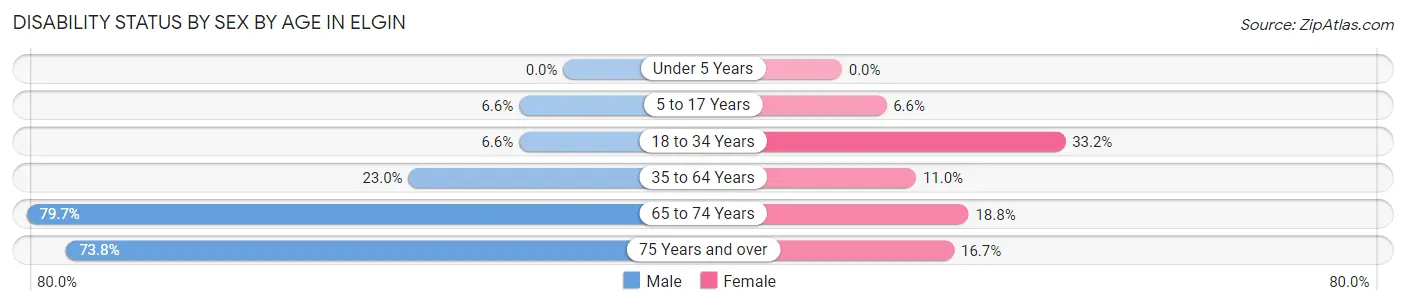
| Age Bracket | Male | Female |
| Under 5 Years | 0 (0.0%) | 0 (0.0%) |
| 5 to 17 Years | 31 (6.6%) | 31 (6.6%) |
| 18 to 34 Years | 15 (6.6%) | 137 (33.2%) |
| 35 to 64 Years | 109 (23.0%) | 63 (11.0%) |
| 65 to 74 Years | 114 (79.7%) | 19 (18.8%) |
| 75 Years and over | 31 (73.8%) | 5 (16.7%) |
Disability Class by Sex by Age in Elgin
Disability Class: Hearing Difficulty
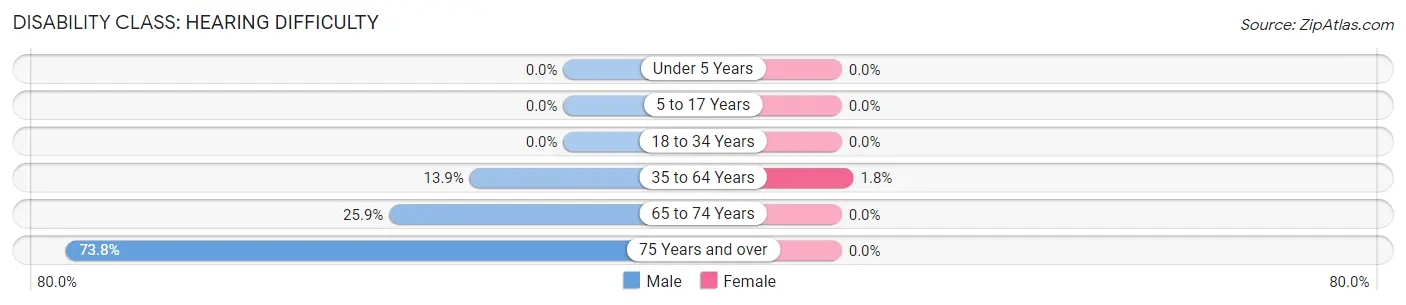
| Age Bracket | Male | Female |
| Under 5 Years | 0 (0.0%) | 0 (0.0%) |
| 5 to 17 Years | 0 (0.0%) | 0 (0.0%) |
| 18 to 34 Years | 0 (0.0%) | 0 (0.0%) |
| 35 to 64 Years | 66 (13.9%) | 10 (1.8%) |
| 65 to 74 Years | 37 (25.9%) | 0 (0.0%) |
| 75 Years and over | 31 (73.8%) | 0 (0.0%) |
Disability Class: Vision Difficulty
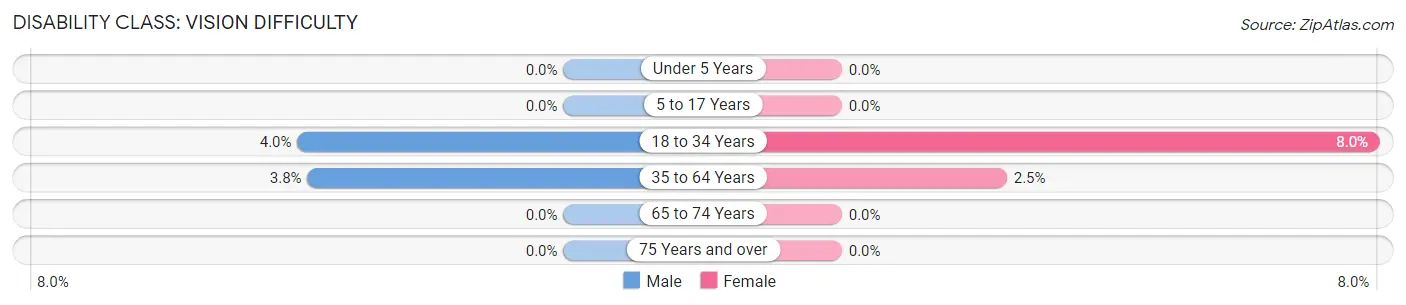
| Age Bracket | Male | Female |
| Under 5 Years | 0 (0.0%) | 0 (0.0%) |
| 5 to 17 Years | 0 (0.0%) | 0 (0.0%) |
| 18 to 34 Years | 9 (4.0%) | 33 (8.0%) |
| 35 to 64 Years | 18 (3.8%) | 14 (2.5%) |
| 65 to 74 Years | 0 (0.0%) | 0 (0.0%) |
| 75 Years and over | 0 (0.0%) | 0 (0.0%) |
Disability Class: Cognitive Difficulty
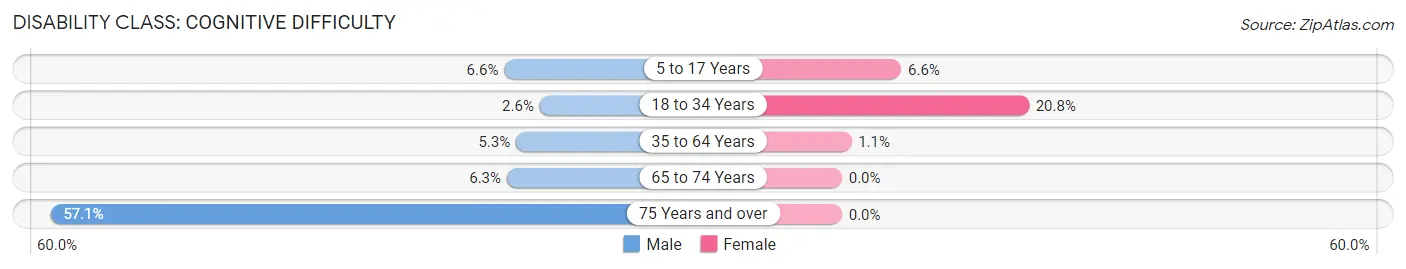
| Age Bracket | Male | Female |
| 5 to 17 Years | 31 (6.6%) | 31 (6.6%) |
| 18 to 34 Years | 6 (2.6%) | 86 (20.8%) |
| 35 to 64 Years | 25 (5.3%) | 6 (1.1%) |
| 65 to 74 Years | 9 (6.3%) | 0 (0.0%) |
| 75 Years and over | 24 (57.1%) | 0 (0.0%) |
Disability Class: Ambulatory Difficulty
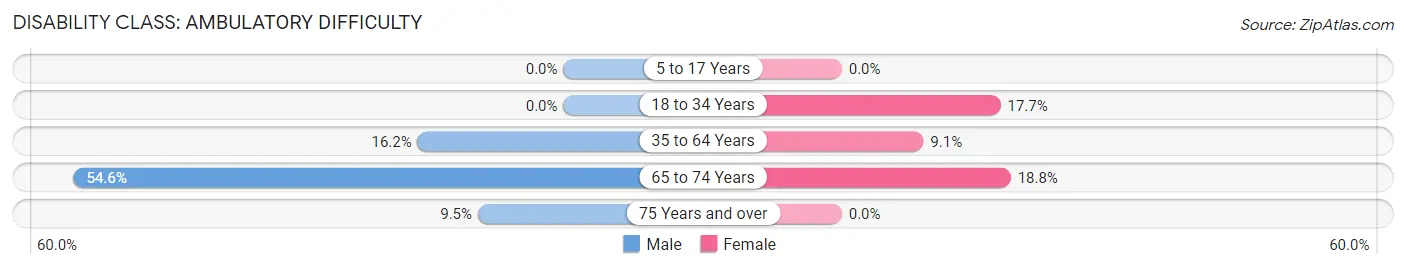
| Age Bracket | Male | Female |
| 5 to 17 Years | 0 (0.0%) | 0 (0.0%) |
| 18 to 34 Years | 0 (0.0%) | 73 (17.7%) |
| 35 to 64 Years | 77 (16.2%) | 52 (9.1%) |
| 65 to 74 Years | 78 (54.5%) | 19 (18.8%) |
| 75 Years and over | 4 (9.5%) | 0 (0.0%) |
Disability Class: Self-Care Difficulty
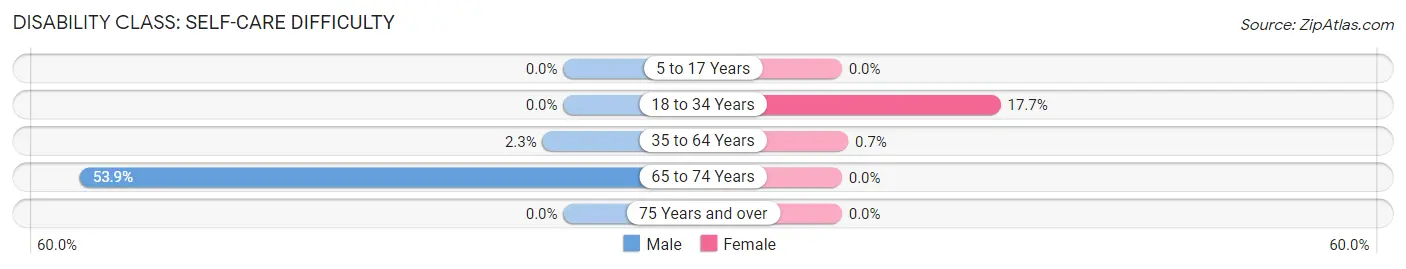
| Age Bracket | Male | Female |
| 5 to 17 Years | 0 (0.0%) | 0 (0.0%) |
| 18 to 34 Years | 0 (0.0%) | 73 (17.7%) |
| 35 to 64 Years | 11 (2.3%) | 4 (0.7%) |
| 65 to 74 Years | 77 (53.8%) | 0 (0.0%) |
| 75 Years and over | 0 (0.0%) | 0 (0.0%) |
Technology Access in Elgin
Computing Device Access in Elgin
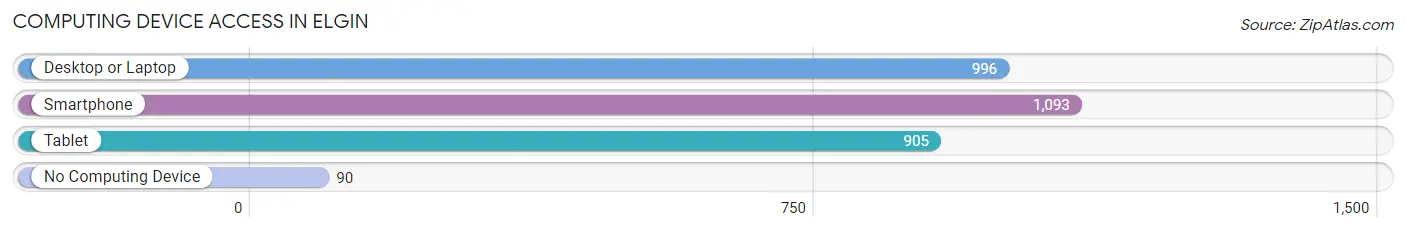
| Device Type | # Households | % Households |
| Desktop or Laptop | 996 | 80.6% |
| Smartphone | 1,093 | 88.5% |
| Tablet | 905 | 73.3% |
| No Computing Device | 90 | 7.3% |
| Total | 1,235 | 100.0% |
Internet Access in Elgin
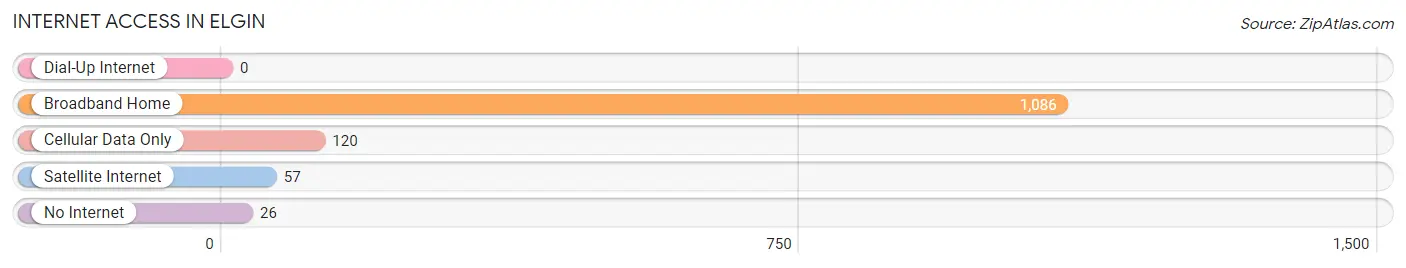
| Internet Type | # Households | % Households |
| Dial-Up Internet | 0 | 0.0% |
| Broadband Home | 1,086 | 87.9% |
| Cellular Data Only | 120 | 9.7% |
| Satellite Internet | 57 | 4.6% |
| No Internet | 26 | 2.1% |
| Total | 1,235 | 100.0% |
Elgin Summary
Elgin, Oklahoma is a small town located in Comanche County, Oklahoma. It is situated in the southwestern part of the state, approximately 20 miles east of Lawton and about 90 miles southwest of Oklahoma City. The town was founded in 1892 and was named after a local rancher, John Elgin. The population of Elgin was 1,845 at the 2010 census, making it the second-largest town in Comanche County.
Geography
Elgin is located at 34°45'25" North, 98°25'45" West (34.7569, -98.4261). It is situated in the southwestern part of the state, approximately 20 miles east of Lawton and about 90 miles southwest of Oklahoma City. The town is located in the Red Bed Plains region of Oklahoma, which is characterized by rolling hills and flat plains. The elevation of Elgin is 1,068 feet above sea level.
The town is situated on the banks of the Washita River, which is a tributary of the Red River. The Washita River is a popular destination for fishing, canoeing, and kayaking. The town is also located near Lake Ellsworth, which is a popular destination for swimming, boating, and camping.
Climate
Elgin has a humid subtropical climate, with hot summers and mild winters. The average annual temperature is 64°F, with an average high of 91°F in the summer and an average low of 37°F in the winter. The average annual precipitation is 33.5 inches, with an average of 4.5 inches of snowfall per year.
Demographics
As of the 2010 census, the population of Elgin was 1,845. The racial makeup of the town was 79.2% White, 15.2% Native American, 0.7% African American, 0.3% Asian, 0.1% Pacific Islander, and 4.5% from other races. Hispanic or Latino of any race were 4.2% of the population.
The median household income in Elgin was $35,938, and the median family income was $41,250. The per capita income for the town was $17,845. About 16.2% of families and 19.2% of the population were below the poverty line, including 25.2% of those under age 18 and 11.2% of those age 65 or over.
Economy
Elgin’s economy is largely based on agriculture and oil production. The town is home to several large farms, as well as several oil and gas production companies. The town is also home to several small businesses, including restaurants, retail stores, and service providers.
The town is served by the Elgin Public Schools, which includes an elementary school, a middle school, and a high school. The town is also home to the Elgin Community College, which offers a variety of courses and programs.
Elgin is served by the Elgin Municipal Airport, which is located just outside of town. The airport offers general aviation services, as well as charter flights. The town is also served by the Lawton-Fort Sill Regional Airport, which is located about 20 miles away.
Elgin is served by several major highways, including Interstate 44, US Highway 62, and US Highway 277. The town is also served by the Lawton-Fort Sill Regional Airport, which is located about 20 miles away.
Conclusion
Elgin, Oklahoma is a small town located in Comanche County, Oklahoma. It is situated in the southwestern part of the state, approximately 20 miles east of Lawton and about 90 miles southwest of Oklahoma City. The town was founded in 1892 and was named after a local rancher, John Elgin. The population of Elgin was 1,845 at the 2010 census, making it the second-largest town in Comanche County. Elgin’s economy is largely based on agriculture and oil production, and the town is served by the Elgin Public Schools, the Elgin Community College, and the Lawton-Fort Sill Regional Airport.
Common Questions
What is Per Capita Income in Elgin?
Per Capita income in Elgin is $32,750.
What is the Median Family Income in Elgin?
Median Family Income in Elgin is $88,958.
What is the Median Household income in Elgin?
Median Household Income in Elgin is $78,288.
What is Income or Wage Gap in Elgin?
Income or Wage Gap in Elgin is 40.2%.
Women in Elgin earn 59.8 cents for every dollar earned by a man.
What is Family Income Deficit in Elgin?
Family Income Deficit in Elgin is $9,517.
Families that are below poverty line in Elgin earn $9,517 less on average than the poverty threshold level.
What is Inequality or Gini Index in Elgin?
Inequality or Gini Index in Elgin is 0.34.
What is the Total Population of Elgin?
Total Population of Elgin is 3,498.
What is the Total Male Population of Elgin?
Total Male Population of Elgin is 1,715.
What is the Total Female Population of Elgin?
Total Female Population of Elgin is 1,783.
What is the Ratio of Males per 100 Females in Elgin?
There are 96.19 Males per 100 Females in Elgin.
What is the Ratio of Females per 100 Males in Elgin?
There are 103.97 Females per 100 Males in Elgin.
What is the Median Population Age in Elgin?
Median Population Age in Elgin is 31.3 Years.
What is the Average Family Size in Elgin
Average Family Size in Elgin is 3.5 People.
What is the Average Household Size in Elgin
Average Household Size in Elgin is 2.8 People.
How Large is the Labor Force in Elgin?
There are 1,598 People in the Labor Forcein in Elgin.
What is the Percentage of People in the Labor Force in Elgin?
66.6% of People are in the Labor Force in Elgin.
What is the Unemployment Rate in Elgin?
Unemployment Rate in Elgin is 4.2%.