Commerce, OK Map & Demographics
Commerce Map
Commerce Overview
$18,649
PER CAPITA INCOME
$39,286
AVG FAMILY INCOME
$35,221
AVG HOUSEHOLD INCOME
23.1%
WAGE / INCOME GAP [ % ]
76.9¢/ $1
WAGE / INCOME GAP [ $ ]
$9,789
FAMILY INCOME DEFICIT
0.46
INEQUALITY / GINI INDEX
2,302
TOTAL POPULATION
1,154
MALE POPULATION
1,148
FEMALE POPULATION
100.52
MALES / 100 FEMALES
99.48
FEMALES / 100 MALES
33.7
MEDIAN AGE
3.2
AVG FAMILY SIZE
2.6
AVG HOUSEHOLD SIZE
936
LABOR FORCE [ PEOPLE ]
55.7%
PERCENT IN LABOR FORCE
4.0%
UNEMPLOYMENT RATE
Commerce Zip Codes
Commerce Area Codes
Income in Commerce
Income Overview in Commerce
Per Capita Income in Commerce is $18,649, while median incomes of families and households are $39,286 and $35,221 respectively.
| Characteristic | Number | Measure |
| Per Capita Income | 2,302 | $18,649 |
| Median Family Income | 550 | $39,286 |
| Mean Family Income | 550 | $54,350 |
| Median Household Income | 837 | $35,221 |
| Mean Household Income | 837 | $48,143 |
| Income Deficit | 550 | $9,789 |
| Wage / Income Gap (%) | 2,302 | 23.06% |
| Wage / Income Gap ($) | 2,302 | 76.94¢ per $1 |
| Gini / Inequality Index | 2,302 | 0.46 |
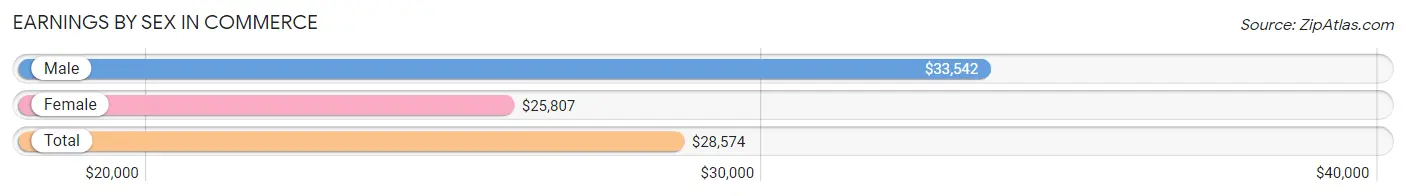
Earnings by Sex in Commerce
Average Earnings in Commerce are $28,574, $33,542 for men and $25,807 for women, a difference of 23.1%.
| Sex | Number | Average Earnings |
| Male | 454 (47.3%) | $33,542 |
| Female | 505 (52.7%) | $25,807 |
| Total | 959 (100.0%) | $28,574 |
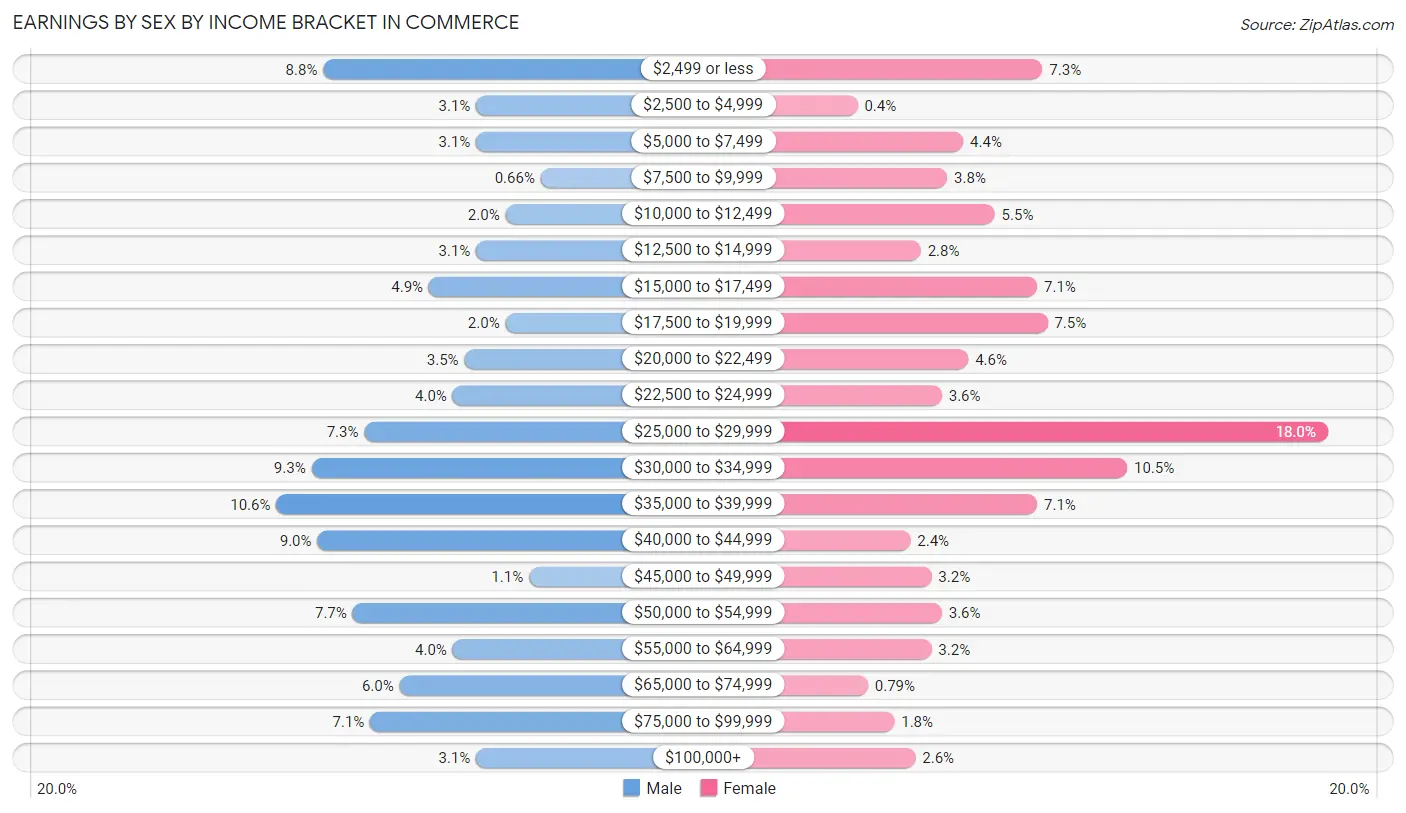
Earnings by Sex by Income Bracket in Commerce
The most common earnings brackets in Commerce are $35,000 to $39,999 for men (48 | 10.6%) and $25,000 to $29,999 for women (91 | 18.0%).
| Income | Male | Female |
| $2,499 or less | 40 (8.8%) | 37 (7.3%) |
| $2,500 to $4,999 | 14 (3.1%) | 2 (0.4%) |
| $5,000 to $7,499 | 14 (3.1%) | 22 (4.4%) |
| $7,500 to $9,999 | 3 (0.7%) | 19 (3.8%) |
| $10,000 to $12,499 | 9 (2.0%) | 28 (5.5%) |
| $12,500 to $14,999 | 14 (3.1%) | 14 (2.8%) |
| $15,000 to $17,499 | 22 (4.9%) | 36 (7.1%) |
| $17,500 to $19,999 | 9 (2.0%) | 38 (7.5%) |
| $20,000 to $22,499 | 16 (3.5%) | 23 (4.5%) |
| $22,500 to $24,999 | 18 (4.0%) | 18 (3.6%) |
| $25,000 to $29,999 | 33 (7.3%) | 91 (18.0%) |
| $30,000 to $34,999 | 42 (9.2%) | 53 (10.5%) |
| $35,000 to $39,999 | 48 (10.6%) | 36 (7.1%) |
| $40,000 to $44,999 | 41 (9.0%) | 12 (2.4%) |
| $45,000 to $49,999 | 5 (1.1%) | 16 (3.2%) |
| $50,000 to $54,999 | 35 (7.7%) | 18 (3.6%) |
| $55,000 to $64,999 | 18 (4.0%) | 16 (3.2%) |
| $65,000 to $74,999 | 27 (5.9%) | 4 (0.8%) |
| $75,000 to $99,999 | 32 (7.0%) | 9 (1.8%) |
| $100,000+ | 14 (3.1%) | 13 (2.6%) |
| Total | 454 (100.0%) | 505 (100.0%) |
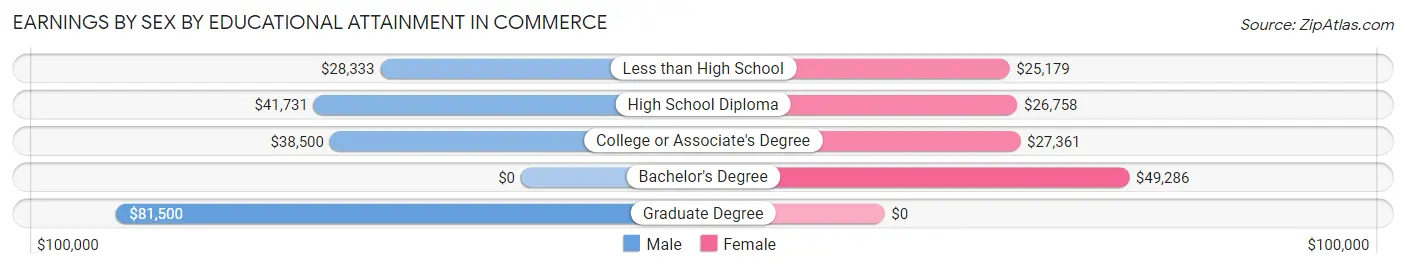
Earnings by Sex by Educational Attainment in Commerce
Average earnings in Commerce are $38,239 for men and $27,448 for women, a difference of 28.2%. Men with an educational attainment of graduate degree enjoy the highest average annual earnings of $81,500, while those with less than high school education earn the least with $28,333. Women with an educational attainment of bachelor's degree earn the most with the average annual earnings of $49,286, while those with less than high school education have the smallest earnings of $25,179.
| Educational Attainment | Male Income | Female Income |
| Less than High School | $28,333 | $25,179 |
| High School Diploma | $41,731 | $26,758 |
| College or Associate's Degree | $38,500 | $27,361 |
| Bachelor's Degree | - | - |
| Graduate Degree | $81,500 | $0 |
| Total | $38,239 | $27,448 |
Family Income in Commerce
Family Income Brackets in Commerce
According to the Commerce family income data, there are 106 families falling into the $50,000 to $74,999 income range, which is the most common income bracket and makes up 19.3% of all families. Conversely, the $200,000+ income bracket is the least frequent group with only 5 families (0.9%) belonging to this category.
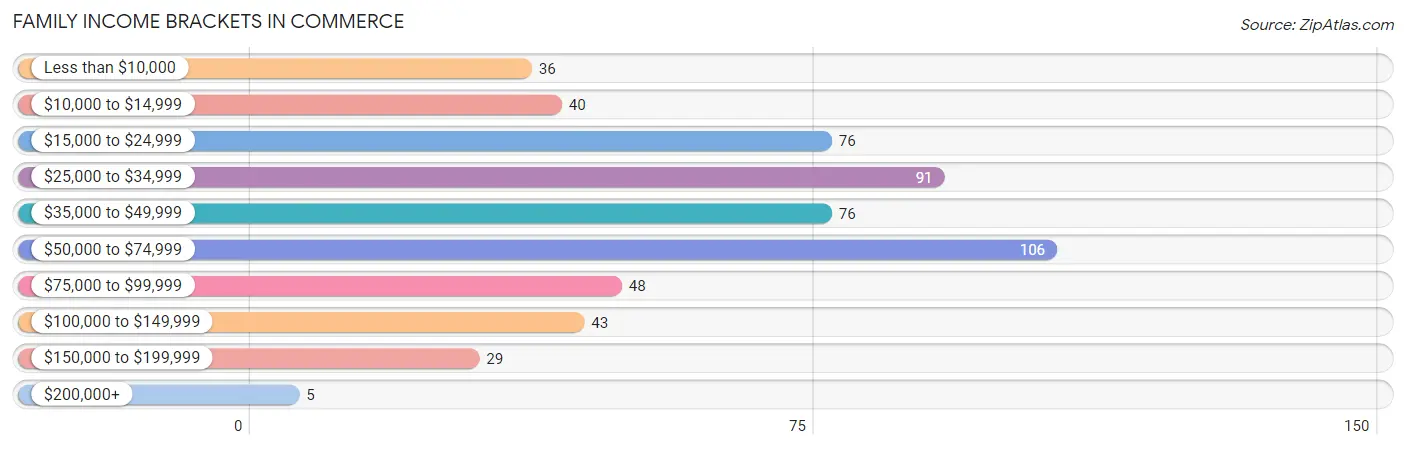
| Income Bracket | # Families | % Families |
| Less than $10,000 | 36 | 6.5% |
| $10,000 to $14,999 | 40 | 7.3% |
| $15,000 to $24,999 | 76 | 13.8% |
| $25,000 to $34,999 | 91 | 16.5% |
| $35,000 to $49,999 | 76 | 13.8% |
| $50,000 to $74,999 | 106 | 19.3% |
| $75,000 to $99,999 | 48 | 8.7% |
| $100,000 to $149,999 | 43 | 7.8% |
| $150,000 to $199,999 | 29 | 5.3% |
| $200,000+ | 5 | 0.9% |
Family Income by Famaliy Size in Commerce
6-person families (31 | 5.6%) account for the highest median family income in Commerce with $81,250 per family, while 2-person families (232 | 42.2%) have the highest median income of $18,646 per family member.
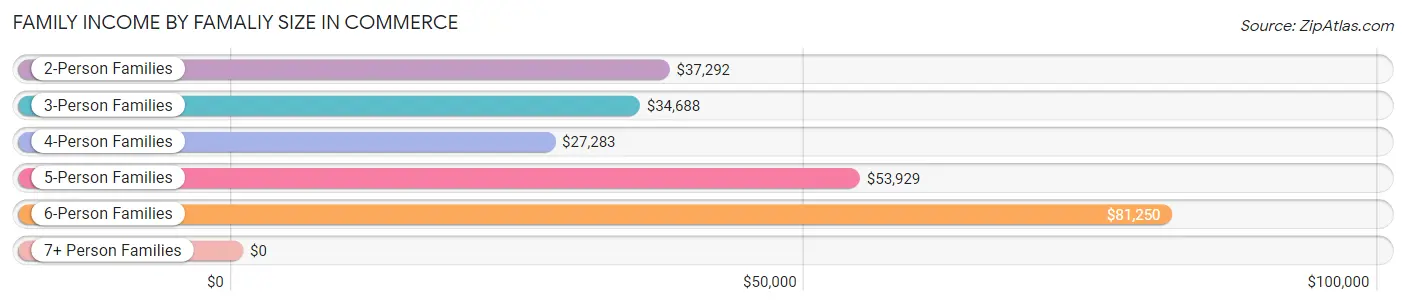
| Income Bracket | # Families | Median Income |
| 2-Person Families | 232 (42.2%) | $37,292 |
| 3-Person Families | 111 (20.2%) | $34,688 |
| 4-Person Families | 104 (18.9%) | $27,283 |
| 5-Person Families | 52 (9.5%) | $53,929 |
| 6-Person Families | 31 (5.6%) | $81,250 |
| 7+ Person Families | 20 (3.6%) | $0 |
| Total | 550 (100.0%) | $39,286 |
Family Income by Number of Earners in Commerce
The median family income in Commerce is $39,286, with families comprising 3+ earners (45) having the highest median family income of $136,250, while families with no earners (117) have the lowest median family income of $17,875, accounting for 8.2% and 21.3% of families, respectively.
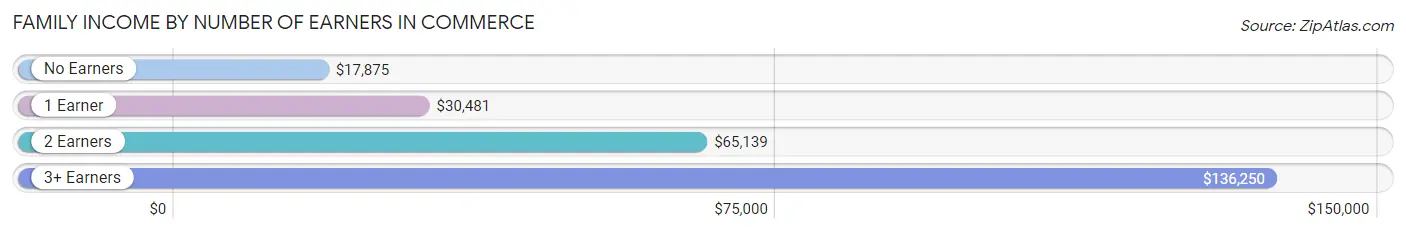
| Number of Earners | # Families | Median Income |
| No Earners | 117 (21.3%) | $17,875 |
| 1 Earner | 235 (42.7%) | $30,481 |
| 2 Earners | 153 (27.8%) | $65,139 |
| 3+ Earners | 45 (8.2%) | $136,250 |
| Total | 550 (100.0%) | $39,286 |
Household Income in Commerce
Household Income Brackets in Commerce
With 153 households falling in the category, the $50,000 to $74,999 income range is the most frequent in Commerce, accounting for 18.3% of all households. In contrast, only 5 households (0.6%) fall into the $200,000+ income bracket, making it the least populous group.
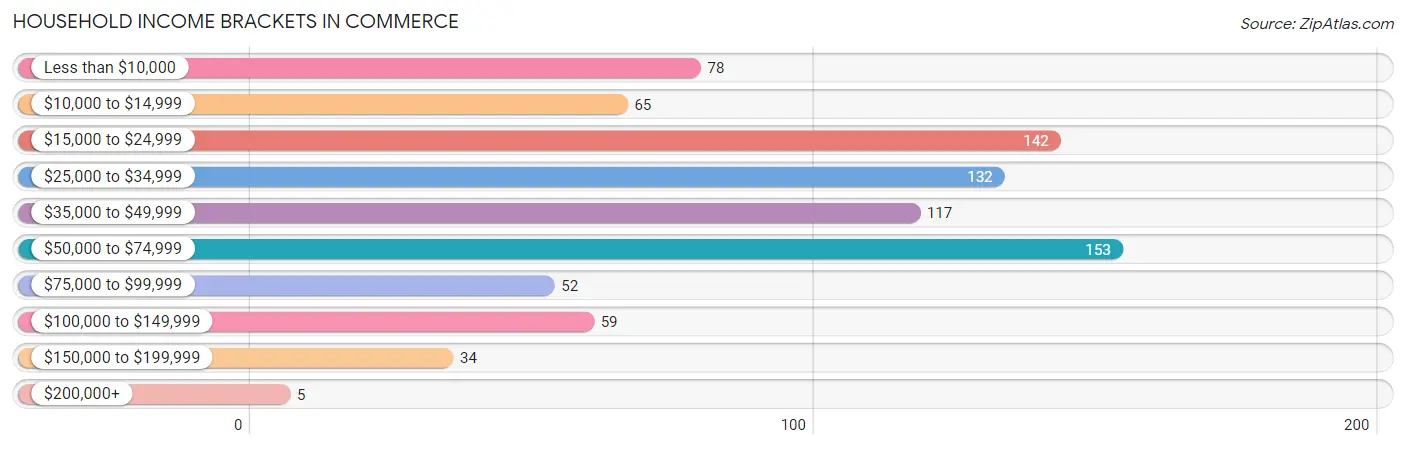
| Income Bracket | # Households | % Households |
| Less than $10,000 | 78 | 9.3% |
| $10,000 to $14,999 | 65 | 7.8% |
| $15,000 to $24,999 | 142 | 17.0% |
| $25,000 to $34,999 | 132 | 15.8% |
| $35,000 to $49,999 | 117 | 14.0% |
| $50,000 to $74,999 | 153 | 18.3% |
| $75,000 to $99,999 | 52 | 6.2% |
| $100,000 to $149,999 | 59 | 7.0% |
| $150,000 to $199,999 | 34 | 4.1% |
| $200,000+ | 5 | 0.6% |
Household Income by Householder Age in Commerce
The median household income in Commerce is $35,221, with the highest median household income of $42,500 found in the 15 to 24 years age bracket for the primary householder. A total of 50 households (6.0%) fall into this category. Meanwhile, the 65+ years age bracket for the primary householder has the lowest median household income of $29,375, with 180 households (21.5%) in this group.
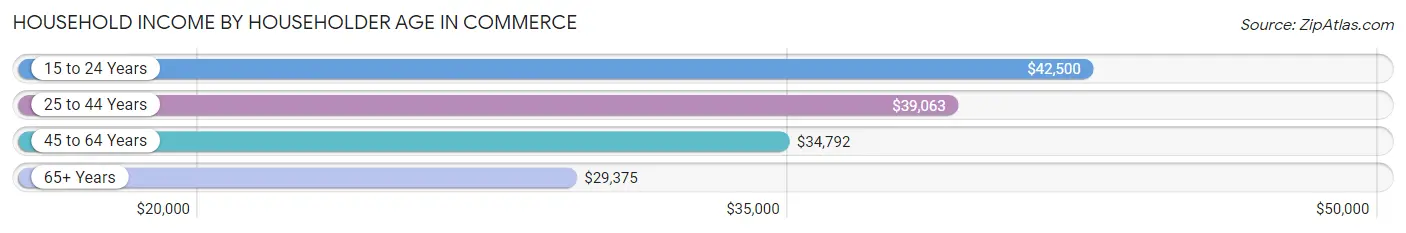
| Income Bracket | # Households | Median Income |
| 15 to 24 Years | 50 (6.0%) | $42,500 |
| 25 to 44 Years | 296 (35.4%) | $39,063 |
| 45 to 64 Years | 311 (37.2%) | $34,792 |
| 65+ Years | 180 (21.5%) | $29,375 |
| Total | 837 (100.0%) | $35,221 |
Poverty in Commerce
Income Below Poverty by Sex and Age in Commerce
With 33.0% poverty level for males and 33.7% for females among the residents of Commerce, under 5 year old males and 15 year old females are the most vulnerable to poverty, with 69 males (61.6%) and 16 females (80.0%) in their respective age groups living below the poverty level.
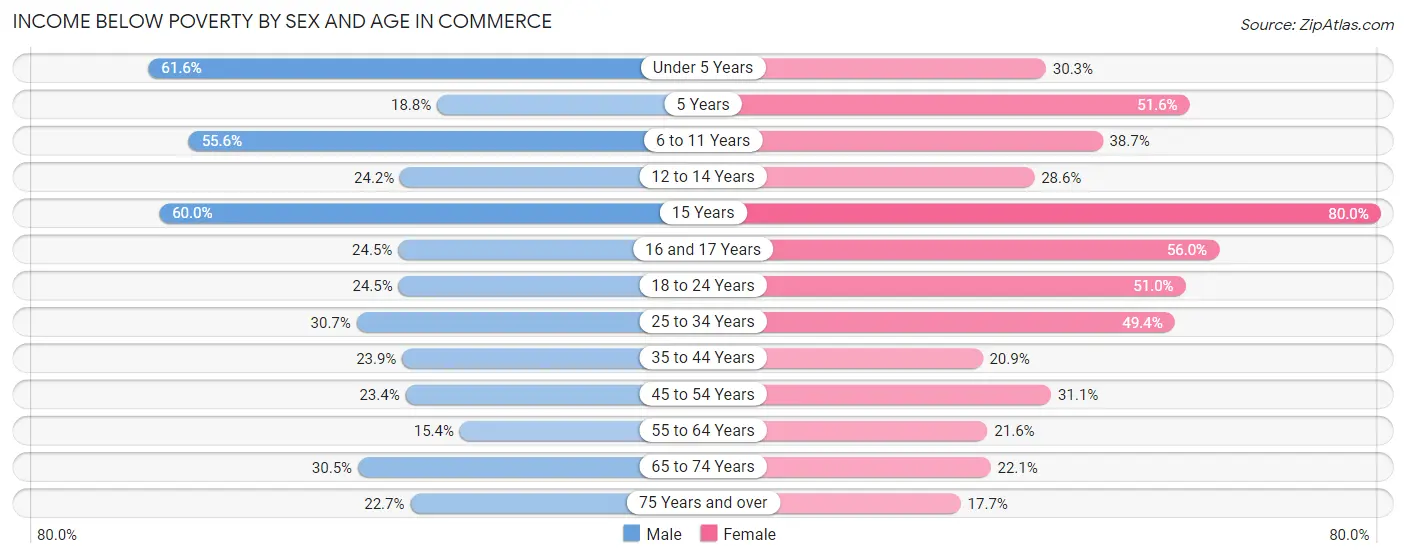
| Age Bracket | Male | Female |
| Under 5 Years | 69 (61.6%) | 20 (30.3%) |
| 5 Years | 3 (18.8%) | 16 (51.6%) |
| 6 to 11 Years | 89 (55.6%) | 24 (38.7%) |
| 12 to 14 Years | 16 (24.2%) | 16 (28.6%) |
| 15 Years | 9 (60.0%) | 16 (80.0%) |
| 16 and 17 Years | 13 (24.5%) | 14 (56.0%) |
| 18 to 24 Years | 23 (24.5%) | 50 (51.0%) |
| 25 to 34 Years | 35 (30.7%) | 84 (49.4%) |
| 35 to 44 Years | 39 (23.9%) | 33 (20.9%) |
| 45 to 54 Years | 30 (23.4%) | 37 (31.1%) |
| 55 to 64 Years | 14 (15.4%) | 32 (21.6%) |
| 65 to 74 Years | 18 (30.5%) | 19 (22.1%) |
| 75 Years and over | 10 (22.7%) | 12 (17.6%) |
| Total | 368 (33.0%) | 373 (33.7%) |
Income Above Poverty by Sex and Age in Commerce
According to the poverty statistics in Commerce, males aged 55 to 64 years and females aged 75 years and over are the age groups that are most secure financially, with 84.6% of males and 82.4% of females in these age groups living above the poverty line.
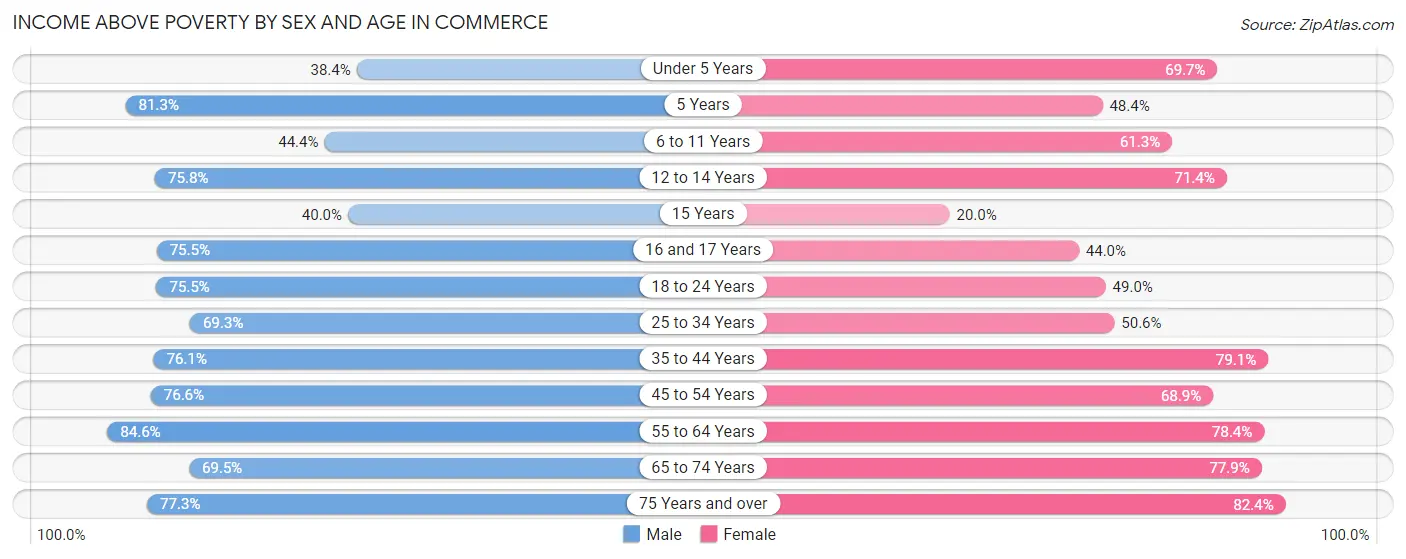
| Age Bracket | Male | Female |
| Under 5 Years | 43 (38.4%) | 46 (69.7%) |
| 5 Years | 13 (81.2%) | 15 (48.4%) |
| 6 to 11 Years | 71 (44.4%) | 38 (61.3%) |
| 12 to 14 Years | 50 (75.8%) | 40 (71.4%) |
| 15 Years | 6 (40.0%) | 4 (20.0%) |
| 16 and 17 Years | 40 (75.5%) | 11 (44.0%) |
| 18 to 24 Years | 71 (75.5%) | 48 (49.0%) |
| 25 to 34 Years | 79 (69.3%) | 86 (50.6%) |
| 35 to 44 Years | 124 (76.1%) | 125 (79.1%) |
| 45 to 54 Years | 98 (76.6%) | 82 (68.9%) |
| 55 to 64 Years | 77 (84.6%) | 116 (78.4%) |
| 65 to 74 Years | 41 (69.5%) | 67 (77.9%) |
| 75 Years and over | 34 (77.3%) | 56 (82.4%) |
| Total | 747 (67.0%) | 734 (66.3%) |
Income Below Poverty Among Married-Couple Families in Commerce
The poverty statistics for married-couple families in Commerce show that 16.9% or 44 of the total 261 families live below the poverty line. Families with 3 or 4 children have the highest poverty rate of 29.7%, comprising of 11 families. On the other hand, families with 1 or 2 children have the lowest poverty rate of 10.8%, which includes 11 families.
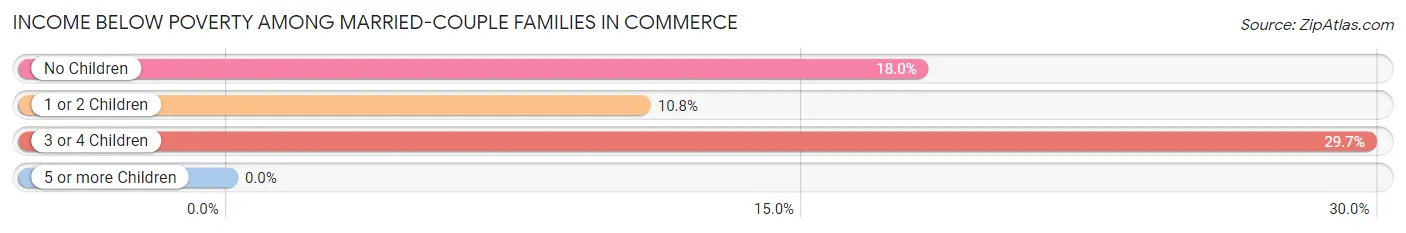
| Children | Above Poverty | Below Poverty |
| No Children | 100 (82.0%) | 22 (18.0%) |
| 1 or 2 Children | 91 (89.2%) | 11 (10.8%) |
| 3 or 4 Children | 26 (70.3%) | 11 (29.7%) |
| 5 or more Children | 0 (0.0%) | 0 (0.0%) |
| Total | 217 (83.1%) | 44 (16.9%) |
Income Below Poverty Among Single-Parent Households in Commerce
According to the poverty data in Commerce, 33.3% or 18 single-father households and 47.2% or 111 single-mother households are living below the poverty line. Among single-father households, those with 1 or 2 children have the highest poverty rate, with 15 households (65.2%) experiencing poverty. Likewise, among single-mother households, those with 5 or more children have the highest poverty rate, with 5 households (100.0%) falling below the poverty line.
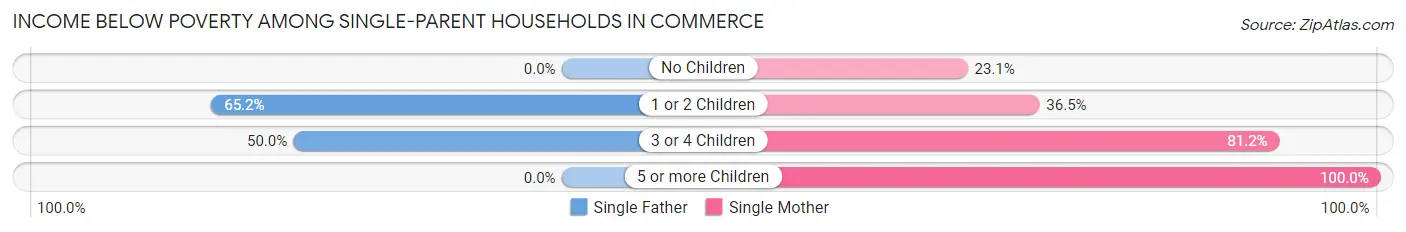
| Children | Single Father | Single Mother |
| No Children | 0 (0.0%) | 15 (23.1%) |
| 1 or 2 Children | 15 (65.2%) | 35 (36.5%) |
| 3 or 4 Children | 3 (50.0%) | 56 (81.2%) |
| 5 or more Children | 0 (0.0%) | 5 (100.0%) |
| Total | 18 (33.3%) | 111 (47.2%) |
Income Below Poverty Among Married-Couple vs Single-Parent Households in Commerce
The poverty data for Commerce shows that 44 of the married-couple family households (16.9%) and 129 of the single-parent households (44.6%) are living below the poverty level. Within the married-couple family households, those with 3 or 4 children have the highest poverty rate, with 11 households (29.7%) falling below the poverty line. Among the single-parent households, those with 5 or more children have the highest poverty rate, with 5 household (100.0%) living below poverty.
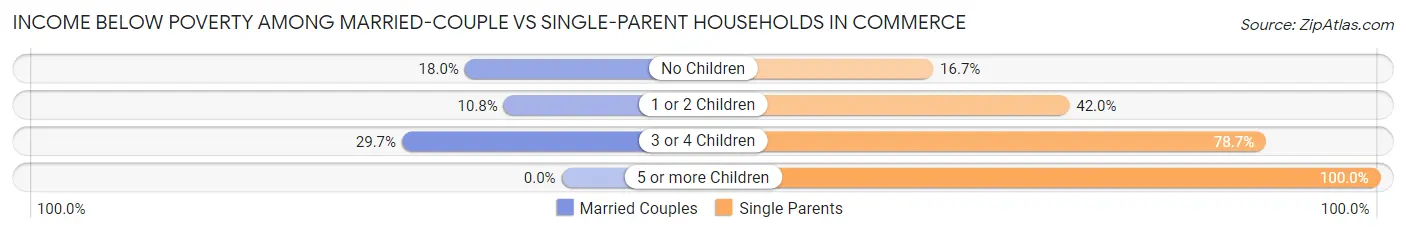
| Children | Married-Couple Families | Single-Parent Households |
| No Children | 22 (18.0%) | 15 (16.7%) |
| 1 or 2 Children | 11 (10.8%) | 50 (42.0%) |
| 3 or 4 Children | 11 (29.7%) | 59 (78.7%) |
| 5 or more Children | 0 (0.0%) | 5 (100.0%) |
| Total | 44 (16.9%) | 129 (44.6%) |
Race in Commerce
The most populous races in Commerce are White / Caucasian (1,283 | 55.7%), Hispanic or Latino (571 | 24.8%), and Native / Alaskan (383 | 16.6%).
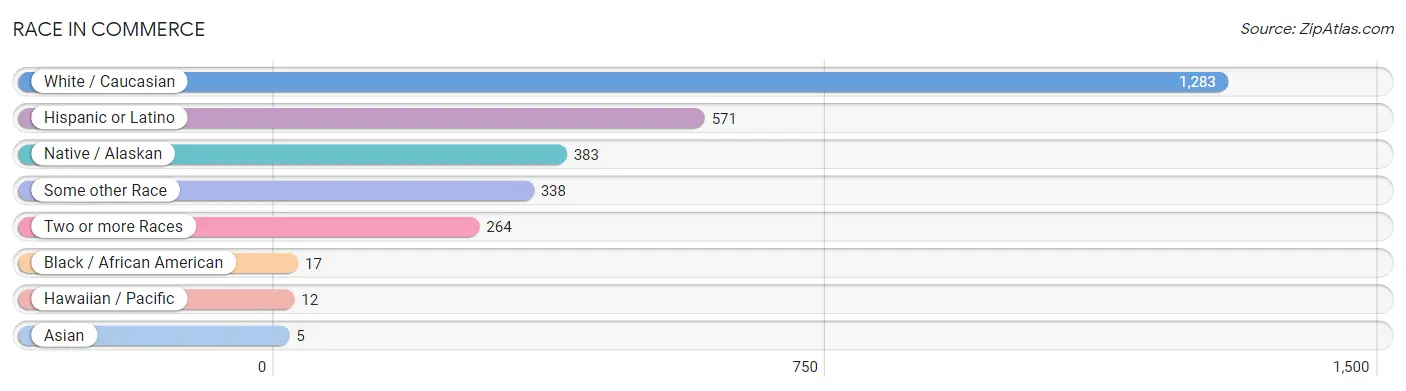
| Race | # Population | % Population |
| Asian | 5 | 0.2% |
| Black / African American | 17 | 0.7% |
| Hawaiian / Pacific | 12 | 0.5% |
| Hispanic or Latino | 571 | 24.8% |
| Native / Alaskan | 383 | 16.6% |
| White / Caucasian | 1,283 | 55.7% |
| Two or more Races | 264 | 11.5% |
| Some other Race | 338 | 14.7% |
| Total | 2,302 | 100.0% |
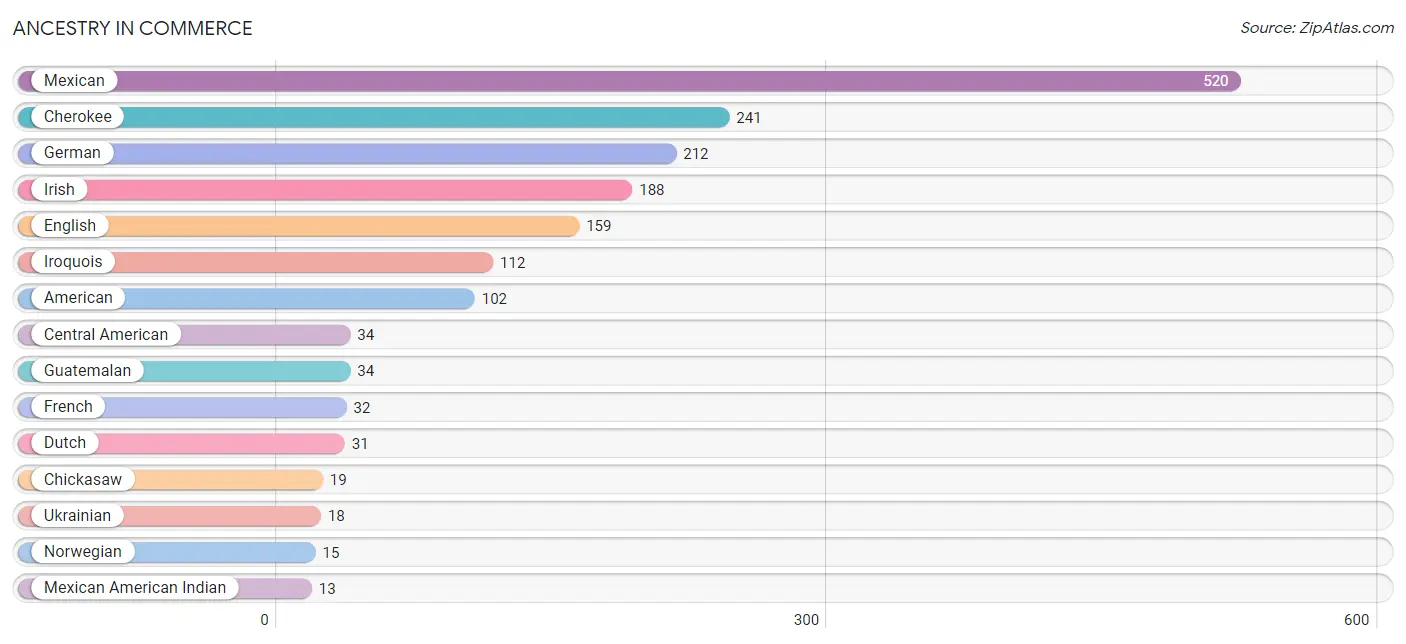
Ancestry in Commerce
The most populous ancestries reported in Commerce are Mexican (520 | 22.6%), Cherokee (241 | 10.5%), German (212 | 9.2%), Irish (188 | 8.2%), and English (159 | 6.9%), together accounting for 57.3% of all Commerce residents.
| Ancestry | # Population | % Population |
| American | 102 | 4.4% |
| Arab | 2 | 0.1% |
| British | 11 | 0.5% |
| Central American | 34 | 1.5% |
| Cherokee | 241 | 10.5% |
| Chickasaw | 19 | 0.8% |
| Choctaw | 11 | 0.5% |
| Creek | 12 | 0.5% |
| Dutch | 31 | 1.3% |
| Dutch West Indian | 7 | 0.3% |
| English | 159 | 6.9% |
| European | 7 | 0.3% |
| Finnish | 2 | 0.1% |
| French | 32 | 1.4% |
| French Canadian | 1 | 0.0% |
| German | 212 | 9.2% |
| Guatemalan | 34 | 1.5% |
| Irish | 188 | 8.2% |
| Iroquois | 112 | 4.9% |
| Korean | 11 | 0.5% |
| Mexican | 520 | 22.6% |
| Mexican American Indian | 13 | 0.6% |
| Native Hawaiian | 12 | 0.5% |
| Norwegian | 15 | 0.6% |
| Osage | 9 | 0.4% |
| Polish | 2 | 0.1% |
| Puerto Rican | 3 | 0.1% |
| Scotch-Irish | 4 | 0.2% |
| Scottish | 11 | 0.5% |
| Seminole | 2 | 0.1% |
| Spanish | 5 | 0.2% |
| Swedish | 5 | 0.2% |
| Syrian | 2 | 0.1% |
| Ukrainian | 18 | 0.8% |
| Welsh | 10 | 0.4% | View All 35 Rows |
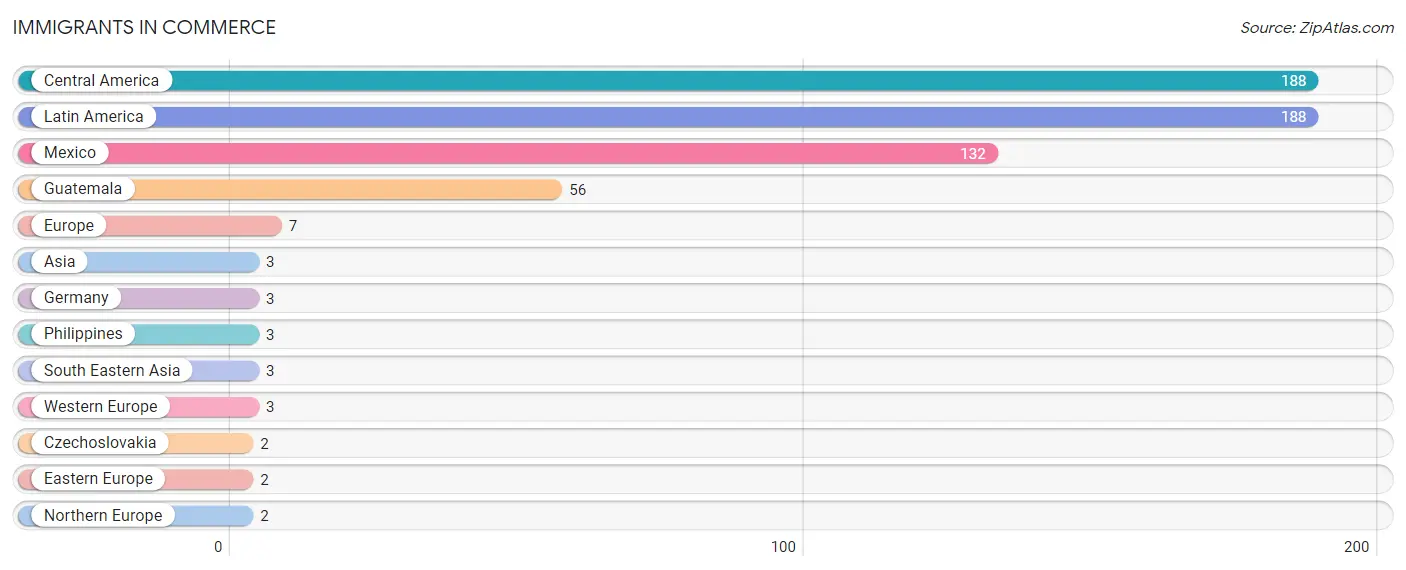
Immigrants in Commerce
The most numerous immigrant groups reported in Commerce came from Central America (188 | 8.2%), Latin America (188 | 8.2%), Mexico (132 | 5.7%), Guatemala (56 | 2.4%), and Europe (7 | 0.3%), together accounting for 24.8% of all Commerce residents.
| Immigration Origin | # Population | % Population |
| Asia | 3 | 0.1% |
| Central America | 188 | 8.2% |
| Czechoslovakia | 2 | 0.1% |
| Eastern Europe | 2 | 0.1% |
| Europe | 7 | 0.3% |
| Germany | 3 | 0.1% |
| Guatemala | 56 | 2.4% |
| Latin America | 188 | 8.2% |
| Mexico | 132 | 5.7% |
| Northern Europe | 2 | 0.1% |
| Philippines | 3 | 0.1% |
| South Eastern Asia | 3 | 0.1% |
| Western Europe | 3 | 0.1% | View All 13 Rows |
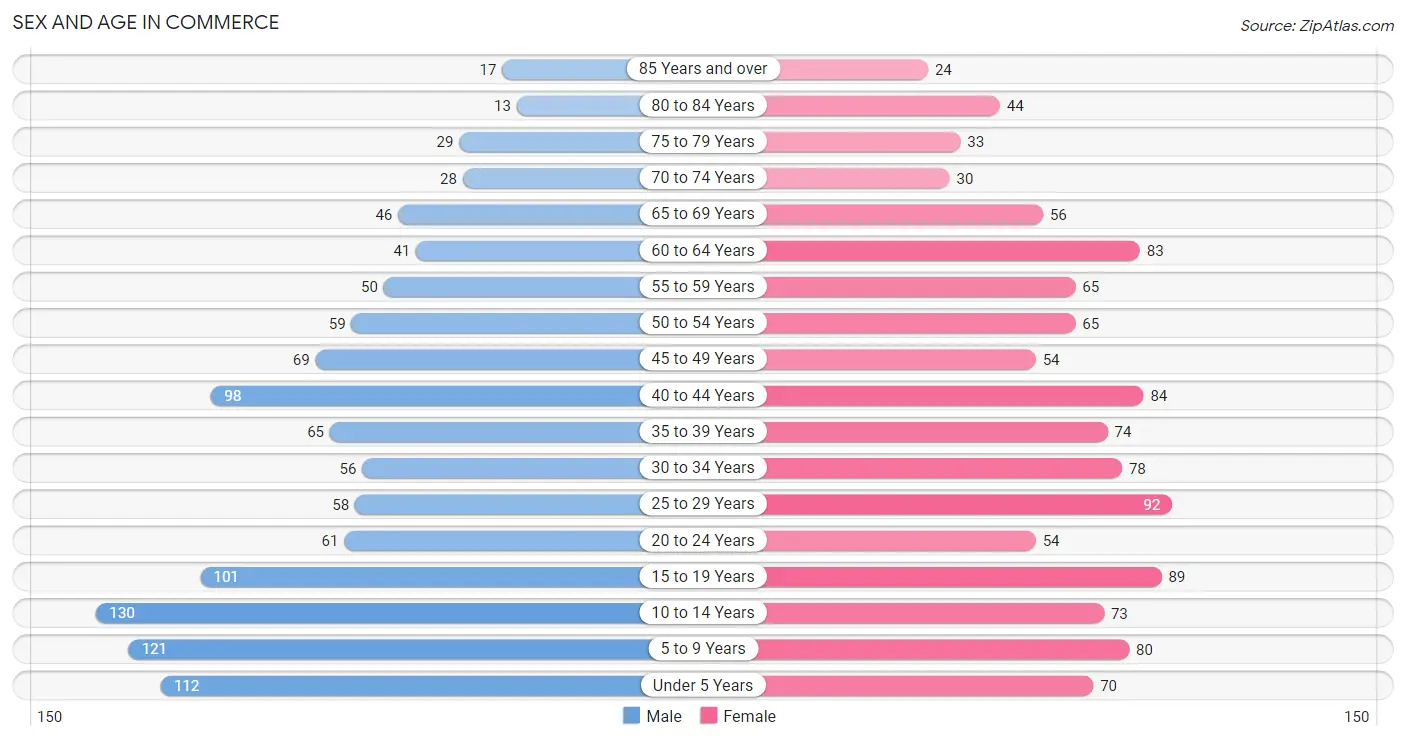
Sex and Age in Commerce
Sex and Age in Commerce
The most populous age groups in Commerce are 10 to 14 Years (130 | 11.3%) for men and 25 to 29 Years (92 | 8.0%) for women.
| Age Bracket | Male | Female |
| Under 5 Years | 112 (9.7%) | 70 (6.1%) |
| 5 to 9 Years | 121 (10.5%) | 80 (7.0%) |
| 10 to 14 Years | 130 (11.3%) | 73 (6.4%) |
| 15 to 19 Years | 101 (8.7%) | 89 (7.7%) |
| 20 to 24 Years | 61 (5.3%) | 54 (4.7%) |
| 25 to 29 Years | 58 (5.0%) | 92 (8.0%) |
| 30 to 34 Years | 56 (4.9%) | 78 (6.8%) |
| 35 to 39 Years | 65 (5.6%) | 74 (6.5%) |
| 40 to 44 Years | 98 (8.5%) | 84 (7.3%) |
| 45 to 49 Years | 69 (6.0%) | 54 (4.7%) |
| 50 to 54 Years | 59 (5.1%) | 65 (5.7%) |
| 55 to 59 Years | 50 (4.3%) | 65 (5.7%) |
| 60 to 64 Years | 41 (3.5%) | 83 (7.2%) |
| 65 to 69 Years | 46 (4.0%) | 56 (4.9%) |
| 70 to 74 Years | 28 (2.4%) | 30 (2.6%) |
| 75 to 79 Years | 29 (2.5%) | 33 (2.9%) |
| 80 to 84 Years | 13 (1.1%) | 44 (3.8%) |
| 85 Years and over | 17 (1.5%) | 24 (2.1%) |
| Total | 1,154 (100.0%) | 1,148 (100.0%) |
Families and Households in Commerce
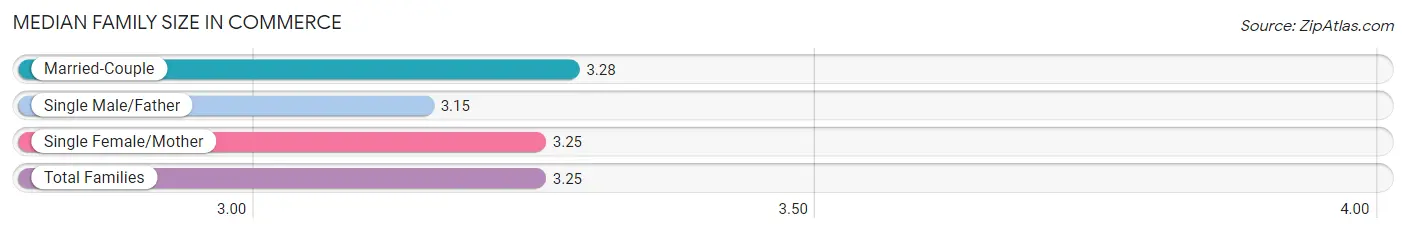
Median Family Size in Commerce
The median family size in Commerce is 3.25 persons per family, with married-couple families (261 | 47.4%) accounting for the largest median family size of 3.28 persons per family. On the other hand, single male/father families (54 | 9.8%) represent the smallest median family size with 3.15 persons per family.
| Family Type | # Families | Family Size |
| Married-Couple | 261 (47.4%) | 3.28 |
| Single Male/Father | 54 (9.8%) | 3.15 |
| Single Female/Mother | 235 (42.7%) | 3.25 |
| Total Families | 550 (100.0%) | 3.25 |
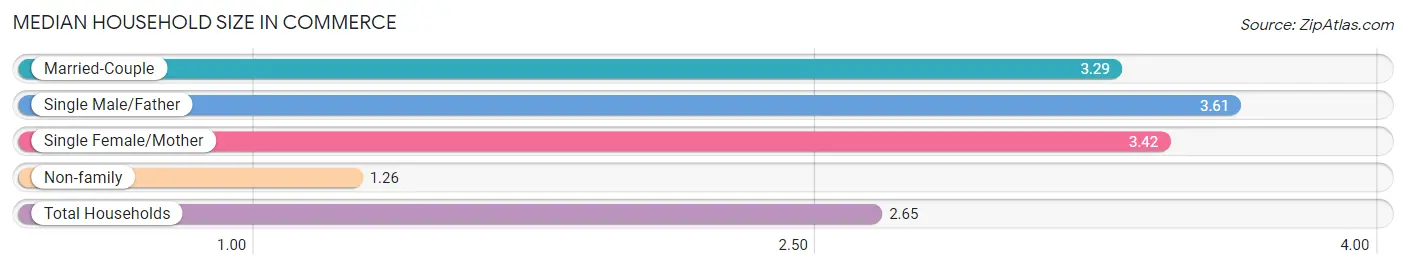
Median Household Size in Commerce
The median household size in Commerce is 2.65 persons per household, with single male/father households (54 | 6.5%) accounting for the largest median household size of 3.61 persons per household. non-family households (287 | 34.3%) represent the smallest median household size with 1.26 persons per household.
| Household Type | # Households | Household Size |
| Married-Couple | 261 (31.2%) | 3.29 |
| Single Male/Father | 54 (6.5%) | 3.61 |
| Single Female/Mother | 235 (28.1%) | 3.42 |
| Non-family | 287 (34.3%) | 1.26 |
| Total Households | 837 (100.0%) | 2.65 |
Household Size by Marriage Status in Commerce
Out of a total of 837 households in Commerce, 550 (65.7%) are family households, while 287 (34.3%) are nonfamily households. The most numerous type of family households are 2-person households, comprising 205, and the most common type of nonfamily households are 1-person households, comprising 240.
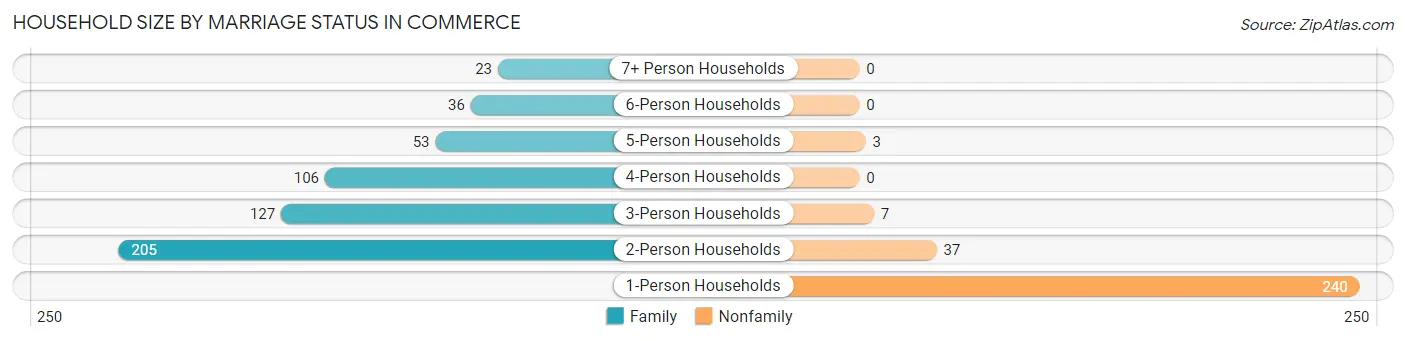
| Household Size | Family Households | Nonfamily Households |
| 1-Person Households | - | 240 (28.7%) |
| 2-Person Households | 205 (24.5%) | 37 (4.4%) |
| 3-Person Households | 127 (15.2%) | 7 (0.8%) |
| 4-Person Households | 106 (12.7%) | 0 (0.0%) |
| 5-Person Households | 53 (6.3%) | 3 (0.4%) |
| 6-Person Households | 36 (4.3%) | 0 (0.0%) |
| 7+ Person Households | 23 (2.8%) | 0 (0.0%) |
| Total | 550 (65.7%) | 287 (34.3%) |
Female Fertility in Commerce
Fertility by Age in Commerce
Average fertility rate in Commerce is 50.0 births per 1,000 women. Women in the age bracket of 20 to 34 years have the highest fertility rate with 121.0 births per 1,000 women. Women in the age bracket of 20 to 34 years acount for 100.0% of all women with births.
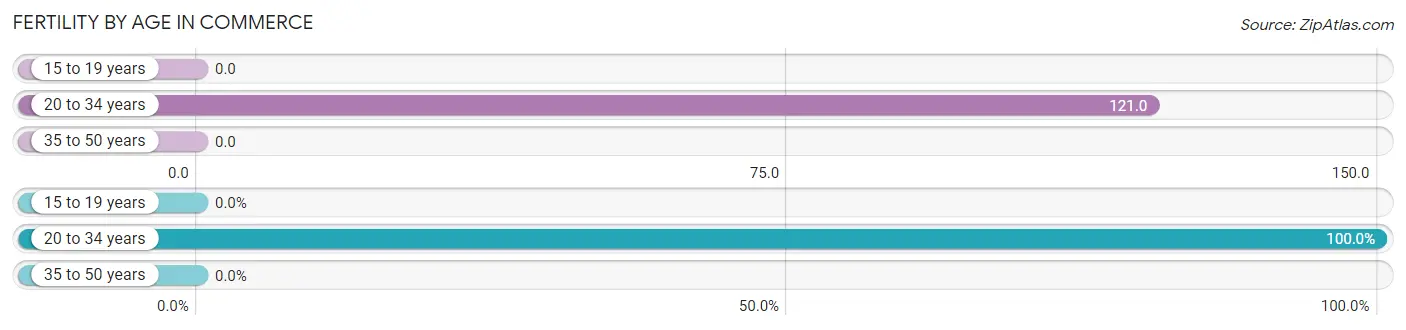
| Age Bracket | Women with Births | Births / 1,000 Women |
| 15 to 19 years | 0 (0.0%) | 0.0 |
| 20 to 34 years | 27 (100.0%) | 121.0 |
| 35 to 50 years | 0 (0.0%) | 0.0 |
| Total | 27 (100.0%) | 50.0 |
Fertility by Age by Marriage Status in Commerce
48.1% of women with births (27) in Commerce are married. The highest percentage of unmarried women with births falls into 20 to 34 years age bracket with 51.8% of them unmarried at the time of birth, while the lowest percentage of unmarried women with births belong to 20 to 34 years age bracket with 51.8% of them unmarried.
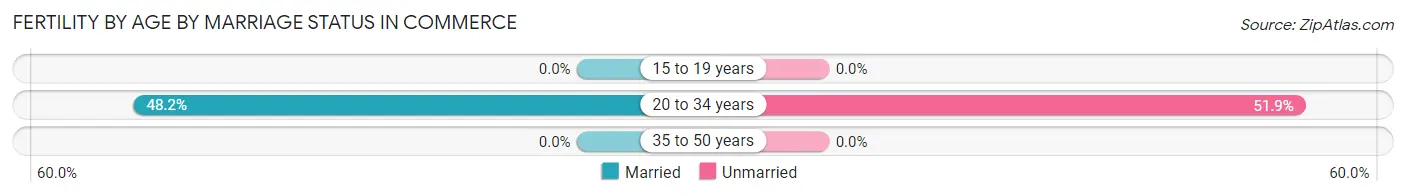
| Age Bracket | Married | Unmarried |
| 15 to 19 years | 0 (0.0%) | 0 (0.0%) |
| 20 to 34 years | 13 (48.1%) | 14 (51.8%) |
| 35 to 50 years | 0 (0.0%) | 0 (0.0%) |
| Total | 13 (48.1%) | 14 (51.8%) |
Fertility by Education in Commerce
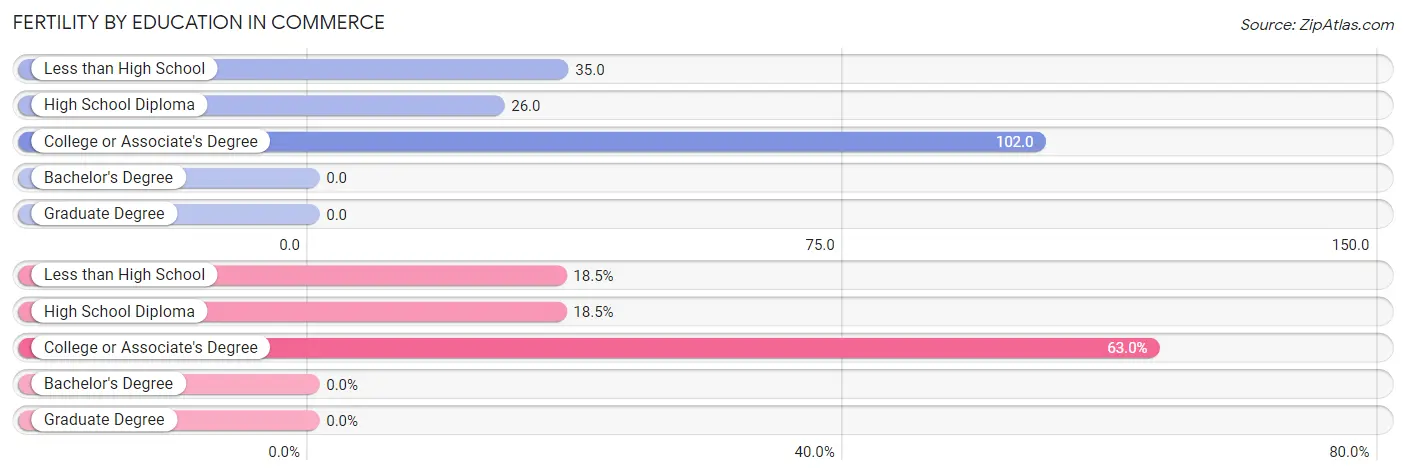
| Educational Attainment | Women with Births | Births / 1,000 Women |
| Less than High School | 5 (18.5%) | 35.0 |
| High School Diploma | 5 (18.5%) | 26.0 |
| College or Associate's Degree | 17 (63.0%) | 102.0 |
| Bachelor's Degree | 0 (0.0%) | 0.0 |
| Graduate Degree | 0 (0.0%) | 0.0 |
| Total | 27 (100.0%) | 50.0 |
Fertility by Education by Marriage Status in Commerce
51.8% of women with births in Commerce are unmarried. Women with the educational attainment of less than high school are most likely to be married with 100.0% of them married at childbirth, while women with the educational attainment of college or associate's degree are least likely to be married with 70.6% of them unmarried at childbirth.
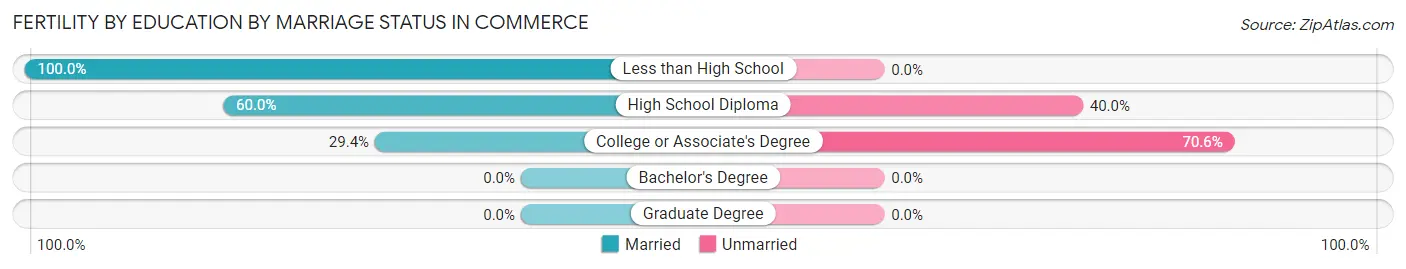
| Educational Attainment | Married | Unmarried |
| Less than High School | 5 (100.0%) | 0 (0.0%) |
| High School Diploma | 3 (60.0%) | 2 (40.0%) |
| College or Associate's Degree | 5 (29.4%) | 12 (70.6%) |
| Bachelor's Degree | 0 (0.0%) | 0 (0.0%) |
| Graduate Degree | 0 (0.0%) | 0 (0.0%) |
| Total | 13 (48.1%) | 14 (51.8%) |
Employment Characteristics in Commerce
Employment by Class of Employer in Commerce
Among the 867 employed individuals in Commerce, private company employees (627 | 72.3%), not-for-profit organizations (59 | 6.8%), and federal government employees (47 | 5.4%) make up the most common classes of employment.
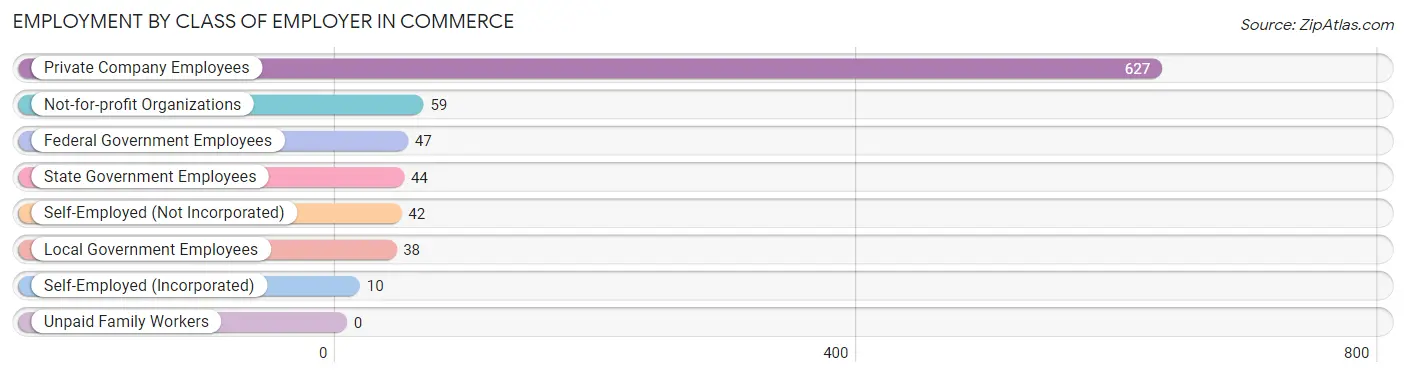
| Employer Class | # Employees | % Employees |
| Private Company Employees | 627 | 72.3% |
| Self-Employed (Incorporated) | 10 | 1.1% |
| Self-Employed (Not Incorporated) | 42 | 4.8% |
| Not-for-profit Organizations | 59 | 6.8% |
| Local Government Employees | 38 | 4.4% |
| State Government Employees | 44 | 5.1% |
| Federal Government Employees | 47 | 5.4% |
| Unpaid Family Workers | 0 | 0.0% |
| Total | 867 | 100.0% |
Employment Status by Age in Commerce
According to the labor force statistics for Commerce, out of the total population over 16 years of age (1,681), 55.7% or 936 individuals are in the labor force, with 4.0% or 37 of them unemployed. The age group with the highest labor force participation rate is 35 to 44 years, with 80.1% or 257 individuals in the labor force. Within the labor force, the 16 to 19 years age range has the highest percentage of unemployed individuals, with 14.3% or 8 of them being unemployed.
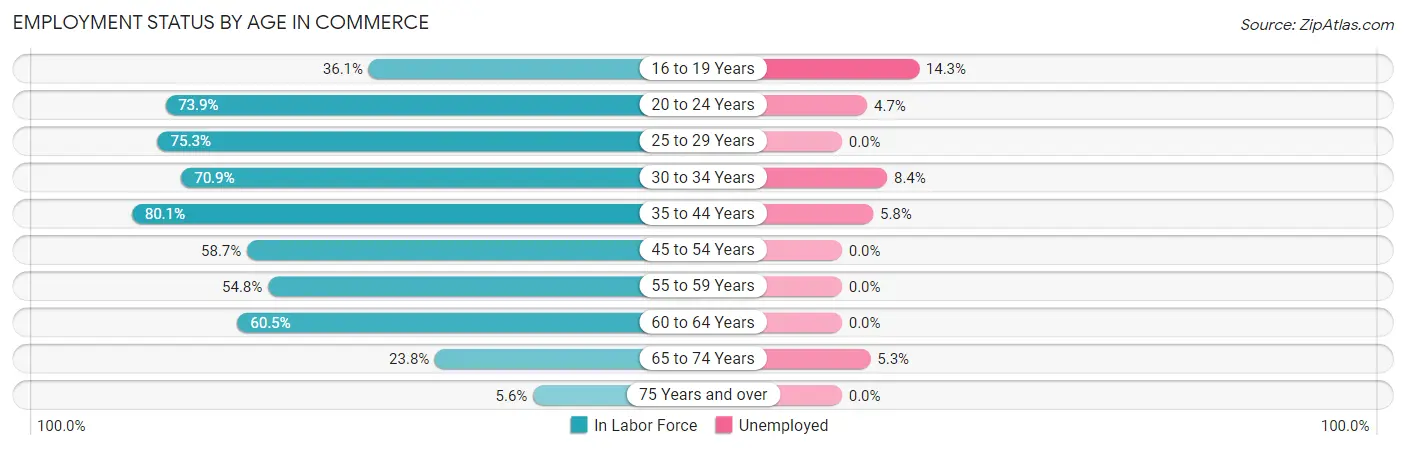
| Age Bracket | In Labor Force | Unemployed |
| 16 to 19 Years | 56 (36.1%) | 8 (14.3%) |
| 20 to 24 Years | 85 (73.9%) | 4 (4.7%) |
| 25 to 29 Years | 113 (75.3%) | 0 (0.0%) |
| 30 to 34 Years | 95 (70.9%) | 8 (8.4%) |
| 35 to 44 Years | 257 (80.1%) | 15 (5.8%) |
| 45 to 54 Years | 145 (58.7%) | 0 (0.0%) |
| 55 to 59 Years | 63 (54.8%) | 0 (0.0%) |
| 60 to 64 Years | 75 (60.5%) | 0 (0.0%) |
| 65 to 74 Years | 38 (23.8%) | 2 (5.3%) |
| 75 Years and over | 9 (5.6%) | 0 (0.0%) |
| Total | 936 (55.7%) | 37 (4.0%) |
Employment Status by Educational Attainment in Commerce
According to labor force statistics for Commerce, 68.6% of individuals (748) out of the total population between 25 and 64 years of age (1,091) are in the labor force, with 3.1% or 23 of them being unemployed. The group with the highest labor force participation rate are those with the educational attainment of bachelor's degree or higher, with 76.4% or 68 individuals in the labor force. Within the labor force, individuals with bachelor's degree or higher education have the highest percentage of unemployment, with 8.8% or 6 of them being unemployed.
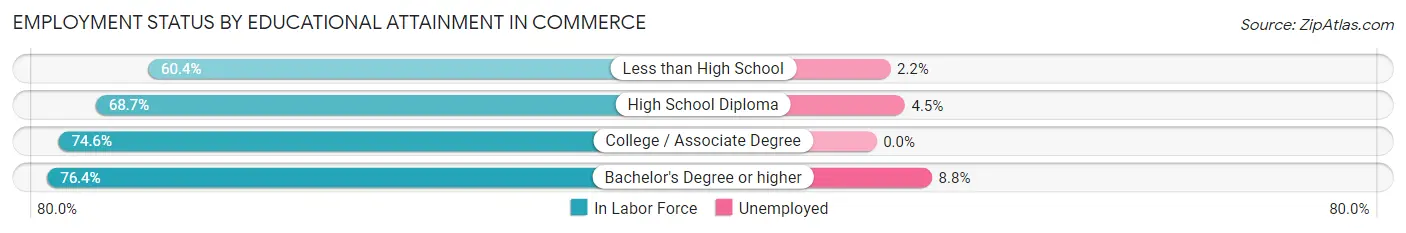
| Educational Attainment | In Labor Force | Unemployed |
| Less than High School | 183 (60.4%) | 7 (2.2%) |
| High School Diploma | 288 (68.7%) | 19 (4.5%) |
| College / Associate Degree | 209 (74.6%) | 0 (0.0%) |
| Bachelor's Degree or higher | 68 (76.4%) | 8 (8.8%) |
| Total | 748 (68.6%) | 34 (3.1%) |
Employment Occupations by Sex in Commerce
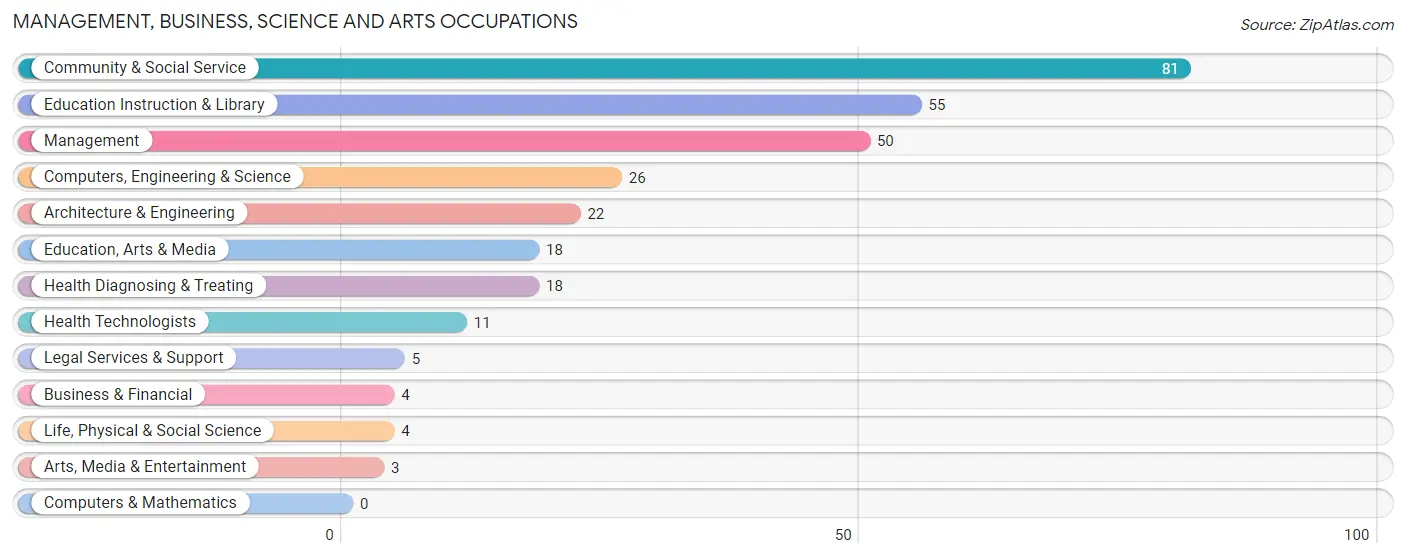
Management, Business, Science and Arts Occupations
The most common Management, Business, Science and Arts occupations in Commerce are Community & Social Service (81 | 9.0%), Education Instruction & Library (55 | 6.1%), Management (50 | 5.6%), Computers, Engineering & Science (26 | 2.9%), and Architecture & Engineering (22 | 2.5%).
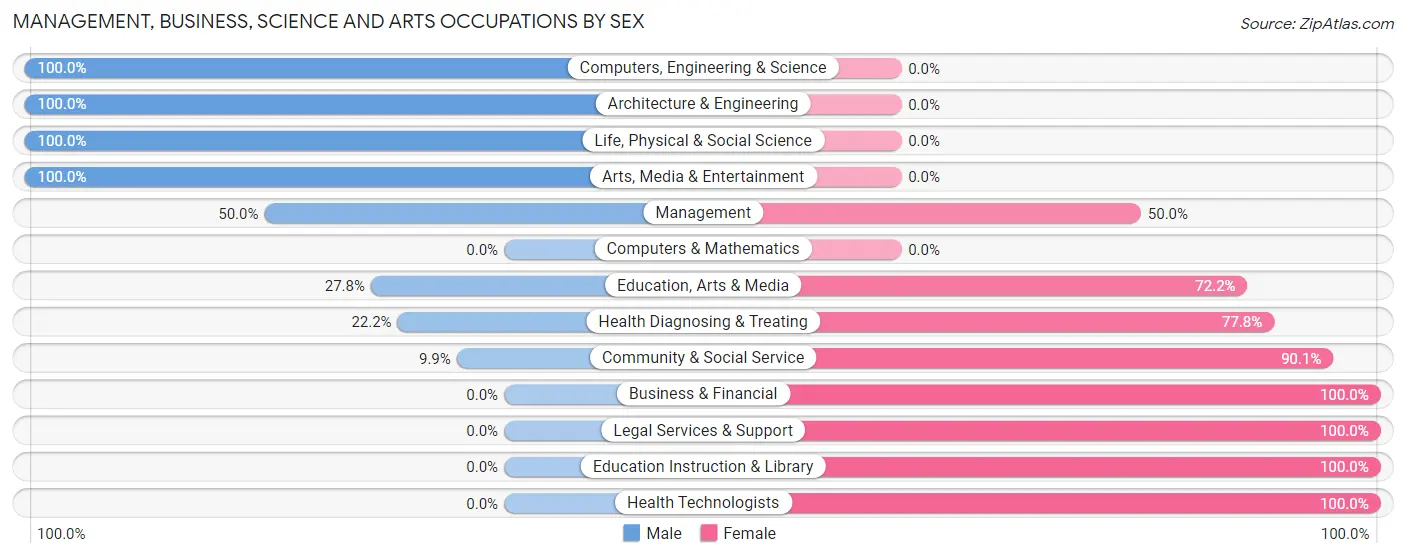
Management, Business, Science and Arts Occupations by Sex
Within the Management, Business, Science and Arts occupations in Commerce, the most male-oriented occupations are Computers, Engineering & Science (100.0%), Architecture & Engineering (100.0%), and Life, Physical & Social Science (100.0%), while the most female-oriented occupations are Business & Financial (100.0%), Legal Services & Support (100.0%), and Education Instruction & Library (100.0%).
| Occupation | Male | Female |
| Management | 25 (50.0%) | 25 (50.0%) |
| Business & Financial | 0 (0.0%) | 4 (100.0%) |
| Computers, Engineering & Science | 26 (100.0%) | 0 (0.0%) |
| Computers & Mathematics | 0 (0.0%) | 0 (0.0%) |
| Architecture & Engineering | 22 (100.0%) | 0 (0.0%) |
| Life, Physical & Social Science | 4 (100.0%) | 0 (0.0%) |
| Community & Social Service | 8 (9.9%) | 73 (90.1%) |
| Education, Arts & Media | 5 (27.8%) | 13 (72.2%) |
| Legal Services & Support | 0 (0.0%) | 5 (100.0%) |
| Education Instruction & Library | 0 (0.0%) | 55 (100.0%) |
| Arts, Media & Entertainment | 3 (100.0%) | 0 (0.0%) |
| Health Diagnosing & Treating | 4 (22.2%) | 14 (77.8%) |
| Health Technologists | 0 (0.0%) | 11 (100.0%) |
| Total (Category) | 63 (35.2%) | 116 (64.8%) |
| Total (Overall) | 420 (46.7%) | 479 (53.3%) |
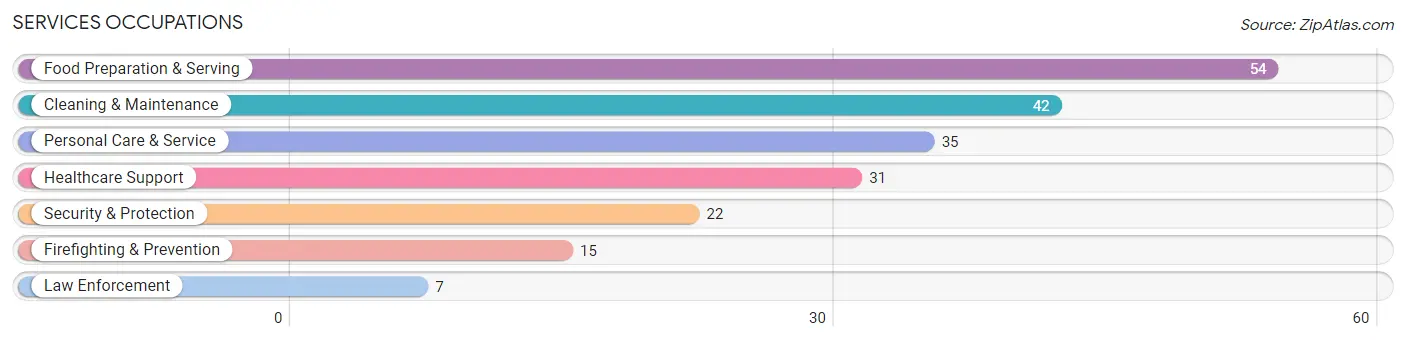
Services Occupations
The most common Services occupations in Commerce are Food Preparation & Serving (54 | 6.0%), Cleaning & Maintenance (42 | 4.7%), Personal Care & Service (35 | 3.9%), Healthcare Support (31 | 3.5%), and Security & Protection (22 | 2.5%).
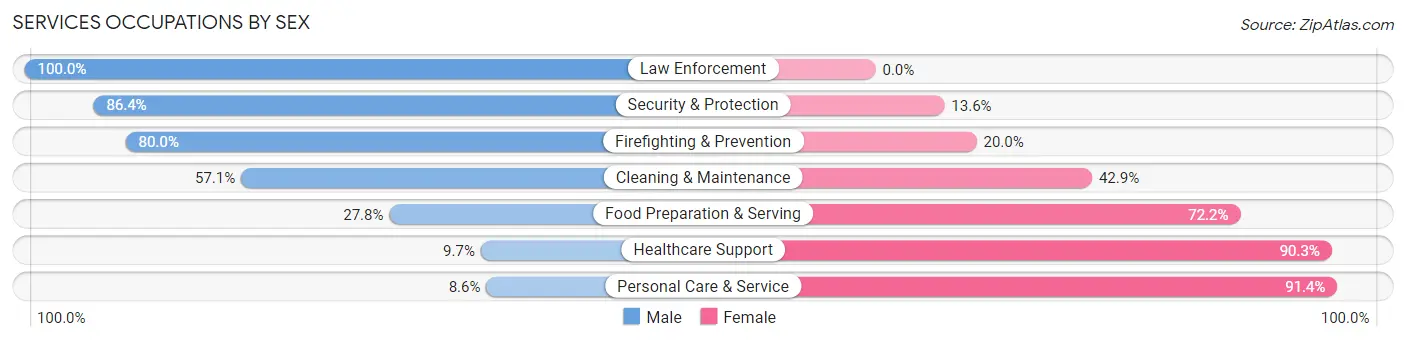
Services Occupations by Sex
Within the Services occupations in Commerce, the most male-oriented occupations are Law Enforcement (100.0%), Security & Protection (86.4%), and Firefighting & Prevention (80.0%), while the most female-oriented occupations are Personal Care & Service (91.4%), Healthcare Support (90.3%), and Food Preparation & Serving (72.2%).
| Occupation | Male | Female |
| Healthcare Support | 3 (9.7%) | 28 (90.3%) |
| Security & Protection | 19 (86.4%) | 3 (13.6%) |
| Firefighting & Prevention | 12 (80.0%) | 3 (20.0%) |
| Law Enforcement | 7 (100.0%) | 0 (0.0%) |
| Food Preparation & Serving | 15 (27.8%) | 39 (72.2%) |
| Cleaning & Maintenance | 24 (57.1%) | 18 (42.9%) |
| Personal Care & Service | 3 (8.6%) | 32 (91.4%) |
| Total (Category) | 64 (34.8%) | 120 (65.2%) |
| Total (Overall) | 420 (46.7%) | 479 (53.3%) |
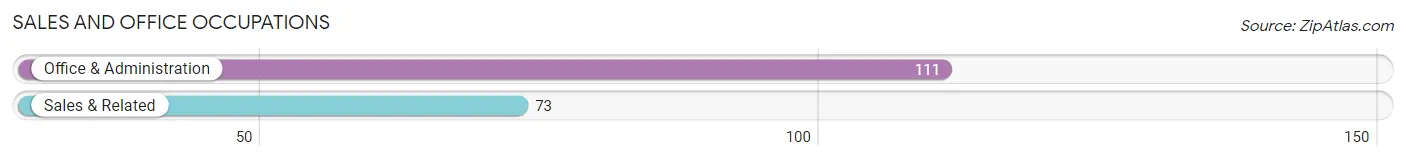
Sales and Office Occupations
The most common Sales and Office occupations in Commerce are Office & Administration (111 | 12.3%), and Sales & Related (73 | 8.1%).
Sales and Office Occupations by Sex
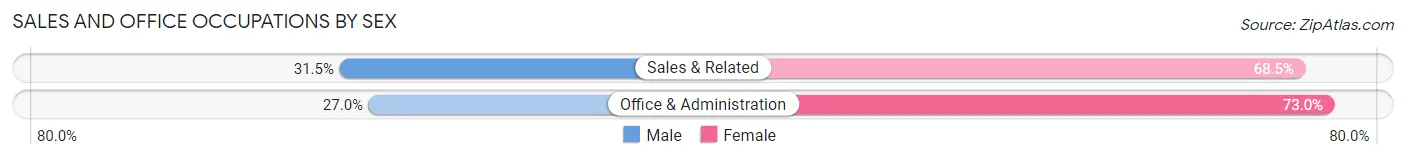
| Occupation | Male | Female |
| Sales & Related | 23 (31.5%) | 50 (68.5%) |
| Office & Administration | 30 (27.0%) | 81 (73.0%) |
| Total (Category) | 53 (28.8%) | 131 (71.2%) |
| Total (Overall) | 420 (46.7%) | 479 (53.3%) |
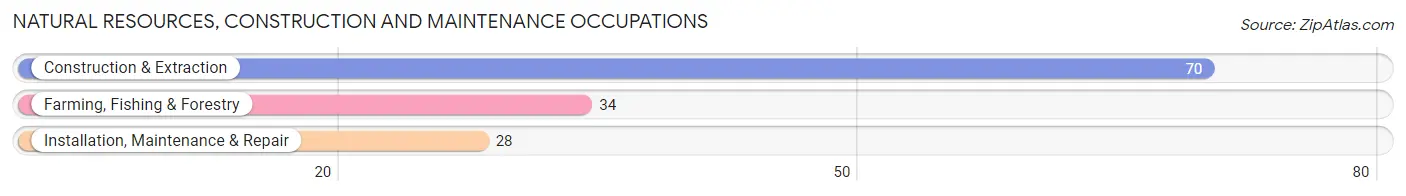
Natural Resources, Construction and Maintenance Occupations
The most common Natural Resources, Construction and Maintenance occupations in Commerce are Construction & Extraction (70 | 7.8%), Farming, Fishing & Forestry (34 | 3.8%), and Installation, Maintenance & Repair (28 | 3.1%).
Natural Resources, Construction and Maintenance Occupations by Sex
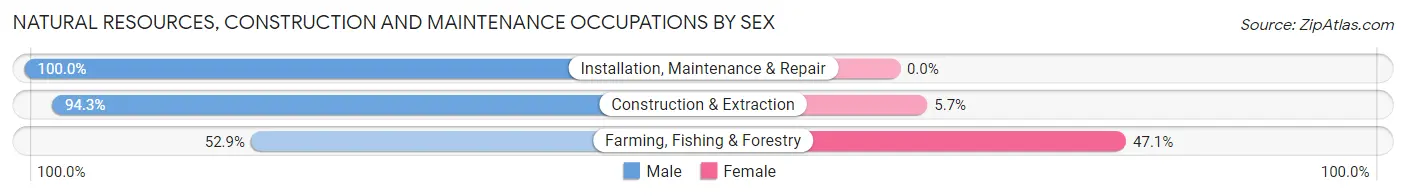
| Occupation | Male | Female |
| Farming, Fishing & Forestry | 18 (52.9%) | 16 (47.1%) |
| Construction & Extraction | 66 (94.3%) | 4 (5.7%) |
| Installation, Maintenance & Repair | 28 (100.0%) | 0 (0.0%) |
| Total (Category) | 112 (84.9%) | 20 (15.1%) |
| Total (Overall) | 420 (46.7%) | 479 (53.3%) |
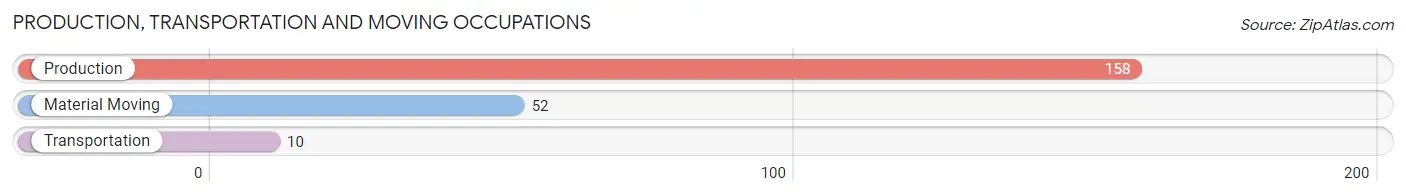
Production, Transportation and Moving Occupations
The most common Production, Transportation and Moving occupations in Commerce are Production (158 | 17.6%), Material Moving (52 | 5.8%), and Transportation (10 | 1.1%).
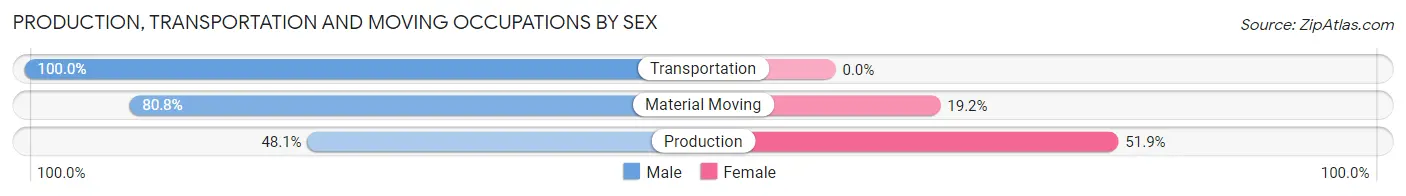
Production, Transportation and Moving Occupations by Sex
| Occupation | Male | Female |
| Production | 76 (48.1%) | 82 (51.9%) |
| Transportation | 10 (100.0%) | 0 (0.0%) |
| Material Moving | 42 (80.8%) | 10 (19.2%) |
| Total (Category) | 128 (58.2%) | 92 (41.8%) |
| Total (Overall) | 420 (46.7%) | 479 (53.3%) |
Employment Industries by Sex in Commerce
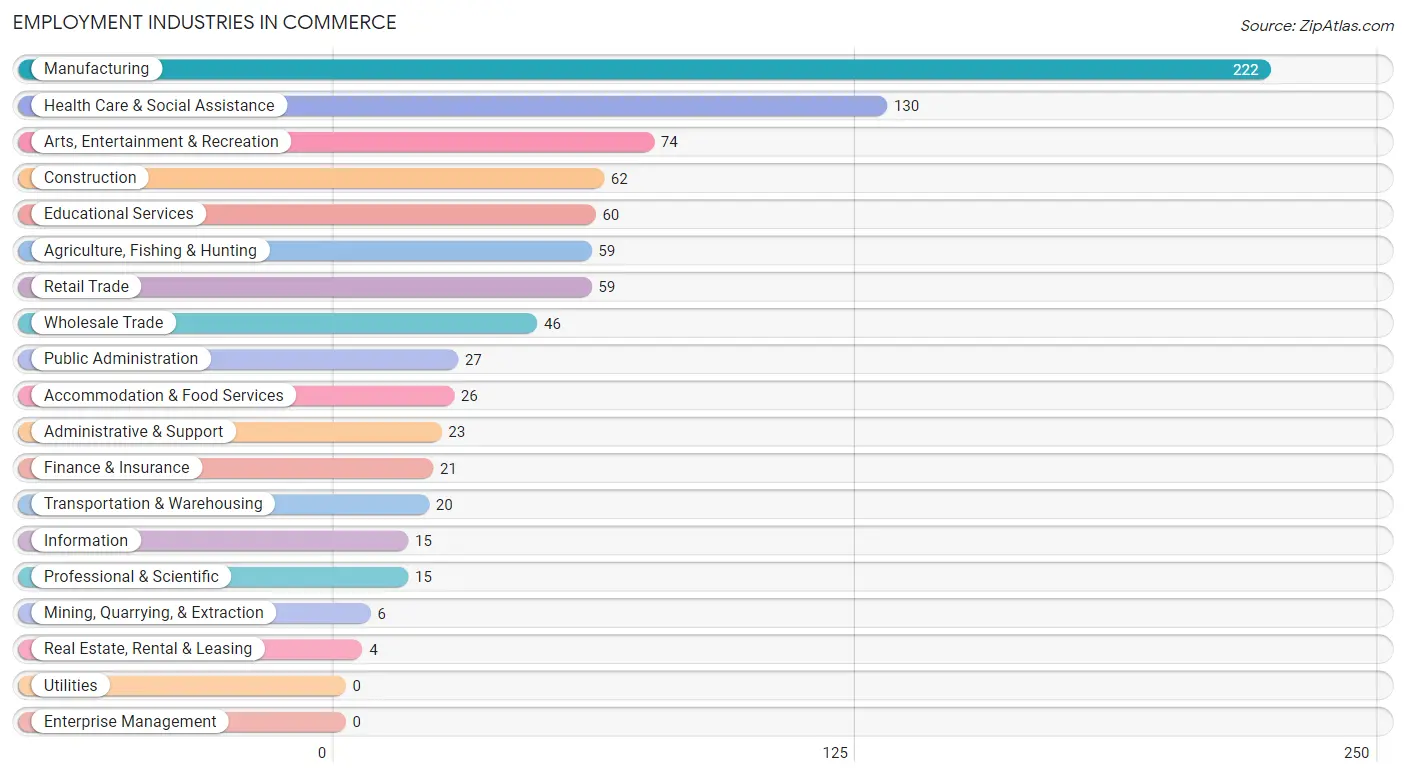
Employment Industries in Commerce
The major employment industries in Commerce include Manufacturing (222 | 24.7%), Health Care & Social Assistance (130 | 14.5%), Arts, Entertainment & Recreation (74 | 8.2%), Construction (62 | 6.9%), and Educational Services (60 | 6.7%).
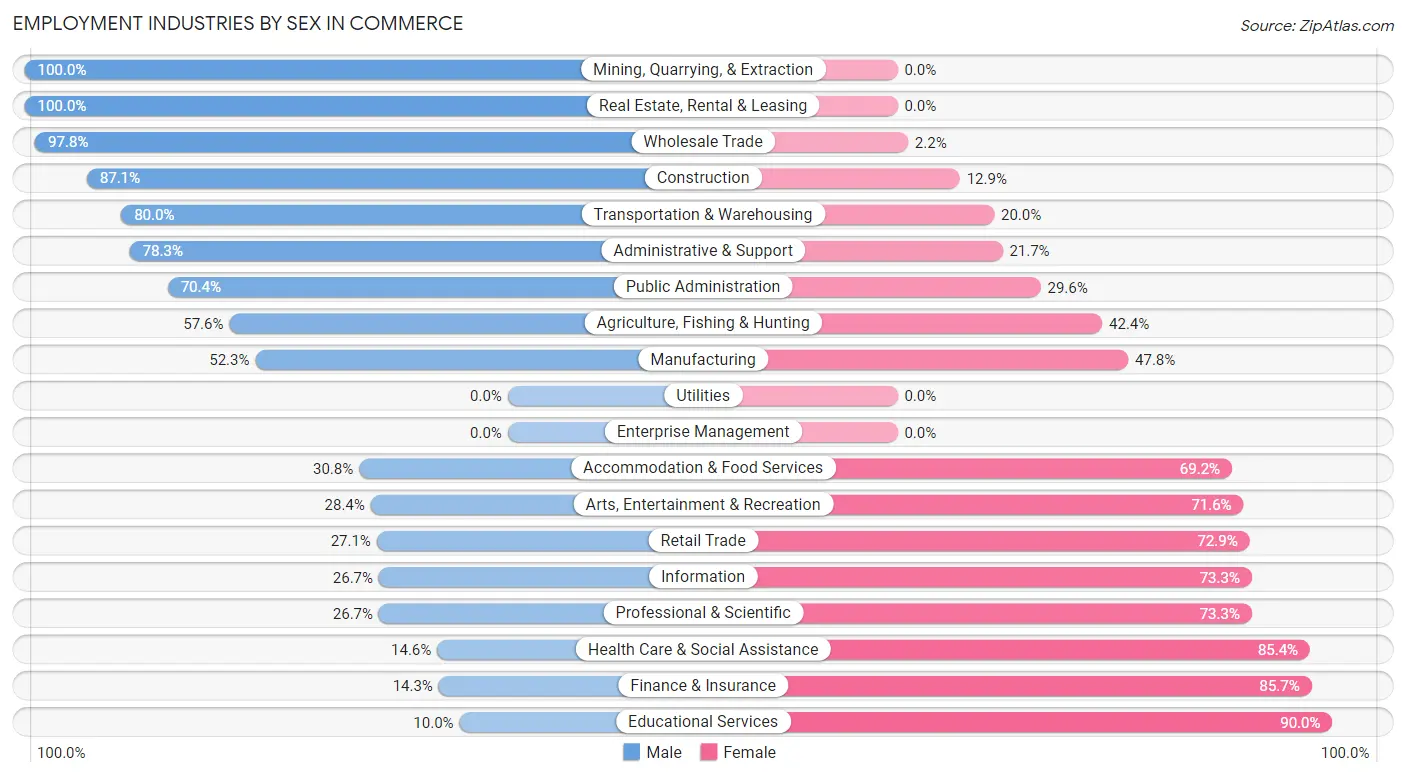
Employment Industries by Sex in Commerce
The Commerce industries that see more men than women are Mining, Quarrying, & Extraction (100.0%), Real Estate, Rental & Leasing (100.0%), and Wholesale Trade (97.8%), whereas the industries that tend to have a higher number of women are Educational Services (90.0%), Finance & Insurance (85.7%), and Health Care & Social Assistance (85.4%).
| Industry | Male | Female |
| Agriculture, Fishing & Hunting | 34 (57.6%) | 25 (42.4%) |
| Mining, Quarrying, & Extraction | 6 (100.0%) | 0 (0.0%) |
| Construction | 54 (87.1%) | 8 (12.9%) |
| Manufacturing | 116 (52.2%) | 106 (47.7%) |
| Wholesale Trade | 45 (97.8%) | 1 (2.2%) |
| Retail Trade | 16 (27.1%) | 43 (72.9%) |
| Transportation & Warehousing | 16 (80.0%) | 4 (20.0%) |
| Utilities | 0 (0.0%) | 0 (0.0%) |
| Information | 4 (26.7%) | 11 (73.3%) |
| Finance & Insurance | 3 (14.3%) | 18 (85.7%) |
| Real Estate, Rental & Leasing | 4 (100.0%) | 0 (0.0%) |
| Professional & Scientific | 4 (26.7%) | 11 (73.3%) |
| Enterprise Management | 0 (0.0%) | 0 (0.0%) |
| Administrative & Support | 18 (78.3%) | 5 (21.7%) |
| Educational Services | 6 (10.0%) | 54 (90.0%) |
| Health Care & Social Assistance | 19 (14.6%) | 111 (85.4%) |
| Arts, Entertainment & Recreation | 21 (28.4%) | 53 (71.6%) |
| Accommodation & Food Services | 8 (30.8%) | 18 (69.2%) |
| Public Administration | 19 (70.4%) | 8 (29.6%) |
| Total | 420 (46.7%) | 479 (53.3%) |
Education in Commerce
School Enrollment in Commerce
The most common levels of schooling among the 640 students in Commerce are middle school (181 | 28.3%), high school (137 | 21.4%), and elementary school (135 | 21.1%).
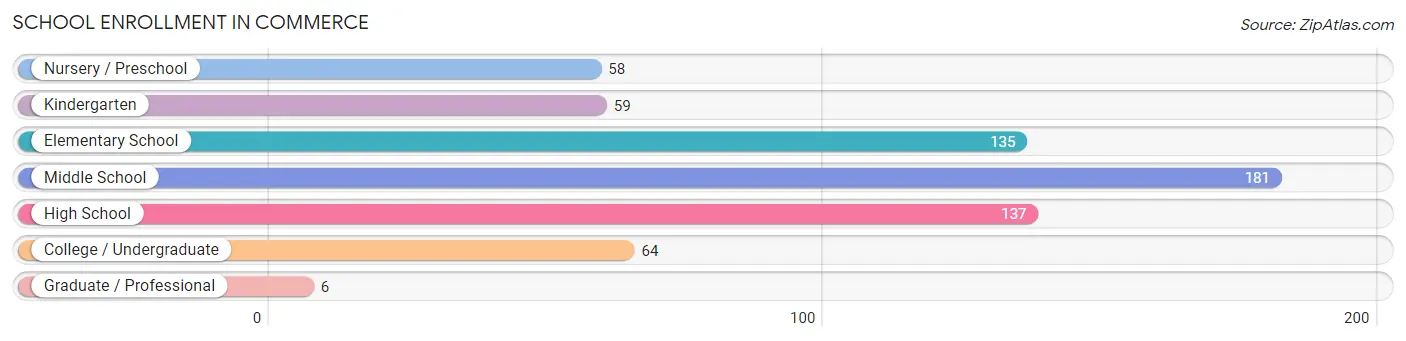
| School Level | # Students | % Students |
| Nursery / Preschool | 58 | 9.1% |
| Kindergarten | 59 | 9.2% |
| Elementary School | 135 | 21.1% |
| Middle School | 181 | 28.3% |
| High School | 137 | 21.4% |
| College / Undergraduate | 64 | 10.0% |
| Graduate / Professional | 6 | 0.9% |
| Total | 640 | 100.0% |
School Enrollment by Age by Funding Source in Commerce
Out of a total of 640 students who are enrolled in schools in Commerce, 19 (3.0%) attend a private institution, while the remaining 621 (97.0%) are enrolled in public schools. The age group of 35 years and over has the highest likelihood of being enrolled in private schools, with 5 (18.5% in the age bracket) enrolled. Conversely, the age group of 3 to 4 year olds has the lowest likelihood of being enrolled in a private school, with 39 (100.0% in the age bracket) attending a public institution.
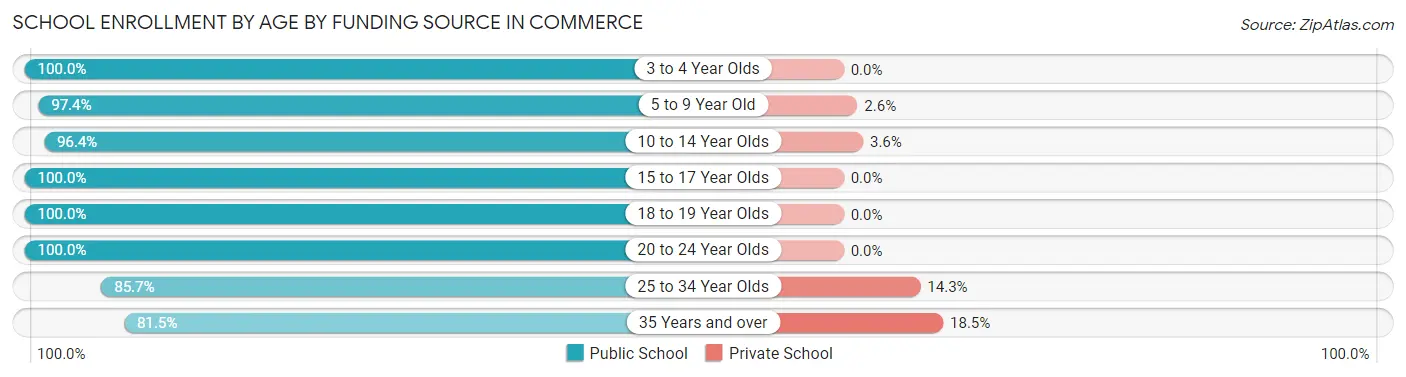
| Age Bracket | Public School | Private School |
| 3 to 4 Year Olds | 39 (100.0%) | 0 (0.0%) |
| 5 to 9 Year Old | 190 (97.4%) | 5 (2.6%) |
| 10 to 14 Year Olds | 187 (96.4%) | 7 (3.6%) |
| 15 to 17 Year Olds | 112 (100.0%) | 0 (0.0%) |
| 18 to 19 Year Olds | 33 (100.0%) | 0 (0.0%) |
| 20 to 24 Year Olds | 26 (100.0%) | 0 (0.0%) |
| 25 to 34 Year Olds | 12 (85.7%) | 2 (14.3%) |
| 35 Years and over | 22 (81.5%) | 5 (18.5%) |
| Total | 621 (97.0%) | 19 (3.0%) |
Educational Attainment by Field of Study in Commerce
Education (39 | 28.5%), psychology (23 | 16.8%), science & technology (18 | 13.1%), arts & humanities (18 | 13.1%), and liberal arts & history (10 | 7.3%) are the most common fields of study among 137 individuals in Commerce who have obtained a bachelor's degree or higher.
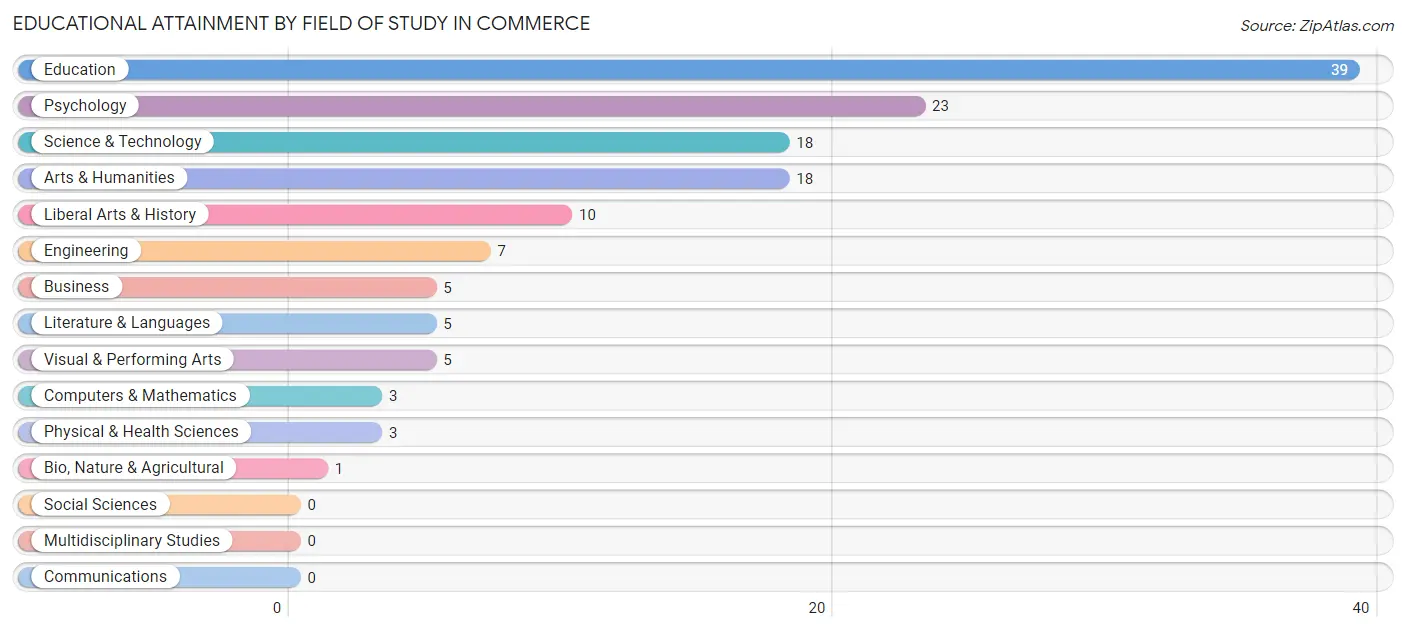
| Field of Study | # Graduates | % Graduates |
| Computers & Mathematics | 3 | 2.2% |
| Bio, Nature & Agricultural | 1 | 0.7% |
| Physical & Health Sciences | 3 | 2.2% |
| Psychology | 23 | 16.8% |
| Social Sciences | 0 | 0.0% |
| Engineering | 7 | 5.1% |
| Multidisciplinary Studies | 0 | 0.0% |
| Science & Technology | 18 | 13.1% |
| Business | 5 | 3.6% |
| Education | 39 | 28.5% |
| Literature & Languages | 5 | 3.6% |
| Liberal Arts & History | 10 | 7.3% |
| Visual & Performing Arts | 5 | 3.6% |
| Communications | 0 | 0.0% |
| Arts & Humanities | 18 | 13.1% |
| Total | 137 | 100.0% |
Transportation & Commute in Commerce
Vehicle Availability by Sex in Commerce
The most prevalent vehicle ownership categories in Commerce are males with 2 vehicles (178, accounting for 43.4%) and females with 2 vehicles (183, making up 39.4%).
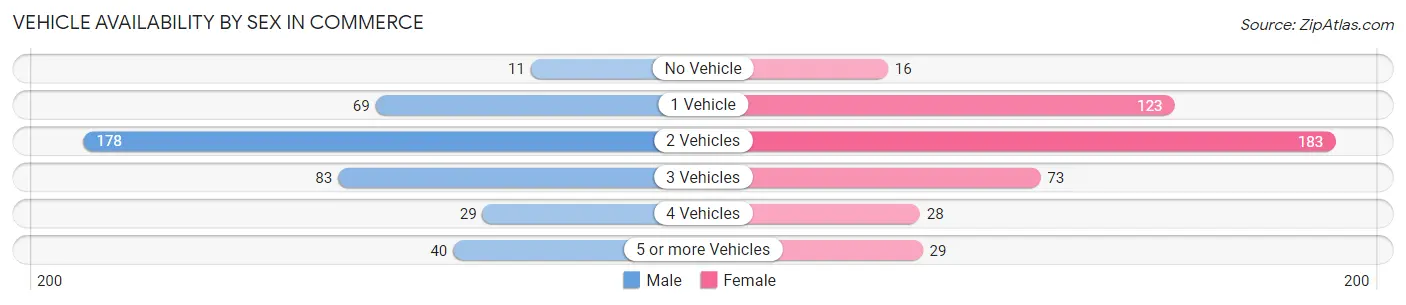
| Vehicles Available | Male | Female |
| No Vehicle | 11 (2.7%) | 16 (3.5%) |
| 1 Vehicle | 69 (16.8%) | 123 (27.2%) |
| 2 Vehicles | 178 (43.4%) | 183 (40.5%) |
| 3 Vehicles | 83 (20.2%) | 73 (16.2%) |
| 4 Vehicles | 29 (7.1%) | 28 (6.2%) |
| 5 or more Vehicles | 40 (9.8%) | 29 (6.4%) |
| Total | 410 (100.0%) | 452 (100.0%) |
Commute Time in Commerce
The most frequently occuring commute durations in Commerce are 5 to 9 minutes (224 commuters, 26.3%), 10 to 14 minutes (206 commuters, 24.2%), and 15 to 19 minutes (158 commuters, 18.5%).
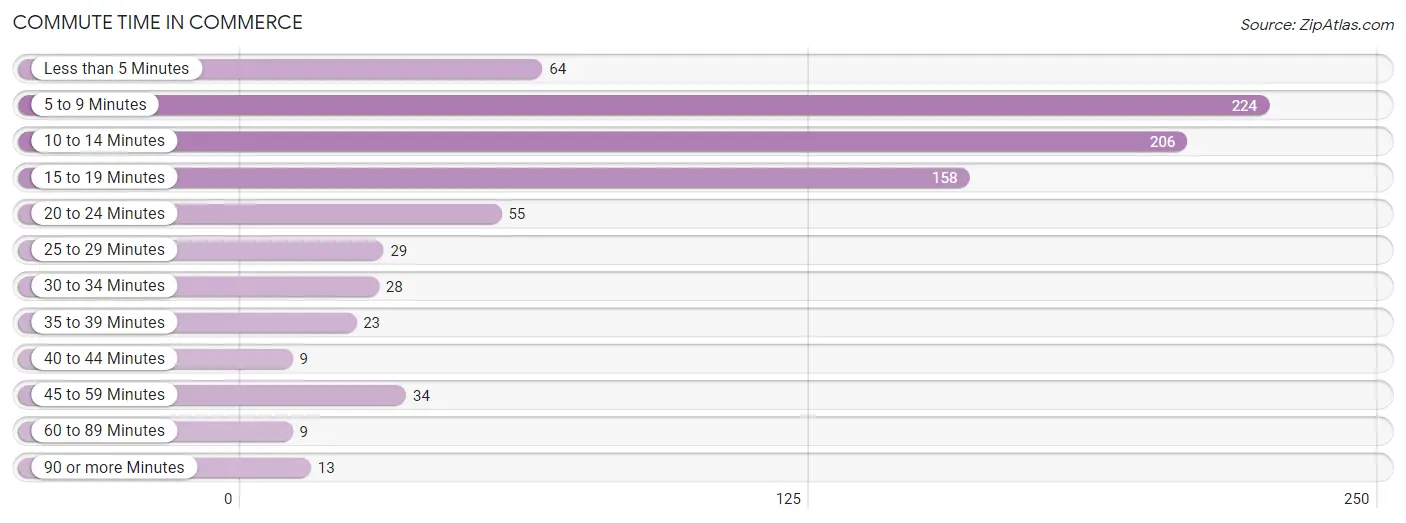
| Commute Time | # Commuters | % Commuters |
| Less than 5 Minutes | 64 | 7.5% |
| 5 to 9 Minutes | 224 | 26.3% |
| 10 to 14 Minutes | 206 | 24.2% |
| 15 to 19 Minutes | 158 | 18.5% |
| 20 to 24 Minutes | 55 | 6.5% |
| 25 to 29 Minutes | 29 | 3.4% |
| 30 to 34 Minutes | 28 | 3.3% |
| 35 to 39 Minutes | 23 | 2.7% |
| 40 to 44 Minutes | 9 | 1.1% |
| 45 to 59 Minutes | 34 | 4.0% |
| 60 to 89 Minutes | 9 | 1.1% |
| 90 or more Minutes | 13 | 1.5% |
Commute Time by Sex in Commerce
The most common commute times in Commerce are 5 to 9 minutes (121 commuters, 30.2%) for males and 10 to 14 minutes (126 commuters, 27.9%) for females.
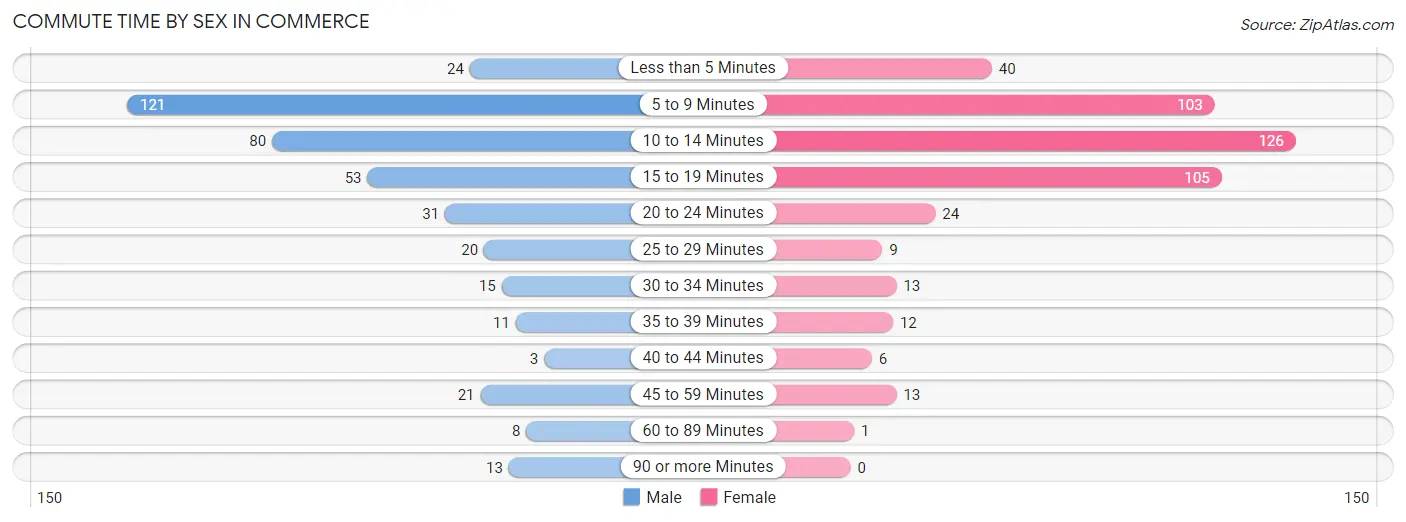
| Commute Time | Male | Female |
| Less than 5 Minutes | 24 (6.0%) | 40 (8.8%) |
| 5 to 9 Minutes | 121 (30.2%) | 103 (22.8%) |
| 10 to 14 Minutes | 80 (20.0%) | 126 (27.9%) |
| 15 to 19 Minutes | 53 (13.3%) | 105 (23.2%) |
| 20 to 24 Minutes | 31 (7.7%) | 24 (5.3%) |
| 25 to 29 Minutes | 20 (5.0%) | 9 (2.0%) |
| 30 to 34 Minutes | 15 (3.7%) | 13 (2.9%) |
| 35 to 39 Minutes | 11 (2.8%) | 12 (2.6%) |
| 40 to 44 Minutes | 3 (0.7%) | 6 (1.3%) |
| 45 to 59 Minutes | 21 (5.2%) | 13 (2.9%) |
| 60 to 89 Minutes | 8 (2.0%) | 1 (0.2%) |
| 90 or more Minutes | 13 (3.3%) | 0 (0.0%) |
Time of Departure to Work by Sex in Commerce
The most frequent times of departure to work in Commerce are 6:30 AM to 6:59 AM (74, 18.5%) for males and 6:30 AM to 6:59 AM (75, 16.6%) for females.
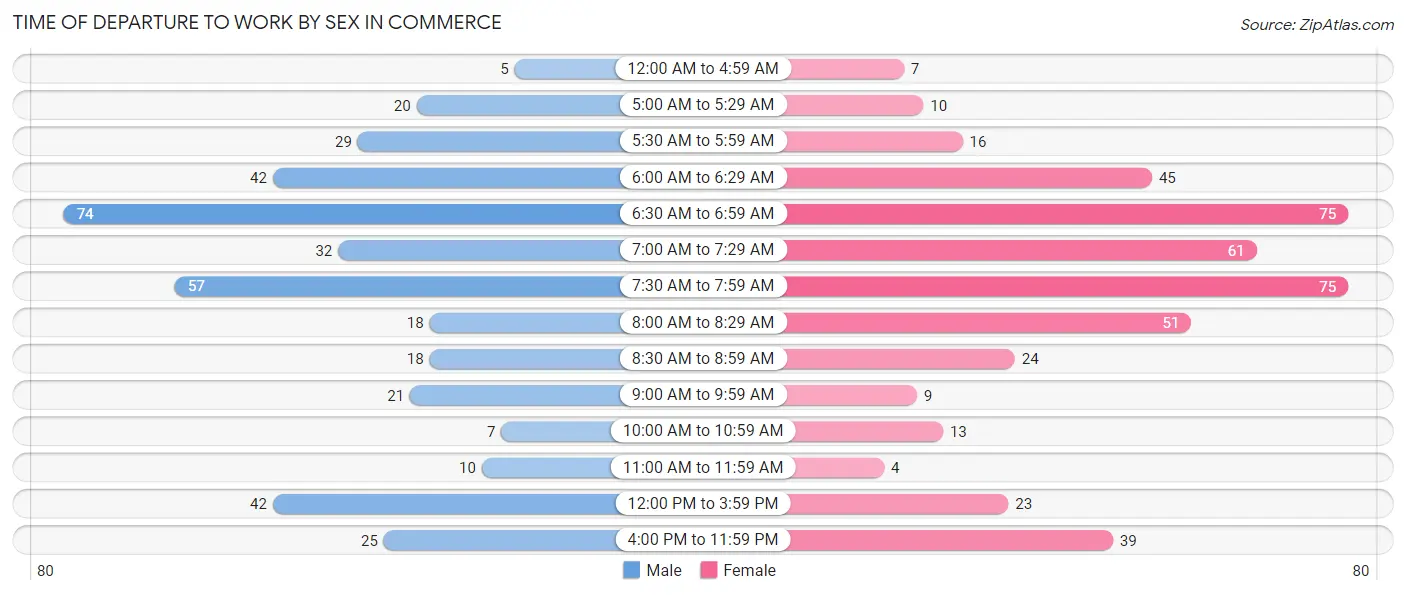
| Time of Departure | Male | Female |
| 12:00 AM to 4:59 AM | 5 (1.3%) | 7 (1.5%) |
| 5:00 AM to 5:29 AM | 20 (5.0%) | 10 (2.2%) |
| 5:30 AM to 5:59 AM | 29 (7.2%) | 16 (3.5%) |
| 6:00 AM to 6:29 AM | 42 (10.5%) | 45 (10.0%) |
| 6:30 AM to 6:59 AM | 74 (18.5%) | 75 (16.6%) |
| 7:00 AM to 7:29 AM | 32 (8.0%) | 61 (13.5%) |
| 7:30 AM to 7:59 AM | 57 (14.2%) | 75 (16.6%) |
| 8:00 AM to 8:29 AM | 18 (4.5%) | 51 (11.3%) |
| 8:30 AM to 8:59 AM | 18 (4.5%) | 24 (5.3%) |
| 9:00 AM to 9:59 AM | 21 (5.2%) | 9 (2.0%) |
| 10:00 AM to 10:59 AM | 7 (1.8%) | 13 (2.9%) |
| 11:00 AM to 11:59 AM | 10 (2.5%) | 4 (0.9%) |
| 12:00 PM to 3:59 PM | 42 (10.5%) | 23 (5.1%) |
| 4:00 PM to 11:59 PM | 25 (6.2%) | 39 (8.6%) |
| Total | 400 (100.0%) | 452 (100.0%) |
Housing Occupancy in Commerce
Occupancy by Ownership in Commerce
Of the total 837 dwellings in Commerce, owner-occupied units account for 561 (67.0%), while renter-occupied units make up 276 (33.0%).
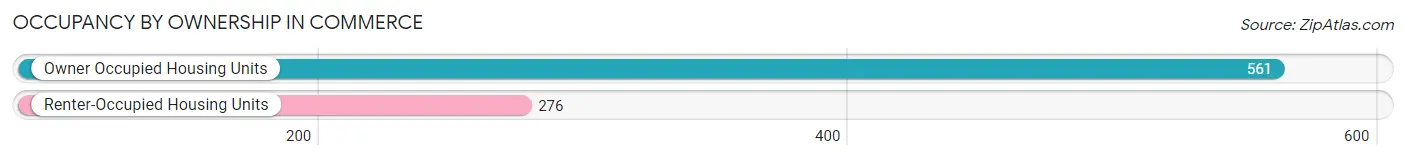
| Occupancy | # Housing Units | % Housing Units |
| Owner Occupied Housing Units | 561 | 67.0% |
| Renter-Occupied Housing Units | 276 | 33.0% |
| Total Occupied Housing Units | 837 | 100.0% |
Occupancy by Household Size in Commerce
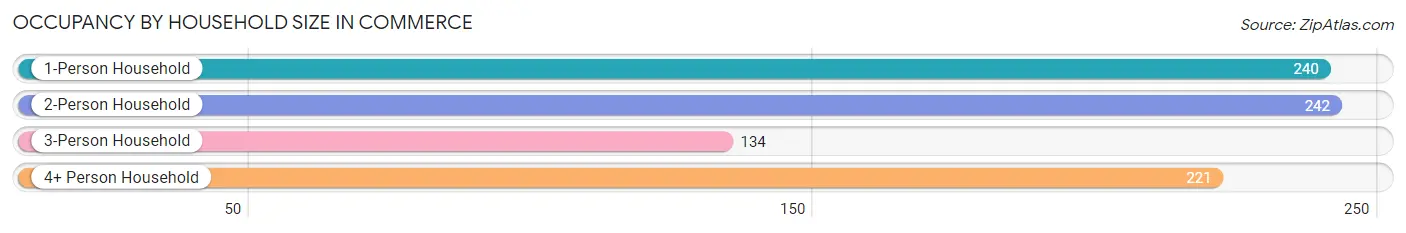
| Household Size | # Housing Units | % Housing Units |
| 1-Person Household | 240 | 28.7% |
| 2-Person Household | 242 | 28.9% |
| 3-Person Household | 134 | 16.0% |
| 4+ Person Household | 221 | 26.4% |
| Total Housing Units | 837 | 100.0% |
Occupancy by Ownership by Household Size in Commerce
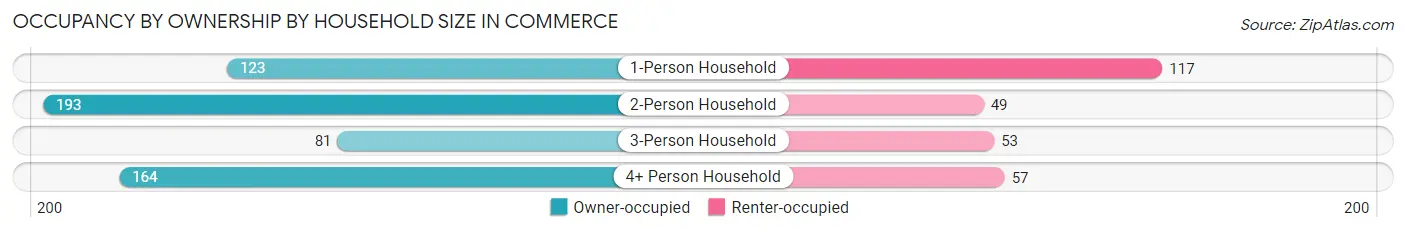
| Household Size | Owner-occupied | Renter-occupied |
| 1-Person Household | 123 (51.2%) | 117 (48.7%) |
| 2-Person Household | 193 (79.7%) | 49 (20.3%) |
| 3-Person Household | 81 (60.5%) | 53 (39.6%) |
| 4+ Person Household | 164 (74.2%) | 57 (25.8%) |
| Total Housing Units | 561 (67.0%) | 276 (33.0%) |
Occupancy by Educational Attainment in Commerce
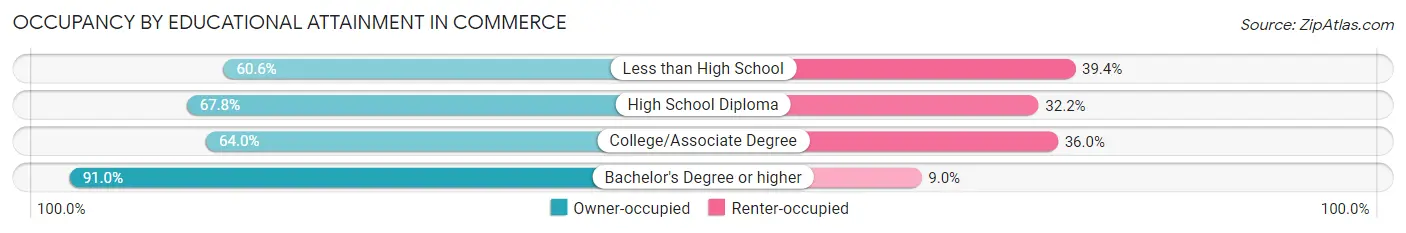
| Household Size | Owner-occupied | Renter-occupied |
| Less than High School | 106 (60.6%) | 69 (39.4%) |
| High School Diploma | 234 (67.8%) | 111 (32.2%) |
| College/Associate Degree | 160 (64.0%) | 90 (36.0%) |
| Bachelor's Degree or higher | 61 (91.0%) | 6 (9.0%) |
Occupancy by Age of Householder in Commerce
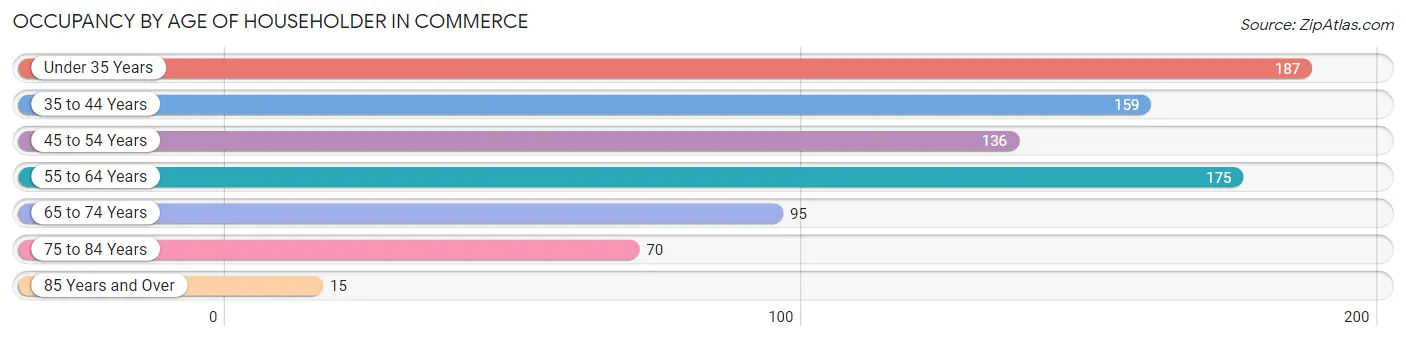
| Age Bracket | # Households | % Households |
| Under 35 Years | 187 | 22.3% |
| 35 to 44 Years | 159 | 19.0% |
| 45 to 54 Years | 136 | 16.3% |
| 55 to 64 Years | 175 | 20.9% |
| 65 to 74 Years | 95 | 11.4% |
| 75 to 84 Years | 70 | 8.4% |
| 85 Years and Over | 15 | 1.8% |
| Total | 837 | 100.0% |
Housing Finances in Commerce
Median Income by Occupancy in Commerce
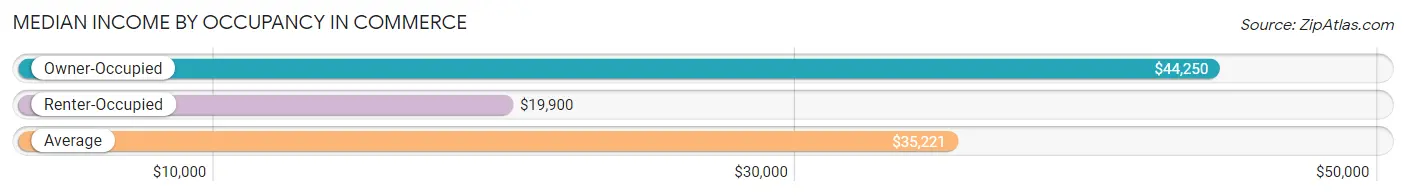
| Occupancy Type | # Households | Median Income |
| Owner-Occupied | 561 (67.0%) | $44,250 |
| Renter-Occupied | 276 (33.0%) | $19,900 |
| Average | 837 (100.0%) | $35,221 |
Occupancy by Householder Income Bracket in Commerce
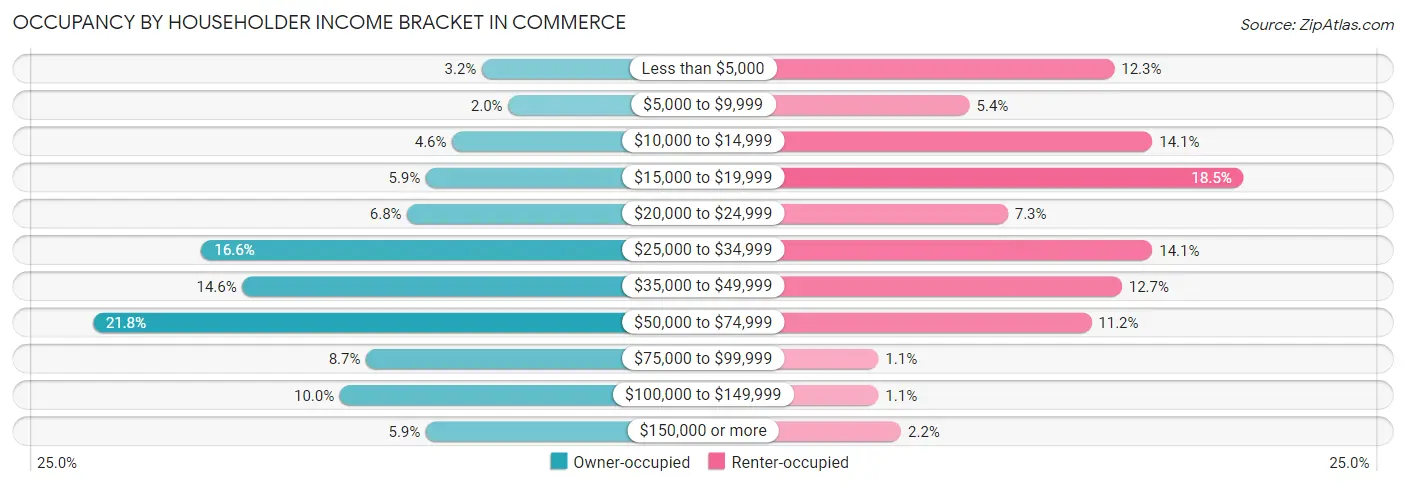
| Income Bracket | Owner-occupied | Renter-occupied |
| Less than $5,000 | 18 (3.2%) | 34 (12.3%) |
| $5,000 to $9,999 | 11 (2.0%) | 15 (5.4%) |
| $10,000 to $14,999 | 26 (4.6%) | 39 (14.1%) |
| $15,000 to $19,999 | 33 (5.9%) | 51 (18.5%) |
| $20,000 to $24,999 | 38 (6.8%) | 20 (7.2%) |
| $25,000 to $34,999 | 93 (16.6%) | 39 (14.1%) |
| $35,000 to $49,999 | 82 (14.6%) | 35 (12.7%) |
| $50,000 to $74,999 | 122 (21.7%) | 31 (11.2%) |
| $75,000 to $99,999 | 49 (8.7%) | 3 (1.1%) |
| $100,000 to $149,999 | 56 (10.0%) | 3 (1.1%) |
| $150,000 or more | 33 (5.9%) | 6 (2.2%) |
| Total | 561 (100.0%) | 276 (100.0%) |
Monthly Housing Cost Tiers in Commerce
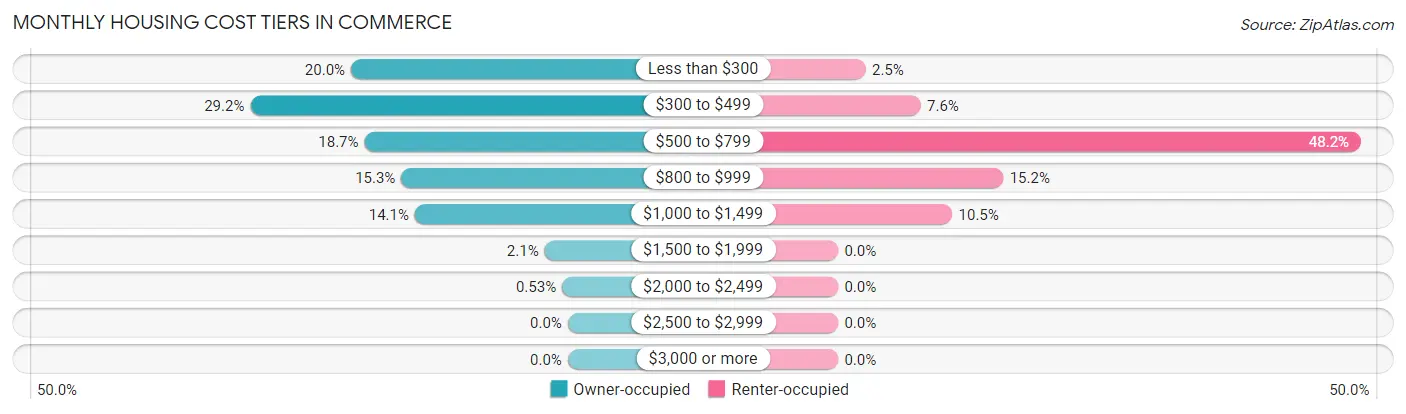
| Monthly Cost | Owner-occupied | Renter-occupied |
| Less than $300 | 112 (20.0%) | 7 (2.5%) |
| $300 to $499 | 164 (29.2%) | 21 (7.6%) |
| $500 to $799 | 105 (18.7%) | 133 (48.2%) |
| $800 to $999 | 86 (15.3%) | 42 (15.2%) |
| $1,000 to $1,499 | 79 (14.1%) | 29 (10.5%) |
| $1,500 to $1,999 | 12 (2.1%) | 0 (0.0%) |
| $2,000 to $2,499 | 3 (0.5%) | 0 (0.0%) |
| $2,500 to $2,999 | 0 (0.0%) | 0 (0.0%) |
| $3,000 or more | 0 (0.0%) | 0 (0.0%) |
| Total | 561 (100.0%) | 276 (100.0%) |
Physical Housing Characteristics in Commerce
Housing Structures in Commerce
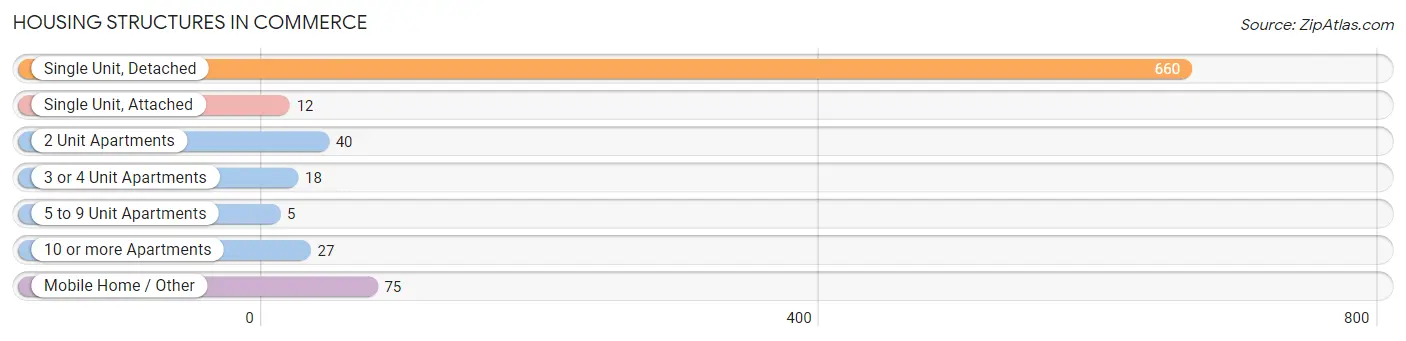
| Structure Type | # Housing Units | % Housing Units |
| Single Unit, Detached | 660 | 78.8% |
| Single Unit, Attached | 12 | 1.4% |
| 2 Unit Apartments | 40 | 4.8% |
| 3 or 4 Unit Apartments | 18 | 2.1% |
| 5 to 9 Unit Apartments | 5 | 0.6% |
| 10 or more Apartments | 27 | 3.2% |
| Mobile Home / Other | 75 | 9.0% |
| Total | 837 | 100.0% |
Housing Structures by Occupancy in Commerce
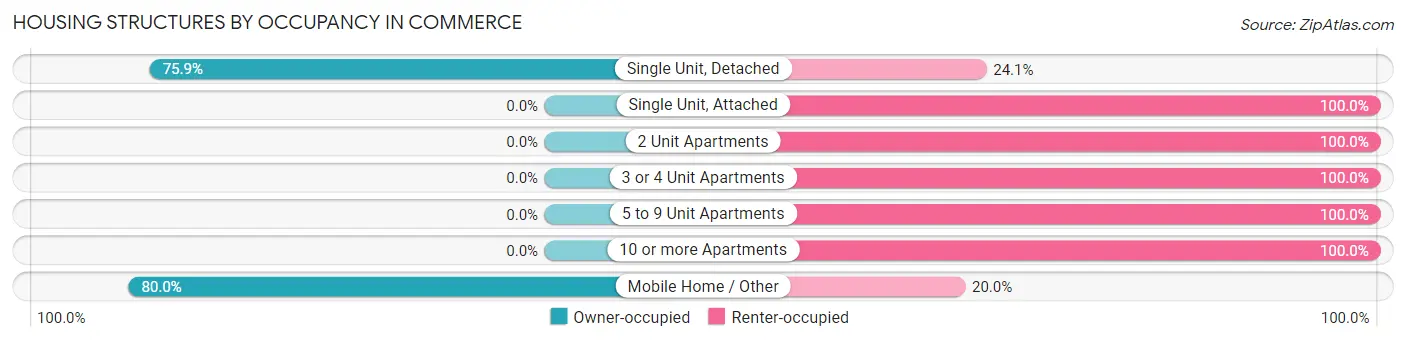
| Structure Type | Owner-occupied | Renter-occupied |
| Single Unit, Detached | 501 (75.9%) | 159 (24.1%) |
| Single Unit, Attached | 0 (0.0%) | 12 (100.0%) |
| 2 Unit Apartments | 0 (0.0%) | 40 (100.0%) |
| 3 or 4 Unit Apartments | 0 (0.0%) | 18 (100.0%) |
| 5 to 9 Unit Apartments | 0 (0.0%) | 5 (100.0%) |
| 10 or more Apartments | 0 (0.0%) | 27 (100.0%) |
| Mobile Home / Other | 60 (80.0%) | 15 (20.0%) |
| Total | 561 (67.0%) | 276 (33.0%) |
Housing Structures by Number of Rooms in Commerce
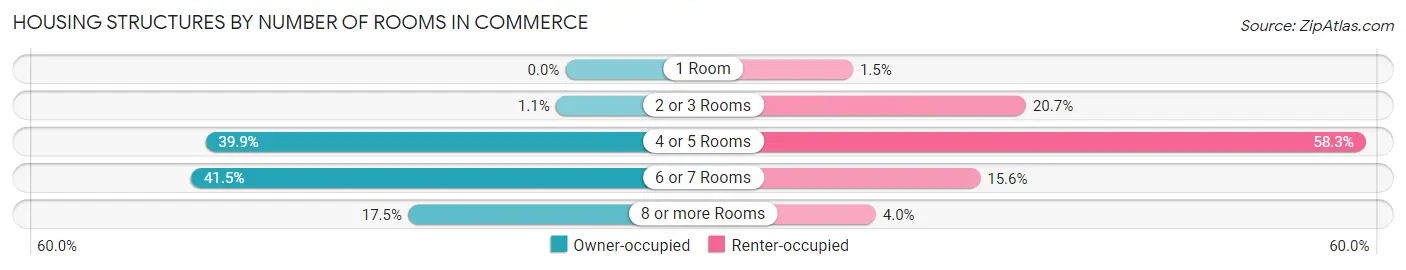
| Number of Rooms | Owner-occupied | Renter-occupied |
| 1 Room | 0 (0.0%) | 4 (1.5%) |
| 2 or 3 Rooms | 6 (1.1%) | 57 (20.6%) |
| 4 or 5 Rooms | 224 (39.9%) | 161 (58.3%) |
| 6 or 7 Rooms | 233 (41.5%) | 43 (15.6%) |
| 8 or more Rooms | 98 (17.5%) | 11 (4.0%) |
| Total | 561 (100.0%) | 276 (100.0%) |
Housing Structure by Heating Type in Commerce
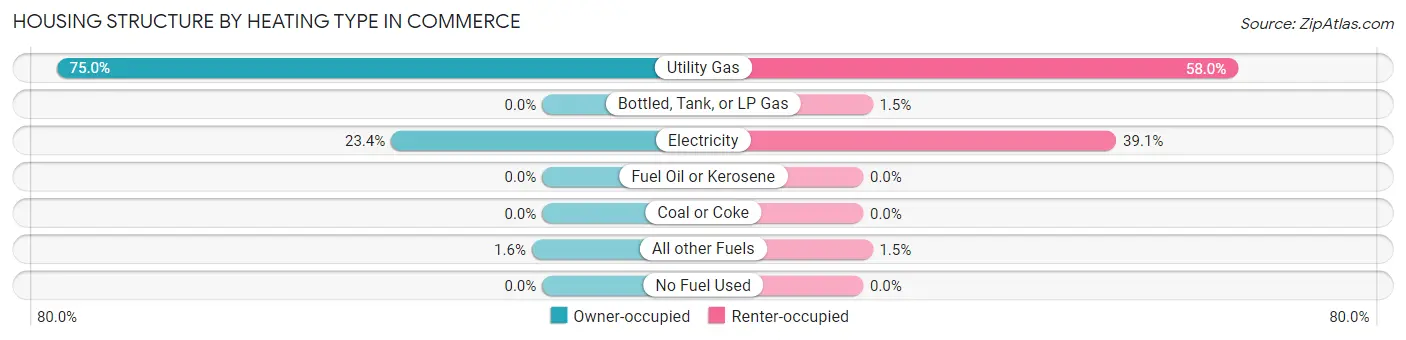
| Heating Type | Owner-occupied | Renter-occupied |
| Utility Gas | 421 (75.0%) | 160 (58.0%) |
| Bottled, Tank, or LP Gas | 0 (0.0%) | 4 (1.5%) |
| Electricity | 131 (23.4%) | 108 (39.1%) |
| Fuel Oil or Kerosene | 0 (0.0%) | 0 (0.0%) |
| Coal or Coke | 0 (0.0%) | 0 (0.0%) |
| All other Fuels | 9 (1.6%) | 4 (1.5%) |
| No Fuel Used | 0 (0.0%) | 0 (0.0%) |
| Total | 561 (100.0%) | 276 (100.0%) |
Household Vehicle Usage in Commerce
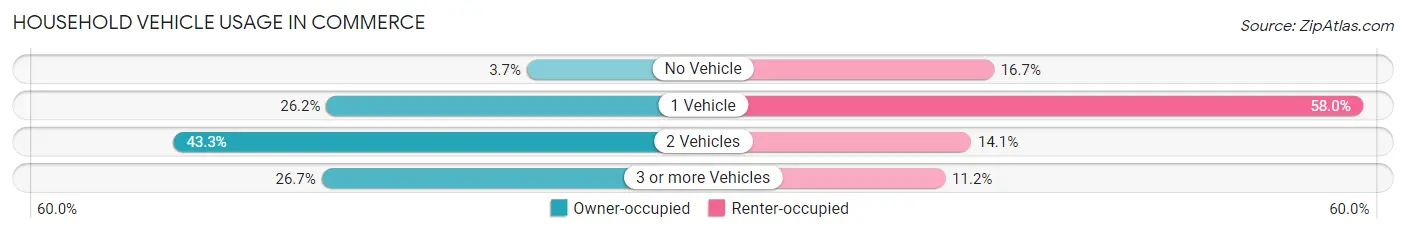
| Vehicles per Household | Owner-occupied | Renter-occupied |
| No Vehicle | 21 (3.7%) | 46 (16.7%) |
| 1 Vehicle | 147 (26.2%) | 160 (58.0%) |
| 2 Vehicles | 243 (43.3%) | 39 (14.1%) |
| 3 or more Vehicles | 150 (26.7%) | 31 (11.2%) |
| Total | 561 (100.0%) | 276 (100.0%) |
Real Estate & Mortgages in Commerce
Real Estate and Mortgage Overview in Commerce
| Characteristic | Without Mortgage | With Mortgage |
| Housing Units | 312 | 249 |
| Median Property Value | $58,800 | $73,600 |
| Median Household Income | $38,594 | $19 |
| Monthly Housing Costs | $370 | $0 |
| Real Estate Taxes | $291 | $16 |
Property Value by Mortgage Status in Commerce
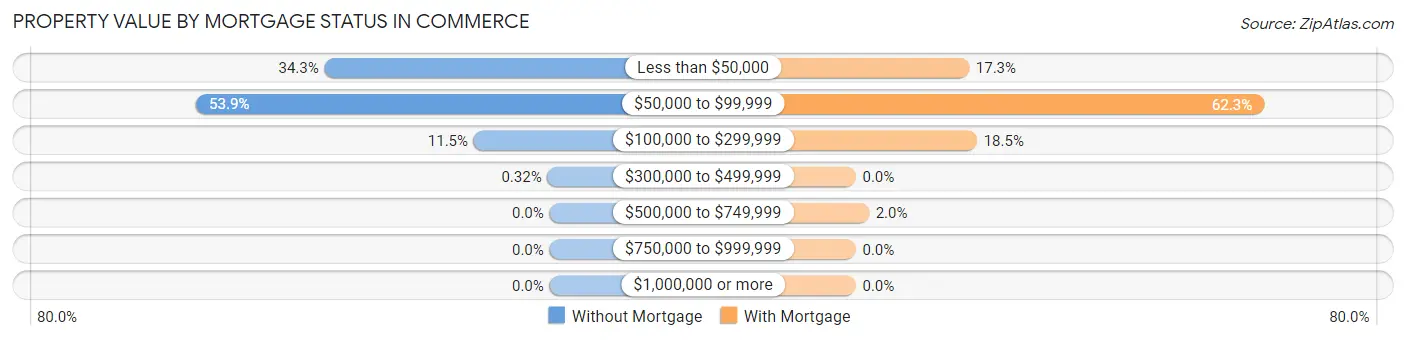
| Property Value | Without Mortgage | With Mortgage |
| Less than $50,000 | 107 (34.3%) | 43 (17.3%) |
| $50,000 to $99,999 | 168 (53.8%) | 155 (62.3%) |
| $100,000 to $299,999 | 36 (11.5%) | 46 (18.5%) |
| $300,000 to $499,999 | 1 (0.3%) | 0 (0.0%) |
| $500,000 to $749,999 | 0 (0.0%) | 5 (2.0%) |
| $750,000 to $999,999 | 0 (0.0%) | 0 (0.0%) |
| $1,000,000 or more | 0 (0.0%) | 0 (0.0%) |
| Total | 312 (100.0%) | 249 (100.0%) |
Household Income by Mortgage Status in Commerce
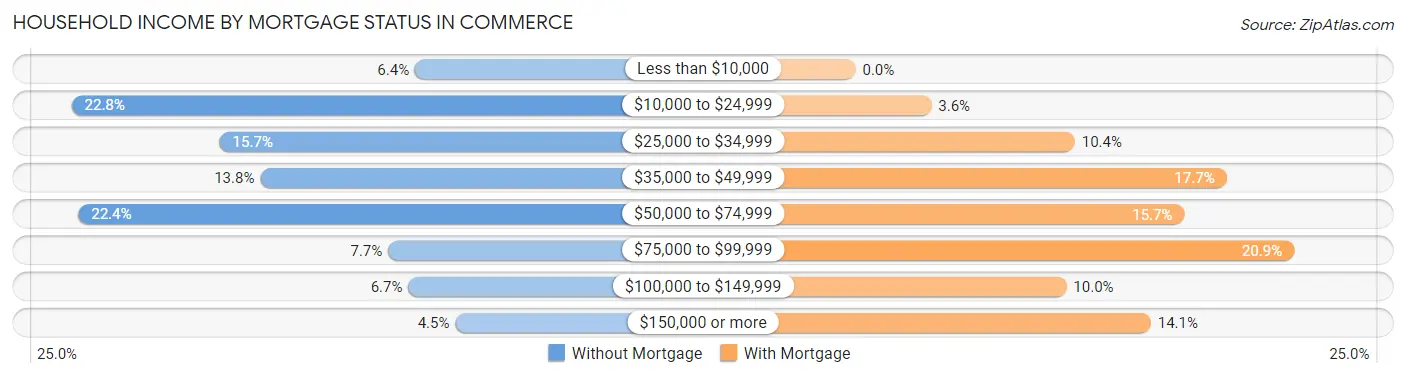
| Household Income | Without Mortgage | With Mortgage |
| Less than $10,000 | 20 (6.4%) | 0 (0.0%) |
| $10,000 to $24,999 | 71 (22.8%) | 9 (3.6%) |
| $25,000 to $34,999 | 49 (15.7%) | 26 (10.4%) |
| $35,000 to $49,999 | 43 (13.8%) | 44 (17.7%) |
| $50,000 to $74,999 | 70 (22.4%) | 39 (15.7%) |
| $75,000 to $99,999 | 24 (7.7%) | 52 (20.9%) |
| $100,000 to $149,999 | 21 (6.7%) | 25 (10.0%) |
| $150,000 or more | 14 (4.5%) | 35 (14.1%) |
| Total | 312 (100.0%) | 249 (100.0%) |
Property Value to Household Income Ratio in Commerce
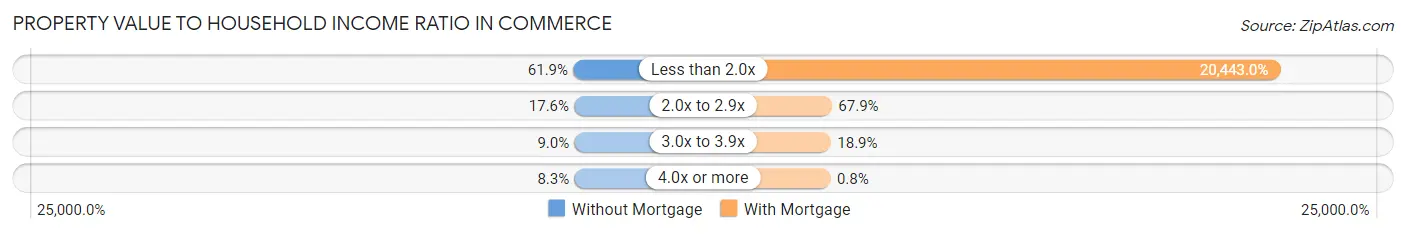
| Value-to-Income Ratio | Without Mortgage | With Mortgage |
| Less than 2.0x | 193 (61.9%) | 50,903 (20,443.0%) |
| 2.0x to 2.9x | 55 (17.6%) | 169 (67.9%) |
| 3.0x to 3.9x | 28 (9.0%) | 47 (18.9%) |
| 4.0x or more | 26 (8.3%) | 2 (0.8%) |
| Total | 312 (100.0%) | 249 (100.0%) |
Real Estate Taxes by Mortgage Status in Commerce
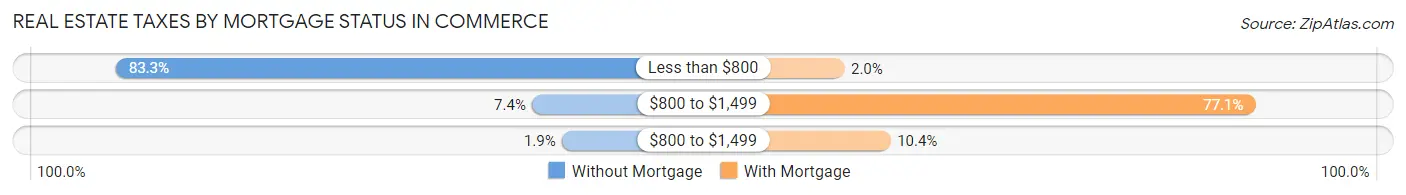
| Property Taxes | Without Mortgage | With Mortgage |
| Less than $800 | 260 (83.3%) | 5 (2.0%) |
| $800 to $1,499 | 23 (7.4%) | 192 (77.1%) |
| $800 to $1,499 | 6 (1.9%) | 26 (10.4%) |
| Total | 312 (100.0%) | 249 (100.0%) |
Health & Disability in Commerce
Health Insurance Coverage by Age in Commerce
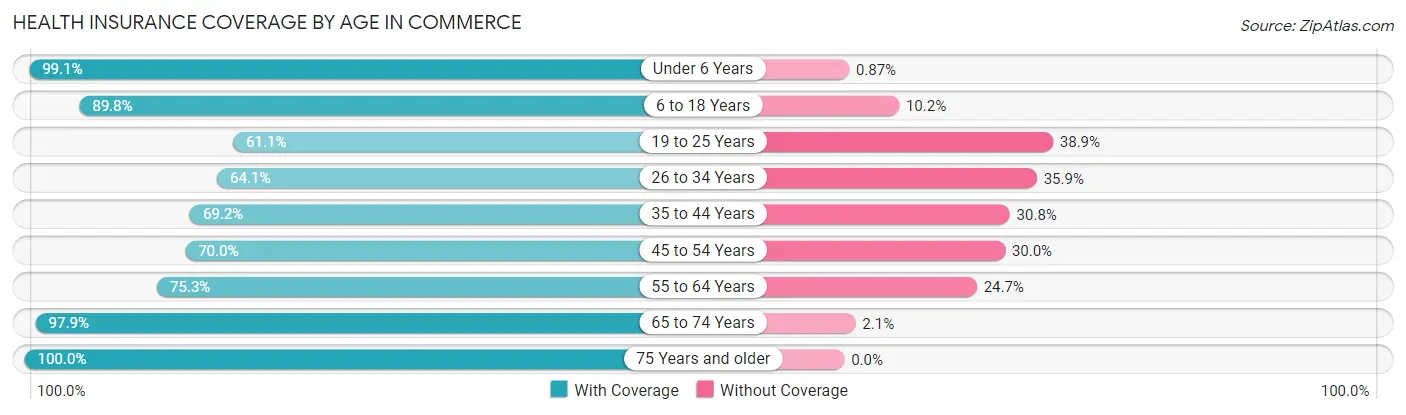
| Age Bracket | With Coverage | Without Coverage |
| Under 6 Years | 227 (99.1%) | 2 (0.9%) |
| 6 to 18 Years | 449 (89.8%) | 51 (10.2%) |
| 19 to 25 Years | 121 (61.1%) | 77 (38.9%) |
| 26 to 34 Years | 159 (64.1%) | 89 (35.9%) |
| 35 to 44 Years | 222 (69.2%) | 99 (30.8%) |
| 45 to 54 Years | 173 (70.0%) | 74 (30.0%) |
| 55 to 64 Years | 180 (75.3%) | 59 (24.7%) |
| 65 to 74 Years | 142 (97.9%) | 3 (2.1%) |
| 75 Years and older | 112 (100.0%) | 0 (0.0%) |
| Total | 1,785 (79.7%) | 454 (20.3%) |
Health Insurance Coverage by Citizenship Status in Commerce
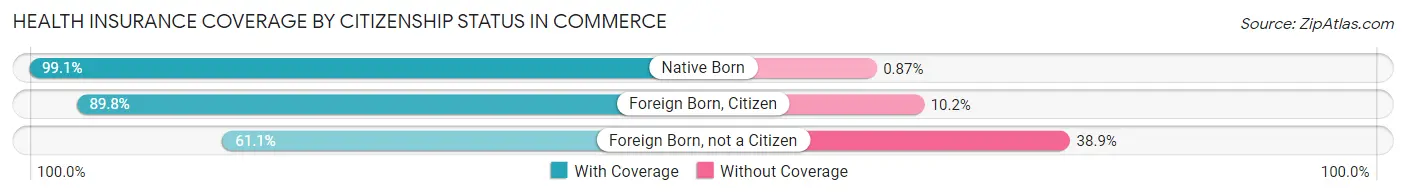
| Citizenship Status | With Coverage | Without Coverage |
| Native Born | 227 (99.1%) | 2 (0.9%) |
| Foreign Born, Citizen | 449 (89.8%) | 51 (10.2%) |
| Foreign Born, not a Citizen | 121 (61.1%) | 77 (38.9%) |
Health Insurance Coverage by Household Income in Commerce
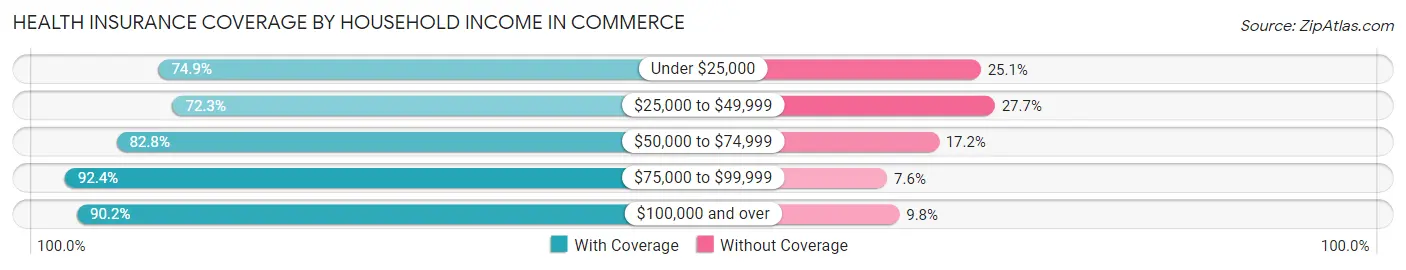
| Household Income | With Coverage | Without Coverage |
| Under $25,000 | 424 (74.9%) | 142 (25.1%) |
| $25,000 to $49,999 | 485 (72.3%) | 186 (27.7%) |
| $50,000 to $74,999 | 375 (82.8%) | 78 (17.2%) |
| $75,000 to $99,999 | 159 (92.4%) | 13 (7.6%) |
| $100,000 and over | 321 (90.2%) | 35 (9.8%) |
Public vs Private Health Insurance Coverage by Age in Commerce
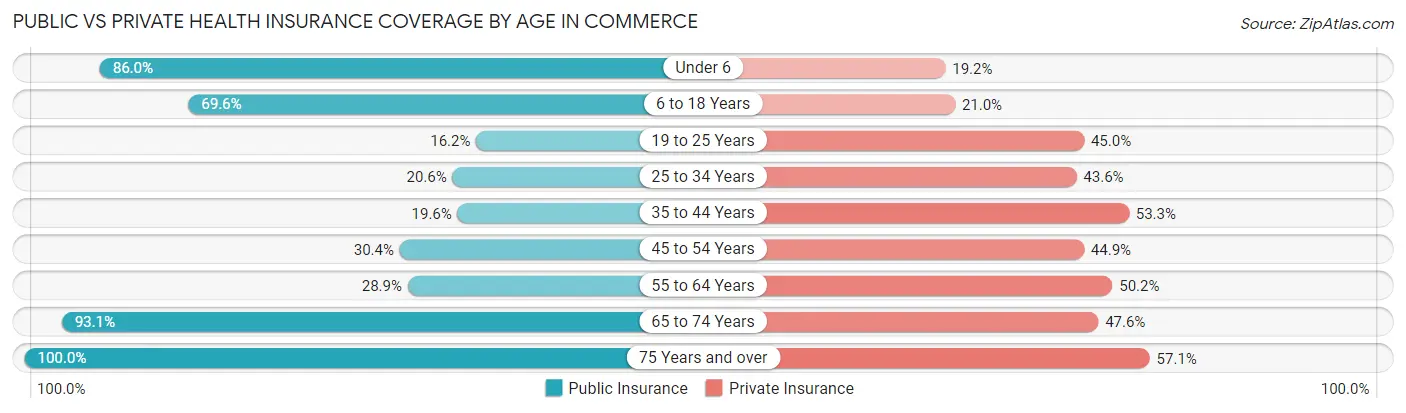
| Age Bracket | Public Insurance | Private Insurance |
| Under 6 | 197 (86.0%) | 44 (19.2%) |
| 6 to 18 Years | 348 (69.6%) | 105 (21.0%) |
| 19 to 25 Years | 32 (16.2%) | 89 (45.0%) |
| 25 to 34 Years | 51 (20.6%) | 108 (43.5%) |
| 35 to 44 Years | 63 (19.6%) | 171 (53.3%) |
| 45 to 54 Years | 75 (30.4%) | 111 (44.9%) |
| 55 to 64 Years | 69 (28.9%) | 120 (50.2%) |
| 65 to 74 Years | 135 (93.1%) | 69 (47.6%) |
| 75 Years and over | 112 (100.0%) | 64 (57.1%) |
| Total | 1,082 (48.3%) | 881 (39.4%) |
Disability Status by Sex by Age in Commerce
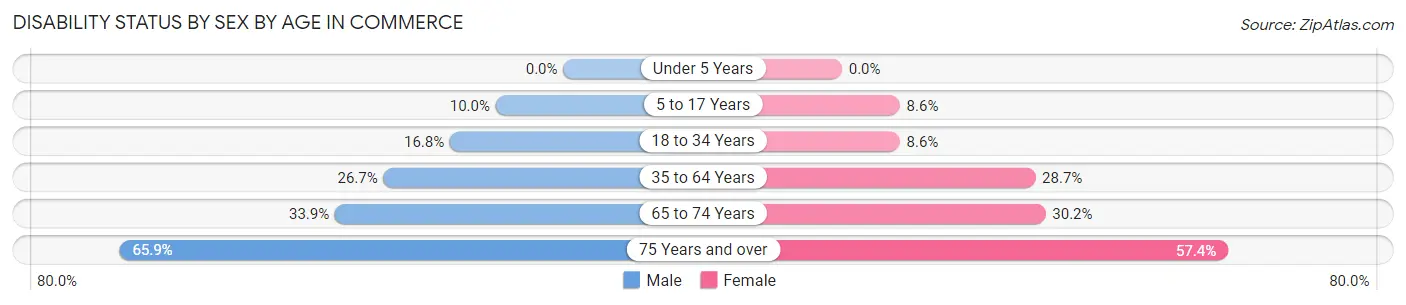
| Age Bracket | Male | Female |
| Under 5 Years | 0 (0.0%) | 0 (0.0%) |
| 5 to 17 Years | 32 (10.0%) | 17 (8.6%) |
| 18 to 34 Years | 35 (16.8%) | 23 (8.6%) |
| 35 to 64 Years | 102 (26.7%) | 122 (28.7%) |
| 65 to 74 Years | 20 (33.9%) | 26 (30.2%) |
| 75 Years and over | 29 (65.9%) | 39 (57.4%) |
Disability Class by Sex by Age in Commerce
Disability Class: Hearing Difficulty
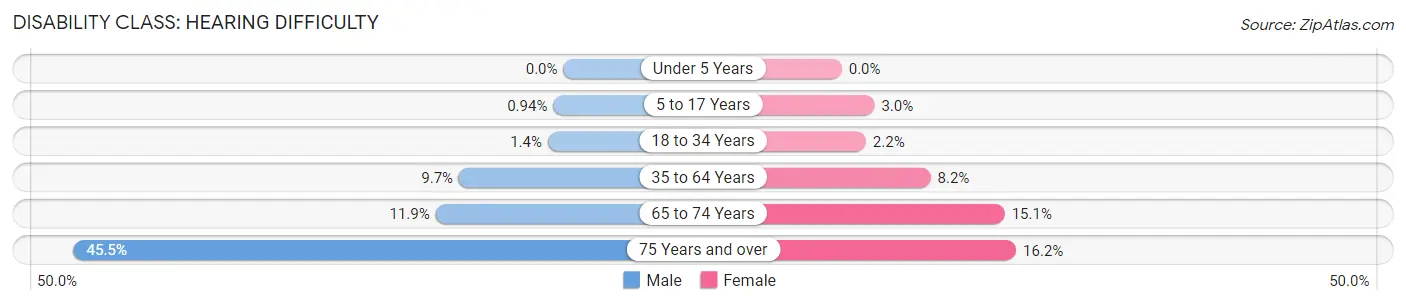
| Age Bracket | Male | Female |
| Under 5 Years | 0 (0.0%) | 0 (0.0%) |
| 5 to 17 Years | 3 (0.9%) | 6 (3.0%) |
| 18 to 34 Years | 3 (1.4%) | 6 (2.2%) |
| 35 to 64 Years | 37 (9.7%) | 35 (8.2%) |
| 65 to 74 Years | 7 (11.9%) | 13 (15.1%) |
| 75 Years and over | 20 (45.5%) | 11 (16.2%) |
Disability Class: Vision Difficulty
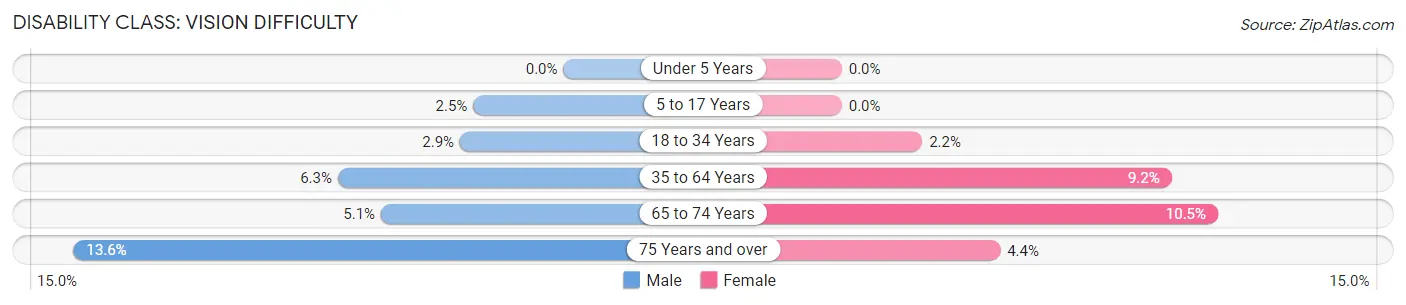
| Age Bracket | Male | Female |
| Under 5 Years | 0 (0.0%) | 0 (0.0%) |
| 5 to 17 Years | 8 (2.5%) | 0 (0.0%) |
| 18 to 34 Years | 6 (2.9%) | 6 (2.2%) |
| 35 to 64 Years | 24 (6.3%) | 39 (9.2%) |
| 65 to 74 Years | 3 (5.1%) | 9 (10.5%) |
| 75 Years and over | 6 (13.6%) | 3 (4.4%) |
Disability Class: Cognitive Difficulty
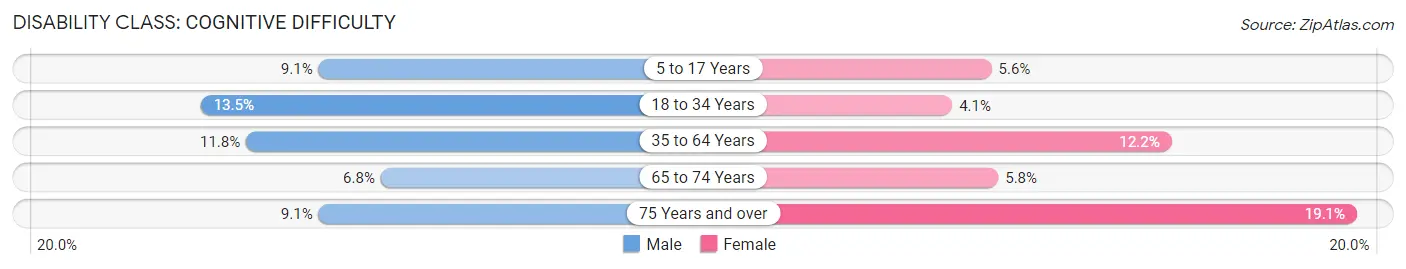
| Age Bracket | Male | Female |
| 5 to 17 Years | 29 (9.1%) | 11 (5.6%) |
| 18 to 34 Years | 28 (13.5%) | 11 (4.1%) |
| 35 to 64 Years | 45 (11.8%) | 52 (12.2%) |
| 65 to 74 Years | 4 (6.8%) | 5 (5.8%) |
| 75 Years and over | 4 (9.1%) | 13 (19.1%) |
Disability Class: Ambulatory Difficulty
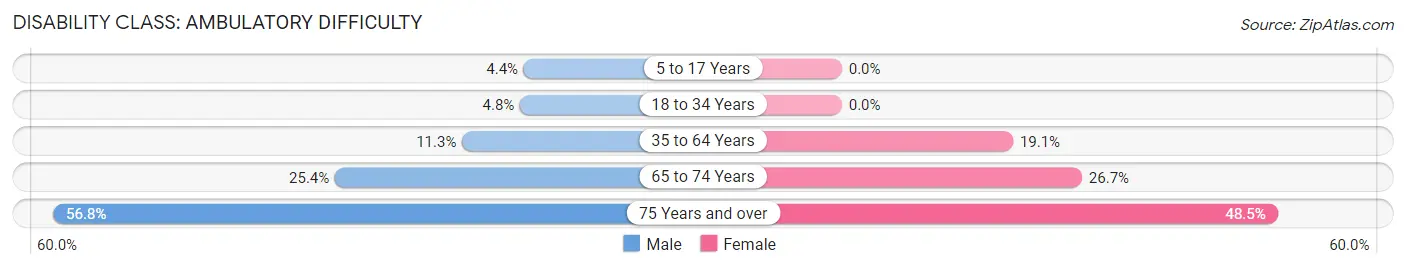
| Age Bracket | Male | Female |
| 5 to 17 Years | 14 (4.4%) | 0 (0.0%) |
| 18 to 34 Years | 10 (4.8%) | 0 (0.0%) |
| 35 to 64 Years | 43 (11.3%) | 81 (19.1%) |
| 65 to 74 Years | 15 (25.4%) | 23 (26.7%) |
| 75 Years and over | 25 (56.8%) | 33 (48.5%) |
Disability Class: Self-Care Difficulty
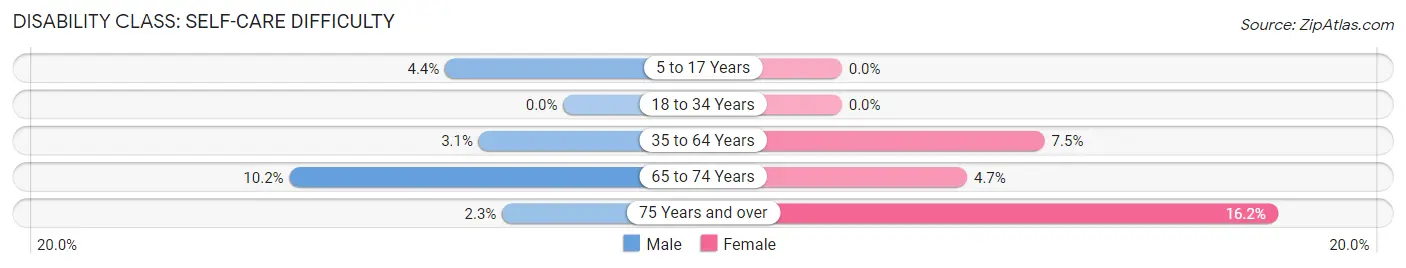
| Age Bracket | Male | Female |
| 5 to 17 Years | 14 (4.4%) | 0 (0.0%) |
| 18 to 34 Years | 0 (0.0%) | 0 (0.0%) |
| 35 to 64 Years | 12 (3.1%) | 32 (7.5%) |
| 65 to 74 Years | 6 (10.2%) | 4 (4.6%) |
| 75 Years and over | 1 (2.3%) | 11 (16.2%) |
Technology Access in Commerce
Computing Device Access in Commerce
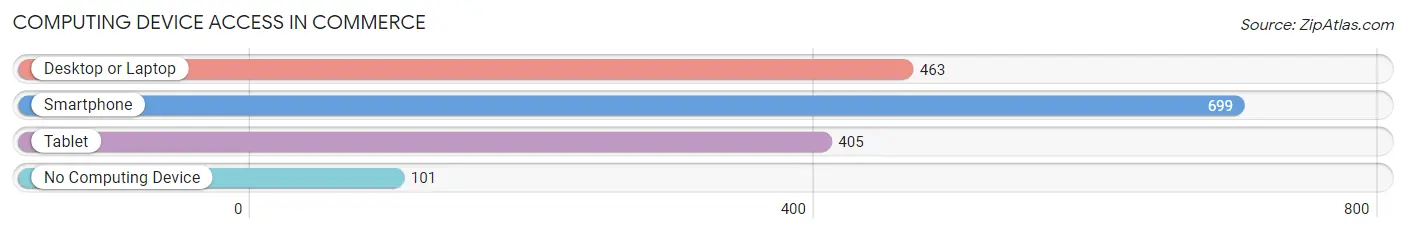
| Device Type | # Households | % Households |
| Desktop or Laptop | 463 | 55.3% |
| Smartphone | 699 | 83.5% |
| Tablet | 405 | 48.4% |
| No Computing Device | 101 | 12.1% |
| Total | 837 | 100.0% |
Internet Access in Commerce
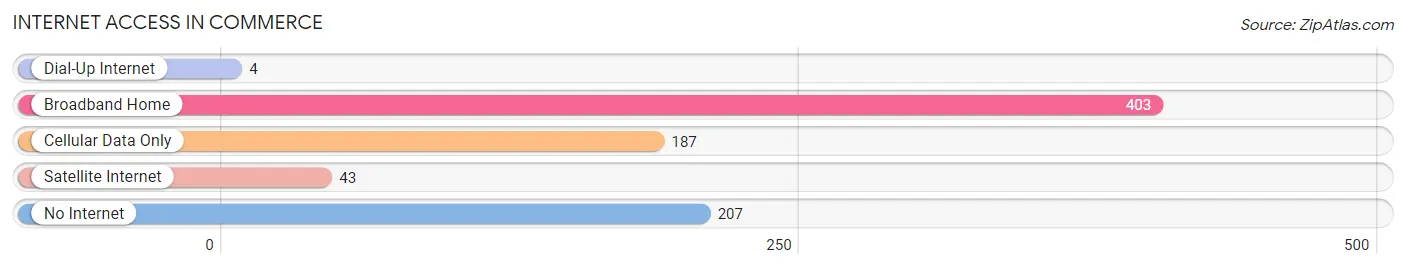
| Internet Type | # Households | % Households |
| Dial-Up Internet | 4 | 0.5% |
| Broadband Home | 403 | 48.1% |
| Cellular Data Only | 187 | 22.3% |
| Satellite Internet | 43 | 5.1% |
| No Internet | 207 | 24.7% |
| Total | 837 | 100.0% |
Commerce Summary
Commerce
Oklahoma is a state located in the South Central region of the United States. It is bordered by Texas to the south, Arkansas to the east, Kansas to the north, and New Mexico to the west. Oklahoma has a diverse economy, with a mix of industries including agriculture, energy, manufacturing, and services. The state is home to a number of large companies, including Chesapeake Energy, Devon Energy, and American Airlines. Oklahoma is also home to a number of smaller businesses, including many family-owned businesses.
History
Oklahoma has a long and varied history. The area was first inhabited by Native American tribes, including the Cherokee, Choctaw, and Chickasaw. In the early 1800s, the area was part of the Louisiana Purchase, and was later organized as the Indian Territory. In 1907, Oklahoma became the 46th state in the Union.
The state has a rich history of oil and gas production, which began in the early 1900s. Oklahoma was the site of the first commercial oil well in the United States, and the state quickly became a major producer of oil and gas. The state also has a long history of agriculture, with cotton, wheat, and cattle being the main crops.
Geography
Oklahoma is located in the South Central region of the United States. It is bordered by Texas to the south, Arkansas to the east, Kansas to the north, and New Mexico to the west. The state is divided into 77 counties, and has a total area of 69,898 square miles.
The state is mostly flat, with the exception of the Ouachita Mountains in the southeast. The state has a number of rivers, including the Arkansas, Canadian, and Red Rivers. Oklahoma also has a number of lakes, including Lake Texoma, Lake Eufaula, and Lake Oologah.
Economy
Oklahoma has a diverse economy, with a mix of industries including agriculture, energy, manufacturing, and services. The state is home to a number of large companies, including Chesapeake Energy, Devon Energy, and American Airlines. Oklahoma is also home to a number of smaller businesses, including many family-owned businesses.
Agriculture is an important part of the state’s economy, with wheat, cotton, and cattle being the main crops. The state is also a major producer of oil and gas, and is home to a number of energy companies. Manufacturing is also an important part of the state’s economy, with companies such as Boeing and General Electric having a presence in the state.
Demographics
As of 2020, the population of Oklahoma was estimated to be 3.9 million. The state has a population that is mostly white (76.2%), with smaller percentages of African Americans (7.9%), Native Americans (7.7%), and Hispanics (7.2%). The state’s largest cities are Oklahoma City, Tulsa, and Norman.
Oklahoma is a diverse state, with a mix of cultures and religions. The state is home to a number of Native American tribes, including the Cherokee, Choctaw, and Chickasaw. The state also has a large population of Baptists, as well as other Christian denominations.
Conclusion
Oklahoma is a state located in the South Central region of the United States. It has a diverse economy, with a mix of industries including agriculture, energy, manufacturing, and services. The state has a long and varied history, and is home to a number of large companies, as well as many family-owned businesses. The population of Oklahoma is mostly white, with smaller percentages of African Americans, Native Americans, and Hispanics. Oklahoma is a diverse state, with a mix of cultures and religions, and is home to a number of Native American tribes.
Common Questions
What is Per Capita Income in Commerce?
Per Capita income in Commerce is $18,649.
What is the Median Family Income in Commerce?
Median Family Income in Commerce is $39,286.
What is the Median Household income in Commerce?
Median Household Income in Commerce is $35,221.
What is Income or Wage Gap in Commerce?
Income or Wage Gap in Commerce is 23.1%.
Women in Commerce earn 76.9 cents for every dollar earned by a man.
What is Family Income Deficit in Commerce?
Family Income Deficit in Commerce is $9,789.
Families that are below poverty line in Commerce earn $9,789 less on average than the poverty threshold level.
What is Inequality or Gini Index in Commerce?
Inequality or Gini Index in Commerce is 0.46.
What is the Total Population of Commerce?
Total Population of Commerce is 2,302.
What is the Total Male Population of Commerce?
Total Male Population of Commerce is 1,154.
What is the Total Female Population of Commerce?
Total Female Population of Commerce is 1,148.
What is the Ratio of Males per 100 Females in Commerce?
There are 100.52 Males per 100 Females in Commerce.
What is the Ratio of Females per 100 Males in Commerce?
There are 99.48 Females per 100 Males in Commerce.
What is the Median Population Age in Commerce?
Median Population Age in Commerce is 33.7 Years.
What is the Average Family Size in Commerce
Average Family Size in Commerce is 3.2 People.
What is the Average Household Size in Commerce
Average Household Size in Commerce is 2.6 People.
How Large is the Labor Force in Commerce?
There are 936 People in the Labor Forcein in Commerce.
What is the Percentage of People in the Labor Force in Commerce?
55.7% of People are in the Labor Force in Commerce.
What is the Unemployment Rate in Commerce?
Unemployment Rate in Commerce is 4.0%.