Yukon, OK Map & Demographics
Yukon Map
Yukon Overview
$36,461
PER CAPITA INCOME
$92,906
AVG FAMILY INCOME
$75,865
AVG HOUSEHOLD INCOME
32.5%
WAGE / INCOME GAP [ % ]
67.5¢/ $1
WAGE / INCOME GAP [ $ ]
$9,217
FAMILY INCOME DEFICIT
0.38
INEQUALITY / GINI INDEX
24,198
TOTAL POPULATION
12,074
MALE POPULATION
12,124
FEMALE POPULATION
99.59
MALES / 100 FEMALES
100.41
FEMALES / 100 MALES
39.3
MEDIAN AGE
3.1
AVG FAMILY SIZE
2.6
AVG HOUSEHOLD SIZE
12,785
LABOR FORCE [ PEOPLE ]
66.2%
PERCENT IN LABOR FORCE
4.0%
UNEMPLOYMENT RATE
Yukon Zip Codes
Yukon Area Codes
Income in Yukon
Income Overview in Yukon
Per Capita Income in Yukon is $36,461, while median incomes of families and households are $92,906 and $75,865 respectively.
| Characteristic | Number | Measure |
| Per Capita Income | 24,198 | $36,461 |
| Median Family Income | 6,507 | $92,906 |
| Mean Family Income | 6,507 | $106,727 |
| Median Household Income | 9,155 | $75,865 |
| Mean Household Income | 9,155 | $92,960 |
| Income Deficit | 6,507 | $9,217 |
| Wage / Income Gap (%) | 24,198 | 32.47% |
| Wage / Income Gap ($) | 24,198 | 67.53¢ per $1 |
| Gini / Inequality Index | 24,198 | 0.38 |
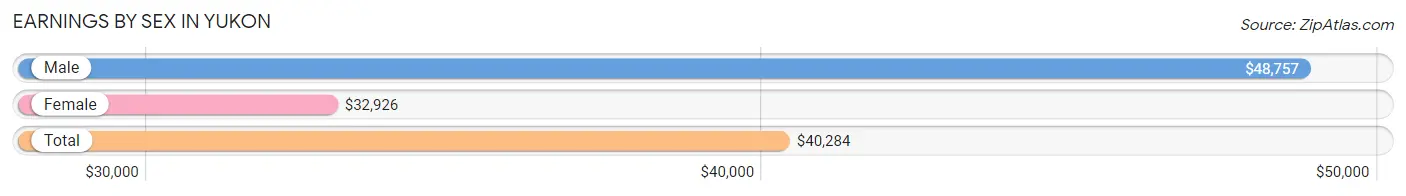
Earnings by Sex in Yukon
Average Earnings in Yukon are $40,284, $48,757 for men and $32,926 for women, a difference of 32.5%.
| Sex | Number | Average Earnings |
| Male | 7,194 (54.1%) | $48,757 |
| Female | 6,103 (45.9%) | $32,926 |
| Total | 13,297 (100.0%) | $40,284 |
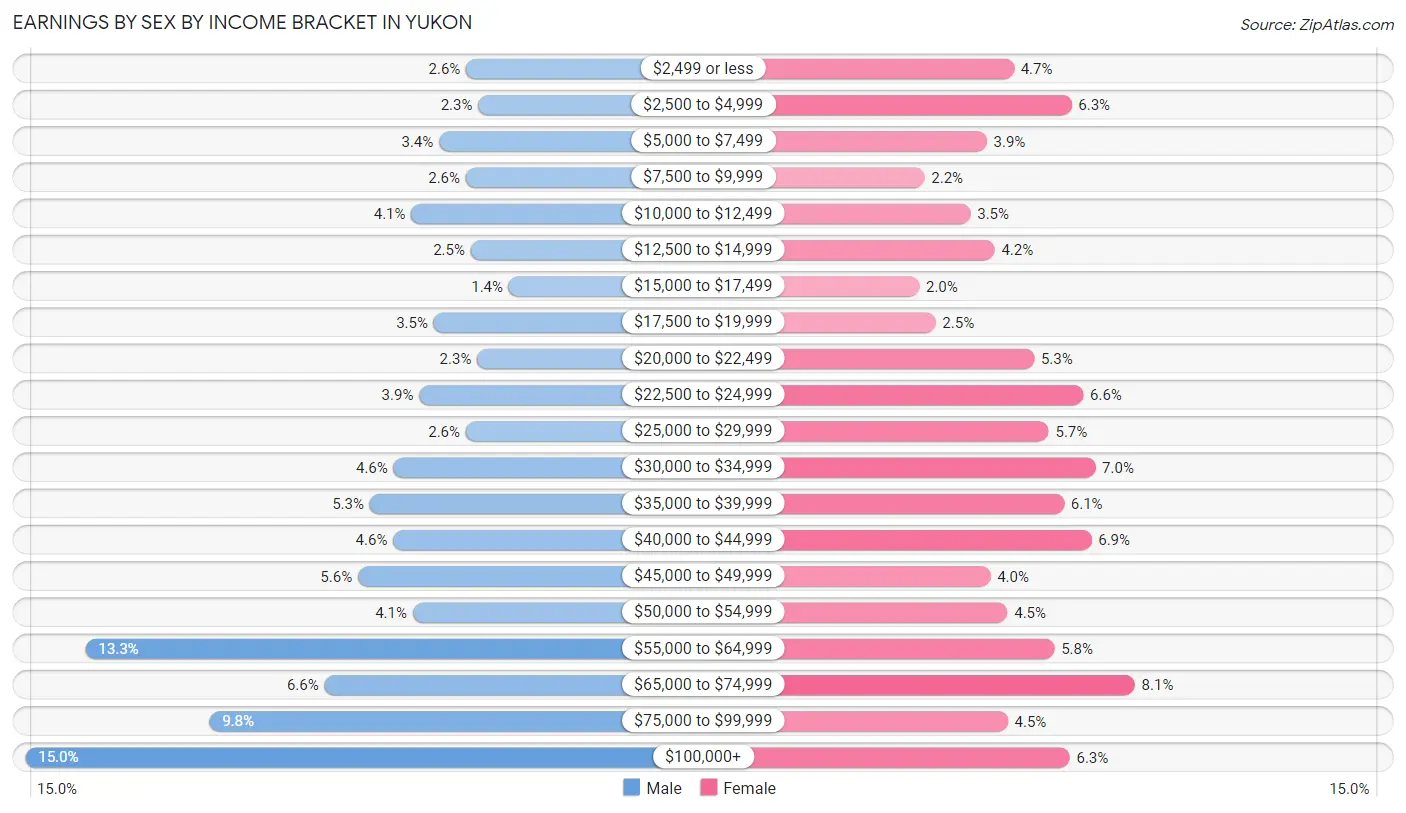
Earnings by Sex by Income Bracket in Yukon
The most common earnings brackets in Yukon are $100,000+ for men (1,078 | 15.0%) and $65,000 to $74,999 for women (494 | 8.1%).
| Income | Male | Female |
| $2,499 or less | 186 (2.6%) | 286 (4.7%) |
| $2,500 to $4,999 | 162 (2.2%) | 385 (6.3%) |
| $5,000 to $7,499 | 241 (3.4%) | 240 (3.9%) |
| $7,500 to $9,999 | 187 (2.6%) | 133 (2.2%) |
| $10,000 to $12,499 | 297 (4.1%) | 212 (3.5%) |
| $12,500 to $14,999 | 177 (2.5%) | 253 (4.2%) |
| $15,000 to $17,499 | 100 (1.4%) | 124 (2.0%) |
| $17,500 to $19,999 | 252 (3.5%) | 152 (2.5%) |
| $20,000 to $22,499 | 164 (2.3%) | 321 (5.3%) |
| $22,500 to $24,999 | 281 (3.9%) | 405 (6.6%) |
| $25,000 to $29,999 | 187 (2.6%) | 346 (5.7%) |
| $30,000 to $34,999 | 333 (4.6%) | 426 (7.0%) |
| $35,000 to $39,999 | 381 (5.3%) | 372 (6.1%) |
| $40,000 to $44,999 | 334 (4.6%) | 419 (6.9%) |
| $45,000 to $49,999 | 405 (5.6%) | 246 (4.0%) |
| $50,000 to $54,999 | 294 (4.1%) | 275 (4.5%) |
| $55,000 to $64,999 | 956 (13.3%) | 356 (5.8%) |
| $65,000 to $74,999 | 473 (6.6%) | 494 (8.1%) |
| $75,000 to $99,999 | 706 (9.8%) | 276 (4.5%) |
| $100,000+ | 1,078 (15.0%) | 382 (6.3%) |
| Total | 7,194 (100.0%) | 6,103 (100.0%) |
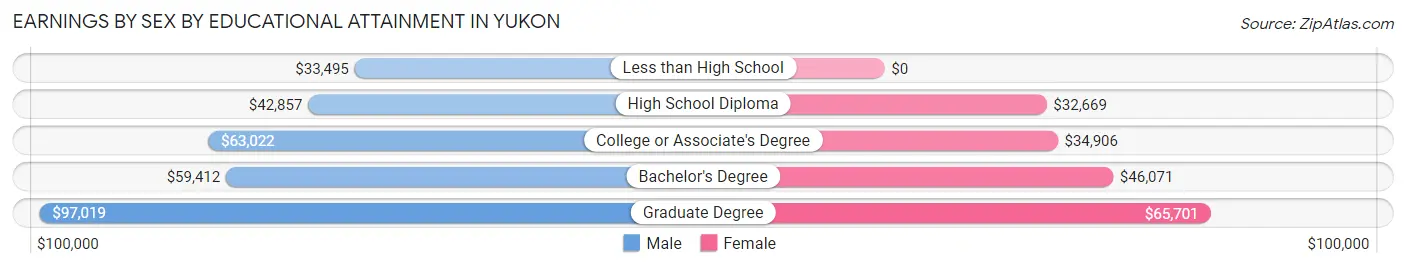
Earnings by Sex by Educational Attainment in Yukon
Average earnings in Yukon are $56,834 for men and $38,829 for women, a difference of 31.7%. Men with an educational attainment of graduate degree enjoy the highest average annual earnings of $97,019, while those with less than high school education earn the least with $33,495. Women with an educational attainment of graduate degree earn the most with the average annual earnings of $65,701, while those with high school diploma education have the smallest earnings of $32,669.
| Educational Attainment | Male Income | Female Income |
| Less than High School | $33,495 | $0 |
| High School Diploma | $42,857 | $32,669 |
| College or Associate's Degree | $63,022 | $34,906 |
| Bachelor's Degree | $59,412 | $46,071 |
| Graduate Degree | $97,019 | $65,701 |
| Total | $56,834 | $38,829 |
Family Income in Yukon
Family Income Brackets in Yukon
According to the Yukon family income data, there are 1,920 families falling into the $100,000 to $149,999 income range, which is the most common income bracket and makes up 29.5% of all families. Conversely, the $10,000 to $14,999 income bracket is the least frequent group with only 33 families (0.5%) belonging to this category.
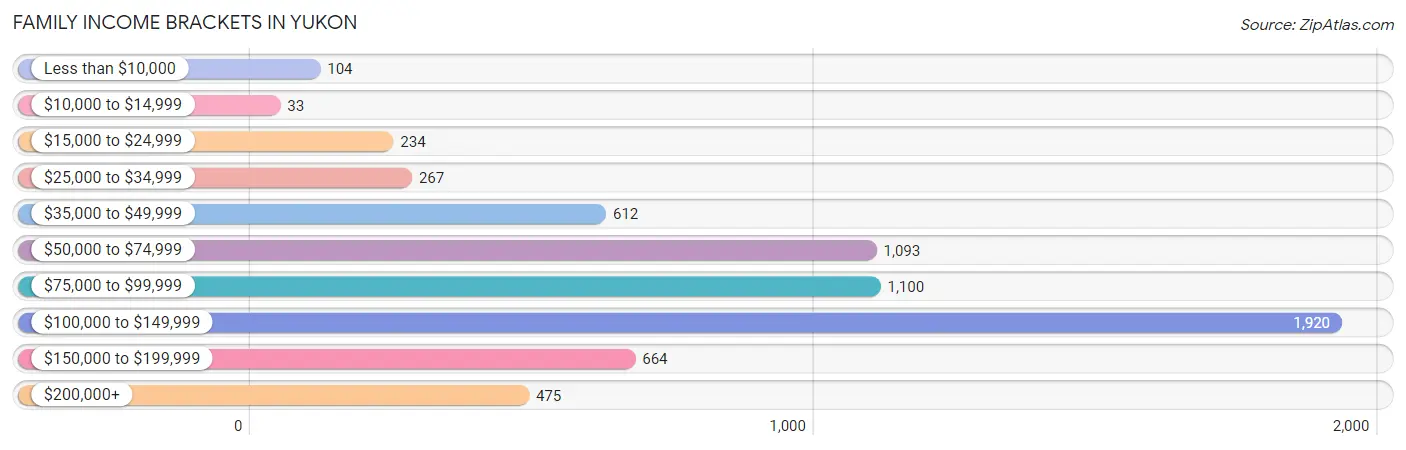
| Income Bracket | # Families | % Families |
| Less than $10,000 | 104 | 1.6% |
| $10,000 to $14,999 | 33 | 0.5% |
| $15,000 to $24,999 | 234 | 3.6% |
| $25,000 to $34,999 | 267 | 4.1% |
| $35,000 to $49,999 | 612 | 9.4% |
| $50,000 to $74,999 | 1,093 | 16.8% |
| $75,000 to $99,999 | 1,100 | 16.9% |
| $100,000 to $149,999 | 1,920 | 29.5% |
| $150,000 to $199,999 | 664 | 10.2% |
| $200,000+ | 475 | 7.3% |
Family Income by Famaliy Size in Yukon
5-person families (737 | 11.3%) account for the highest median family income in Yukon with $113,765 per family, while 2-person families (3,465 | 53.2%) have the highest median income of $40,444 per family member.
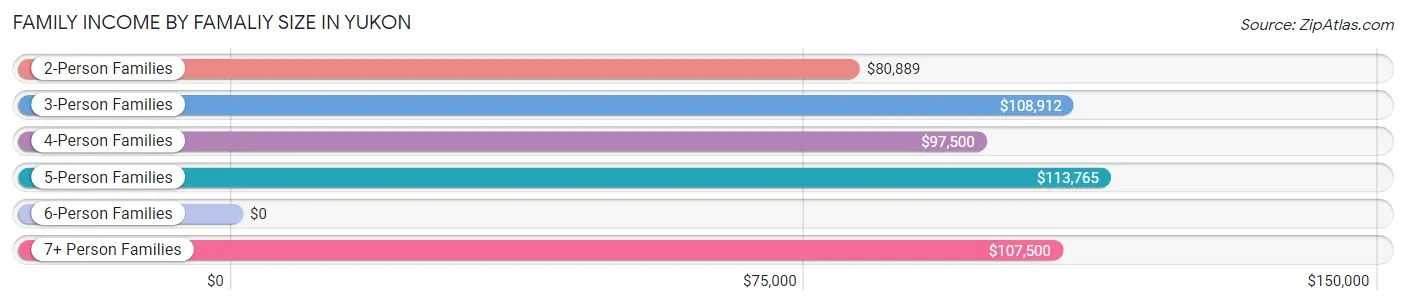
| Income Bracket | # Families | Median Income |
| 2-Person Families | 3,465 (53.2%) | $80,889 |
| 3-Person Families | 1,227 (18.9%) | $108,912 |
| 4-Person Families | 812 (12.5%) | $97,500 |
| 5-Person Families | 737 (11.3%) | $113,765 |
| 6-Person Families | 236 (3.6%) | $0 |
| 7+ Person Families | 30 (0.5%) | $107,500 |
| Total | 6,507 (100.0%) | $92,906 |
Family Income by Number of Earners in Yukon
The median family income in Yukon is $92,906, with families comprising 3+ earners (785) having the highest median family income of $114,497, while families with 1 earner (1,819) have the lowest median family income of $62,522, accounting for 12.1% and 28.0% of families, respectively.
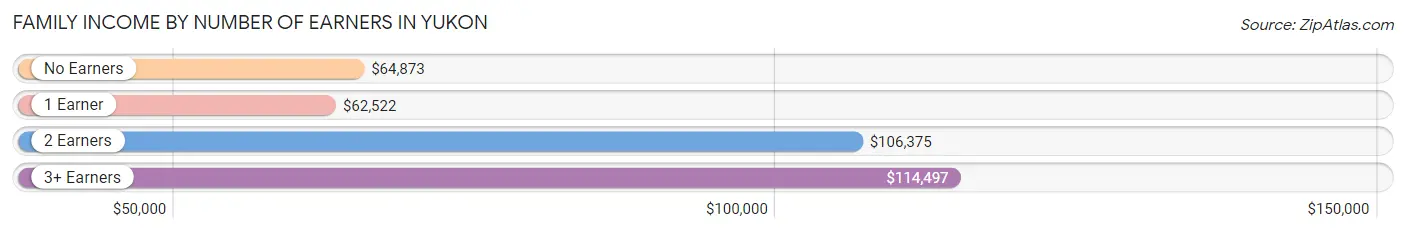
| Number of Earners | # Families | Median Income |
| No Earners | 1,089 (16.7%) | $64,873 |
| 1 Earner | 1,819 (28.0%) | $62,522 |
| 2 Earners | 2,814 (43.2%) | $106,375 |
| 3+ Earners | 785 (12.1%) | $114,497 |
| Total | 6,507 (100.0%) | $92,906 |
Household Income in Yukon
Household Income Brackets in Yukon
With 2,115 households falling in the category, the $100,000 to $149,999 income range is the most frequent in Yukon, accounting for 23.1% of all households. In contrast, only 156 households (1.7%) fall into the less than $10,000 income bracket, making it the least populous group.
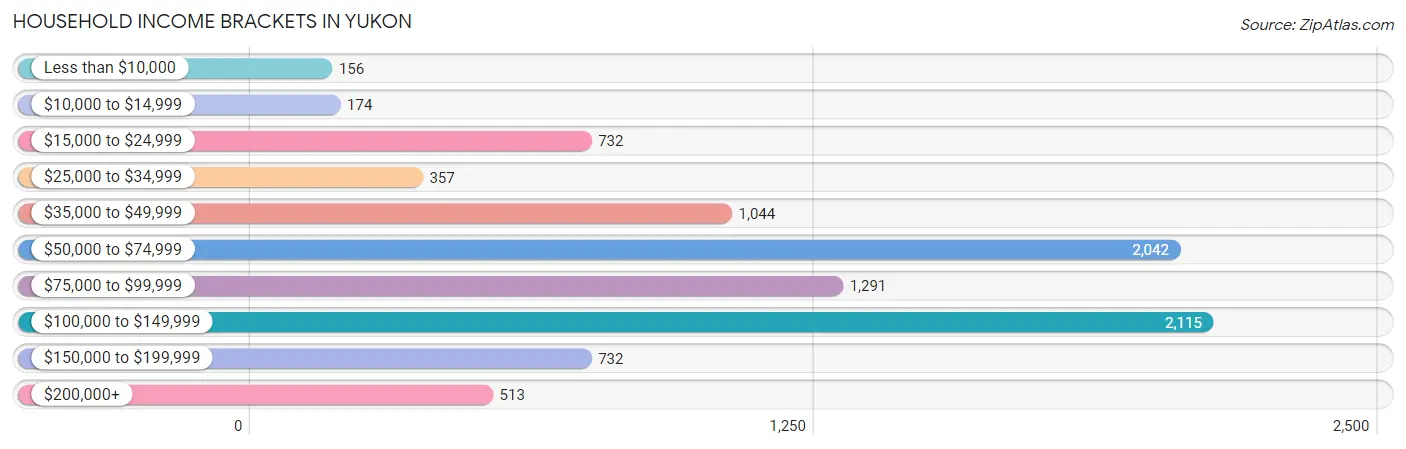
| Income Bracket | # Households | % Households |
| Less than $10,000 | 156 | 1.7% |
| $10,000 to $14,999 | 174 | 1.9% |
| $15,000 to $24,999 | 732 | 8.0% |
| $25,000 to $34,999 | 357 | 3.9% |
| $35,000 to $49,999 | 1,044 | 11.4% |
| $50,000 to $74,999 | 2,042 | 22.3% |
| $75,000 to $99,999 | 1,291 | 14.1% |
| $100,000 to $149,999 | 2,115 | 23.1% |
| $150,000 to $199,999 | 732 | 8.0% |
| $200,000+ | 513 | 5.6% |
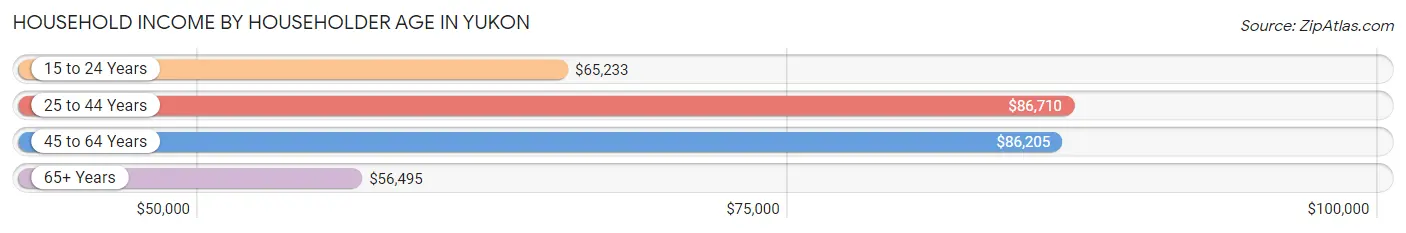
Household Income by Householder Age in Yukon
The median household income in Yukon is $75,865, with the highest median household income of $86,710 found in the 25 to 44 years age bracket for the primary householder. A total of 2,931 households (32.0%) fall into this category. Meanwhile, the 65+ years age bracket for the primary householder has the lowest median household income of $56,495, with 2,714 households (29.6%) in this group.
| Income Bracket | # Households | Median Income |
| 15 to 24 Years | 245 (2.7%) | $65,233 |
| 25 to 44 Years | 2,931 (32.0%) | $86,710 |
| 45 to 64 Years | 3,265 (35.7%) | $86,205 |
| 65+ Years | 2,714 (29.6%) | $56,495 |
| Total | 9,155 (100.0%) | $75,865 |
Poverty in Yukon
Income Below Poverty by Sex and Age in Yukon
With 8.6% poverty level for males and 8.1% for females among the residents of Yukon, 5 year old males and 16 and 17 year old females are the most vulnerable to poverty, with 80 males (32.9%) and 60 females (15.5%) in their respective age groups living below the poverty level.
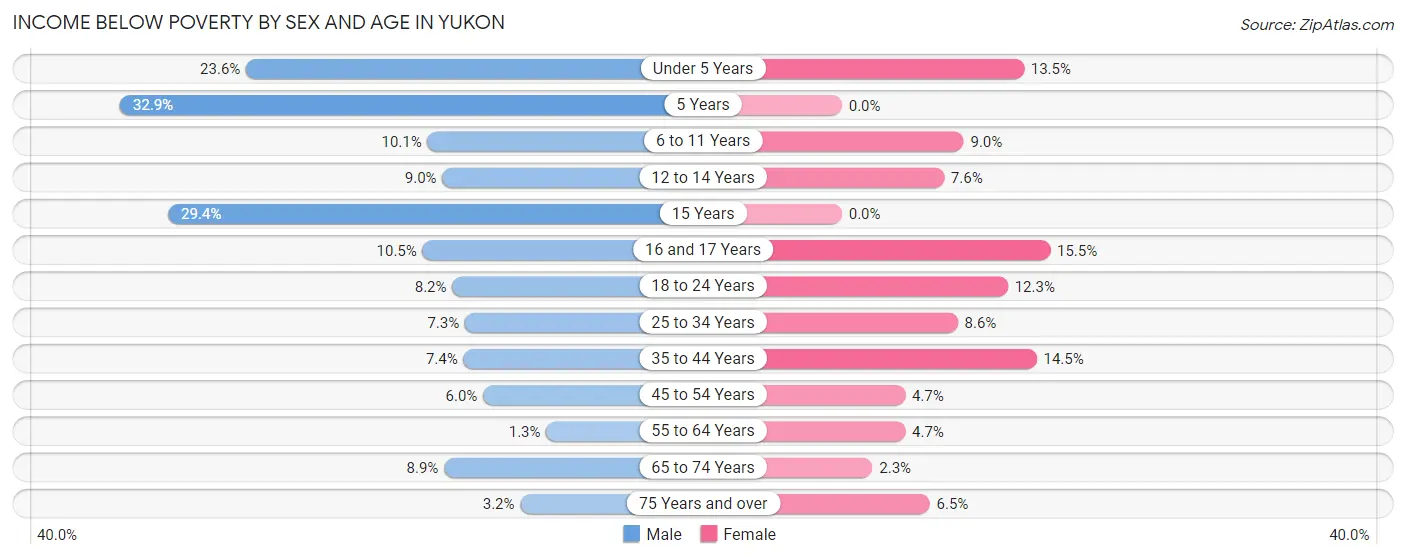
| Age Bracket | Male | Female |
| Under 5 Years | 162 (23.5%) | 85 (13.5%) |
| 5 Years | 80 (32.9%) | 0 (0.0%) |
| 6 to 11 Years | 104 (10.1%) | 70 (9.0%) |
| 12 to 14 Years | 37 (9.0%) | 32 (7.6%) |
| 15 Years | 54 (29.3%) | 0 (0.0%) |
| 16 and 17 Years | 28 (10.4%) | 60 (15.5%) |
| 18 to 24 Years | 84 (8.2%) | 126 (12.3%) |
| 25 to 34 Years | 106 (7.3%) | 143 (8.6%) |
| 35 to 44 Years | 129 (7.4%) | 219 (14.5%) |
| 45 to 54 Years | 76 (5.9%) | 68 (4.7%) |
| 55 to 64 Years | 19 (1.3%) | 65 (4.7%) |
| 65 to 74 Years | 126 (8.8%) | 30 (2.3%) |
| 75 Years and over | 22 (3.2%) | 59 (6.5%) |
| Total | 1,027 (8.6%) | 957 (8.1%) |
Income Above Poverty by Sex and Age in Yukon
According to the poverty statistics in Yukon, males aged 55 to 64 years and females aged 5 years are the age groups that are most secure financially, with 98.7% of males and 100.0% of females in these age groups living above the poverty line.
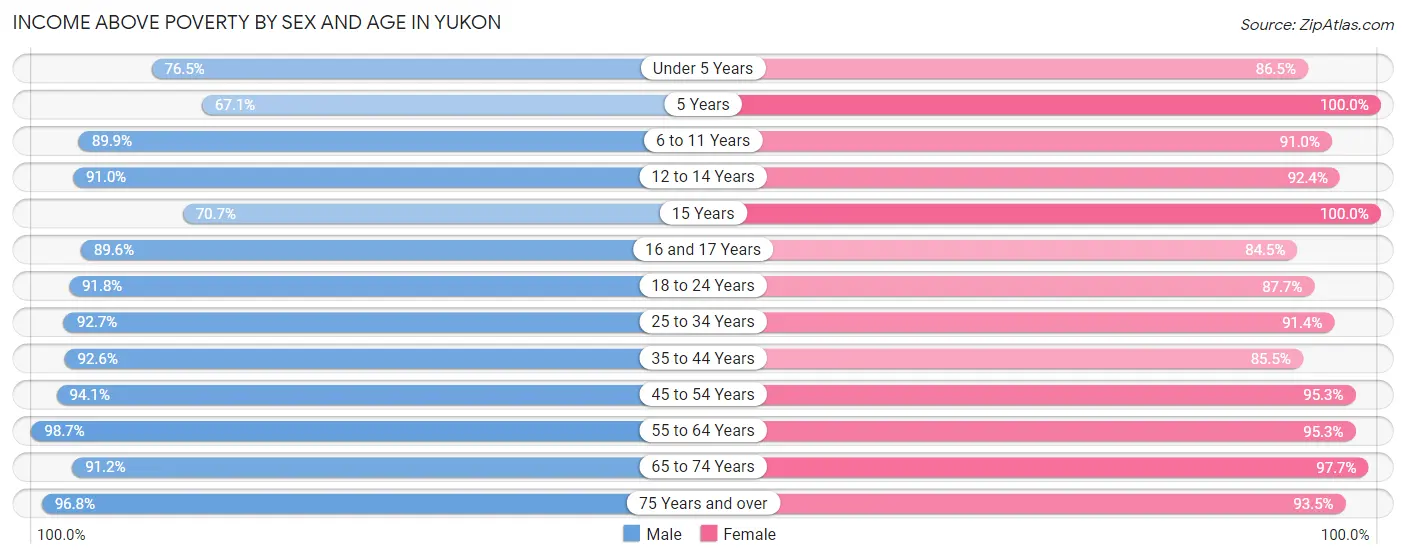
| Age Bracket | Male | Female |
| Under 5 Years | 526 (76.4%) | 544 (86.5%) |
| 5 Years | 163 (67.1%) | 188 (100.0%) |
| 6 to 11 Years | 928 (89.9%) | 704 (91.0%) |
| 12 to 14 Years | 375 (91.0%) | 390 (92.4%) |
| 15 Years | 130 (70.7%) | 177 (100.0%) |
| 16 and 17 Years | 240 (89.5%) | 328 (84.5%) |
| 18 to 24 Years | 935 (91.8%) | 897 (87.7%) |
| 25 to 34 Years | 1,347 (92.7%) | 1,519 (91.4%) |
| 35 to 44 Years | 1,611 (92.6%) | 1,295 (85.5%) |
| 45 to 54 Years | 1,202 (94.1%) | 1,381 (95.3%) |
| 55 to 64 Years | 1,493 (98.7%) | 1,317 (95.3%) |
| 65 to 74 Years | 1,298 (91.1%) | 1,292 (97.7%) |
| 75 Years and over | 667 (96.8%) | 846 (93.5%) |
| Total | 10,915 (91.4%) | 10,878 (91.9%) |
Income Below Poverty Among Married-Couple Families in Yukon
The poverty statistics for married-couple families in Yukon show that 2.1% or 107 of the total 5,068 families live below the poverty line. Families with 3 or 4 children have the highest poverty rate of 4.6%, comprising of 30 families. On the other hand, families with no children have the lowest poverty rate of 1.7%, which includes 53 families.
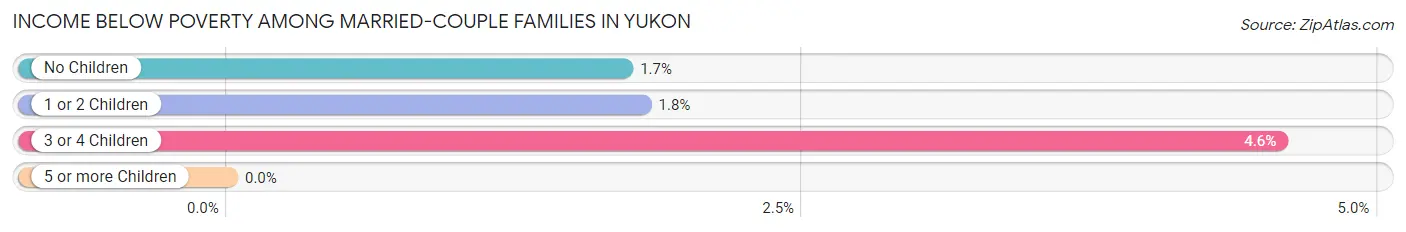
| Children | Above Poverty | Below Poverty |
| No Children | 3,025 (98.3%) | 53 (1.7%) |
| 1 or 2 Children | 1,309 (98.2%) | 24 (1.8%) |
| 3 or 4 Children | 627 (95.4%) | 30 (4.6%) |
| 5 or more Children | 0 (0.0%) | 0 (0.0%) |
| Total | 4,961 (97.9%) | 107 (2.1%) |
Income Below Poverty Among Single-Parent Households in Yukon
According to the poverty data in Yukon, 15.4% or 82 single-father households and 16.8% or 152 single-mother households are living below the poverty line. Among single-father households, those with 1 or 2 children have the highest poverty rate, with 82 households (29.0%) experiencing poverty. Likewise, among single-mother households, those with 3 or 4 children have the highest poverty rate, with 88 households (80.7%) falling below the poverty line.
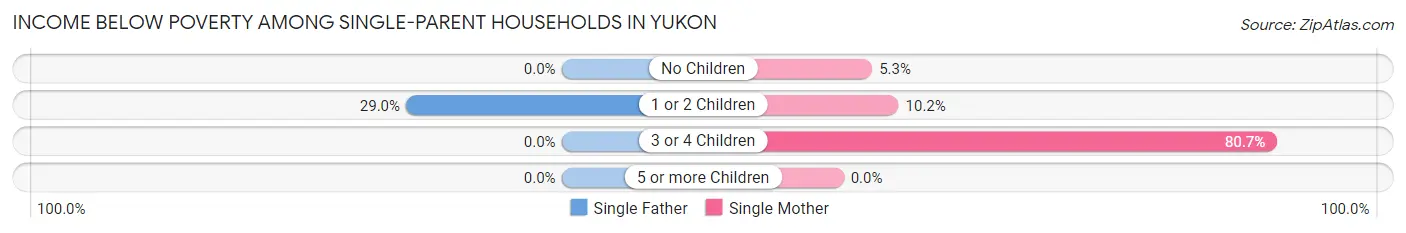
| Children | Single Father | Single Mother |
| No Children | 0 (0.0%) | 19 (5.3%) |
| 1 or 2 Children | 82 (29.0%) | 45 (10.2%) |
| 3 or 4 Children | 0 (0.0%) | 88 (80.7%) |
| 5 or more Children | 0 (0.0%) | 0 (0.0%) |
| Total | 82 (15.4%) | 152 (16.8%) |
Income Below Poverty Among Married-Couple vs Single-Parent Households in Yukon
The poverty data for Yukon shows that 107 of the married-couple family households (2.1%) and 234 of the single-parent households (16.3%) are living below the poverty level. Within the married-couple family households, those with 3 or 4 children have the highest poverty rate, with 30 households (4.6%) falling below the poverty line. Among the single-parent households, those with 3 or 4 children have the highest poverty rate, with 88 household (80.7%) living below poverty.
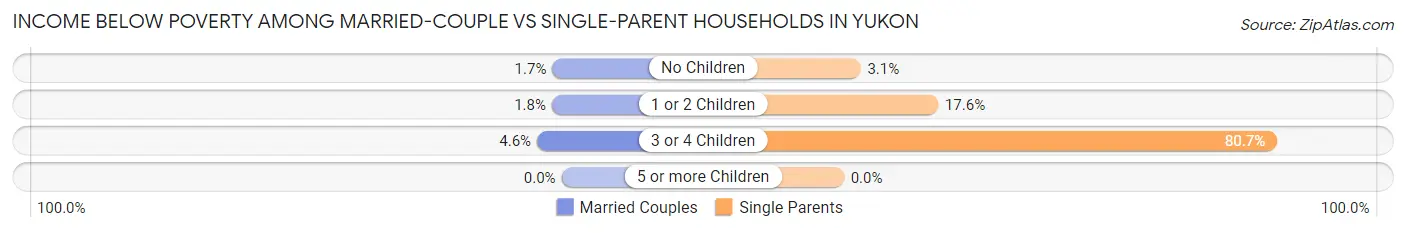
| Children | Married-Couple Families | Single-Parent Households |
| No Children | 53 (1.7%) | 19 (3.1%) |
| 1 or 2 Children | 24 (1.8%) | 127 (17.6%) |
| 3 or 4 Children | 30 (4.6%) | 88 (80.7%) |
| 5 or more Children | 0 (0.0%) | 0 (0.0%) |
| Total | 107 (2.1%) | 234 (16.3%) |
Race in Yukon
The most populous races in Yukon are White / Caucasian (20,005 | 82.7%), Two or more Races (2,279 | 9.4%), and Hispanic or Latino (2,264 | 9.4%).
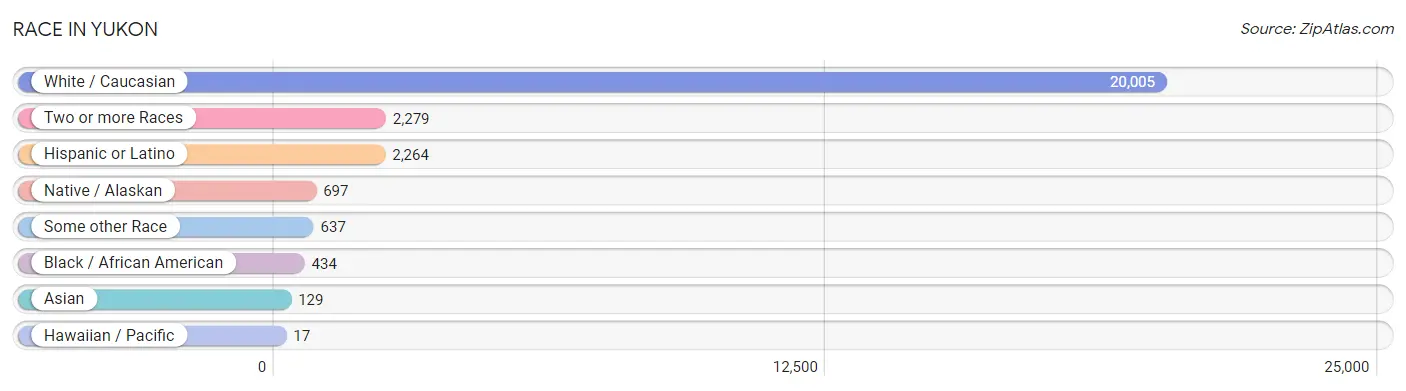
| Race | # Population | % Population |
| Asian | 129 | 0.5% |
| Black / African American | 434 | 1.8% |
| Hawaiian / Pacific | 17 | 0.1% |
| Hispanic or Latino | 2,264 | 9.4% |
| Native / Alaskan | 697 | 2.9% |
| White / Caucasian | 20,005 | 82.7% |
| Two or more Races | 2,279 | 9.4% |
| Some other Race | 637 | 2.6% |
| Total | 24,198 | 100.0% |
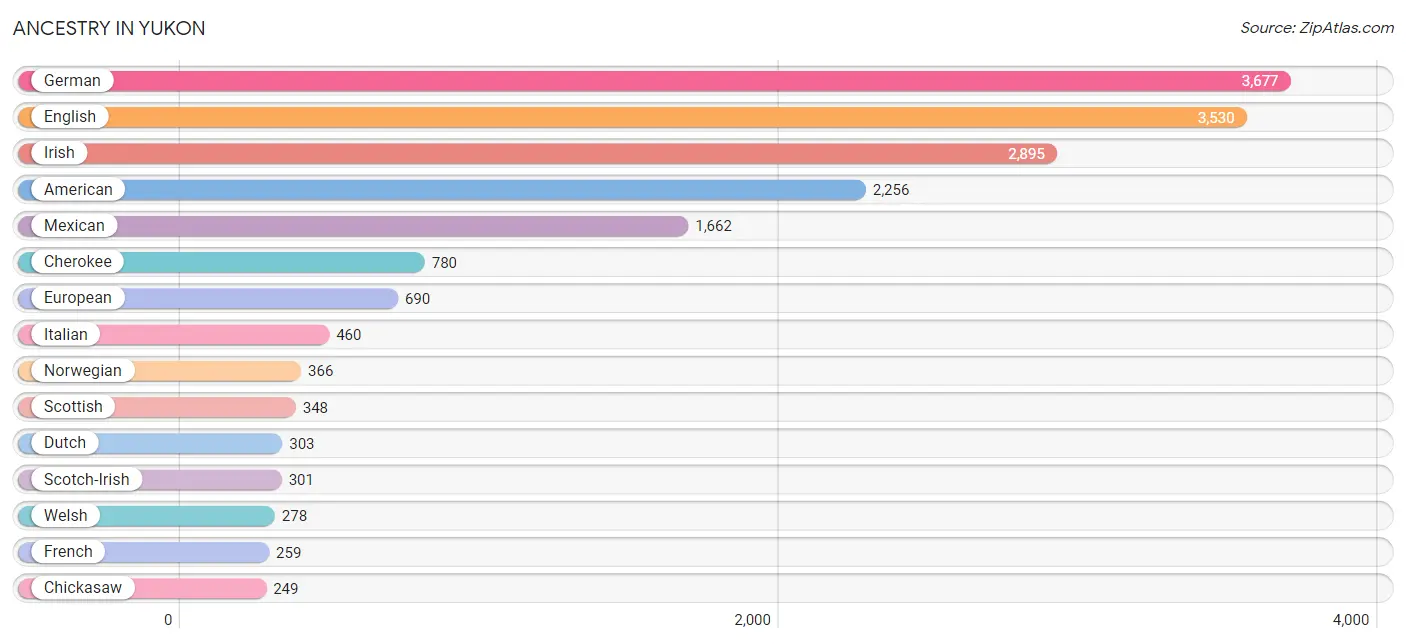
Ancestry in Yukon
The most populous ancestries reported in Yukon are German (3,677 | 15.2%), English (3,530 | 14.6%), Irish (2,895 | 12.0%), American (2,256 | 9.3%), and Mexican (1,662 | 6.9%), together accounting for 57.9% of all Yukon residents.
| Ancestry | # Population | % Population |
| Albanian | 40 | 0.2% |
| American | 2,256 | 9.3% |
| Arab | 44 | 0.2% |
| Australian | 34 | 0.1% |
| Austrian | 40 | 0.2% |
| Blackfeet | 47 | 0.2% |
| Brazilian | 6 | 0.0% |
| British | 224 | 0.9% |
| Burmese | 33 | 0.1% |
| Cajun | 17 | 0.1% |
| Canadian | 37 | 0.2% |
| Central American | 245 | 1.0% |
| Cherokee | 780 | 3.2% |
| Chickasaw | 249 | 1.0% |
| Chippewa | 10 | 0.0% |
| Choctaw | 201 | 0.8% |
| Colombian | 76 | 0.3% |
| Comanche | 4 | 0.0% |
| Creek | 45 | 0.2% |
| Czech | 116 | 0.5% |
| Czechoslovakian | 43 | 0.2% |
| Danish | 59 | 0.2% |
| Delaware | 26 | 0.1% |
| Dutch | 303 | 1.3% |
| Dutch West Indian | 4 | 0.0% |
| English | 3,530 | 14.6% |
| European | 690 | 2.9% |
| French | 259 | 1.1% |
| French Canadian | 67 | 0.3% |
| German | 3,677 | 15.2% |
| Greek | 28 | 0.1% |
| Guatemalan | 100 | 0.4% |
| Honduran | 52 | 0.2% |
| Iranian | 32 | 0.1% |
| Irish | 2,895 | 12.0% |
| Israeli | 11 | 0.1% |
| Italian | 460 | 1.9% |
| Kiowa | 6 | 0.0% |
| Korean | 34 | 0.1% |
| Lebanese | 25 | 0.1% |
| Malaysian | 182 | 0.7% |
| Mexican | 1,662 | 6.9% |
| Native Hawaiian | 22 | 0.1% |
| Northern European | 25 | 0.1% |
| Norwegian | 366 | 1.5% |
| Osage | 95 | 0.4% |
| Pakistani | 27 | 0.1% |
| Panamanian | 18 | 0.1% |
| Polish | 205 | 0.9% |
| Portuguese | 141 | 0.6% |
| Potawatomi | 32 | 0.1% |
| Puerto Rican | 71 | 0.3% |
| Russian | 58 | 0.2% |
| Salvadoran | 75 | 0.3% |
| Scandinavian | 107 | 0.4% |
| Scotch-Irish | 301 | 1.2% |
| Scottish | 348 | 1.4% |
| Seminole | 63 | 0.3% |
| Sioux | 12 | 0.1% |
| Slovak | 18 | 0.1% |
| South American | 76 | 0.3% |
| Spaniard | 60 | 0.3% |
| Spanish | 21 | 0.1% |
| Swedish | 66 | 0.3% |
| Swiss | 82 | 0.3% |
| Thai | 87 | 0.4% |
| Ukrainian | 21 | 0.1% |
| Welsh | 278 | 1.1% | View All 68 Rows |
Immigrants in Yukon
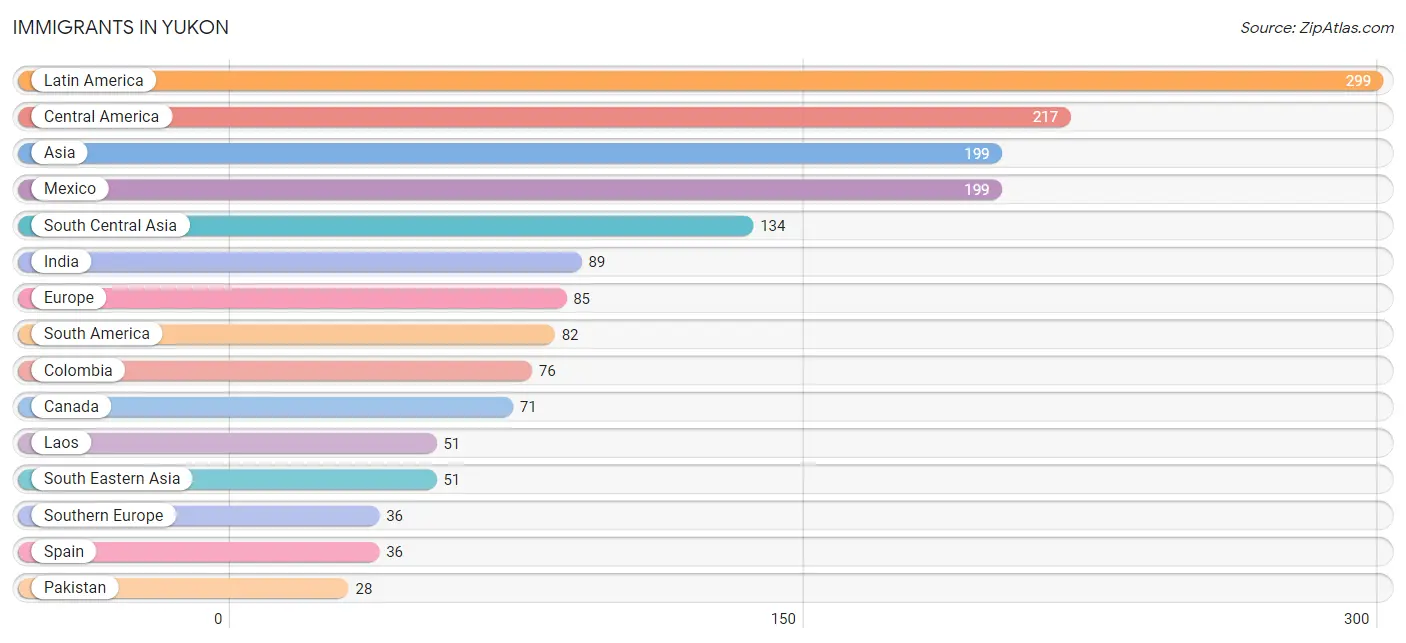
The most numerous immigrant groups reported in Yukon came from Latin America (299 | 1.2%), Central America (217 | 0.9%), Asia (199 | 0.8%), Mexico (199 | 0.8%), and South Central Asia (134 | 0.5%), together accounting for 4.3% of all Yukon residents.
| Immigration Origin | # Population | % Population |
| Africa | 22 | 0.1% |
| Asia | 199 | 0.8% |
| Australia | 14 | 0.1% |
| Brazil | 6 | 0.0% |
| Canada | 71 | 0.3% |
| Central America | 217 | 0.9% |
| Colombia | 76 | 0.3% |
| Eastern Asia | 14 | 0.1% |
| Eastern Europe | 26 | 0.1% |
| Europe | 85 | 0.4% |
| Germany | 23 | 0.1% |
| Guatemala | 18 | 0.1% |
| India | 89 | 0.4% |
| Iran | 17 | 0.1% |
| Korea | 14 | 0.1% |
| Laos | 51 | 0.2% |
| Latin America | 299 | 1.2% |
| Mexico | 199 | 0.8% |
| Morocco | 22 | 0.1% |
| Northern Africa | 22 | 0.1% |
| Oceania | 14 | 0.1% |
| Pakistan | 28 | 0.1% |
| Poland | 4 | 0.0% |
| Russia | 16 | 0.1% |
| South America | 82 | 0.3% |
| South Central Asia | 134 | 0.5% |
| South Eastern Asia | 51 | 0.2% |
| Southern Europe | 36 | 0.2% |
| Spain | 36 | 0.2% |
| Ukraine | 6 | 0.0% |
| Western Europe | 23 | 0.1% | View All 31 Rows |
Sex and Age in Yukon
Sex and Age in Yukon
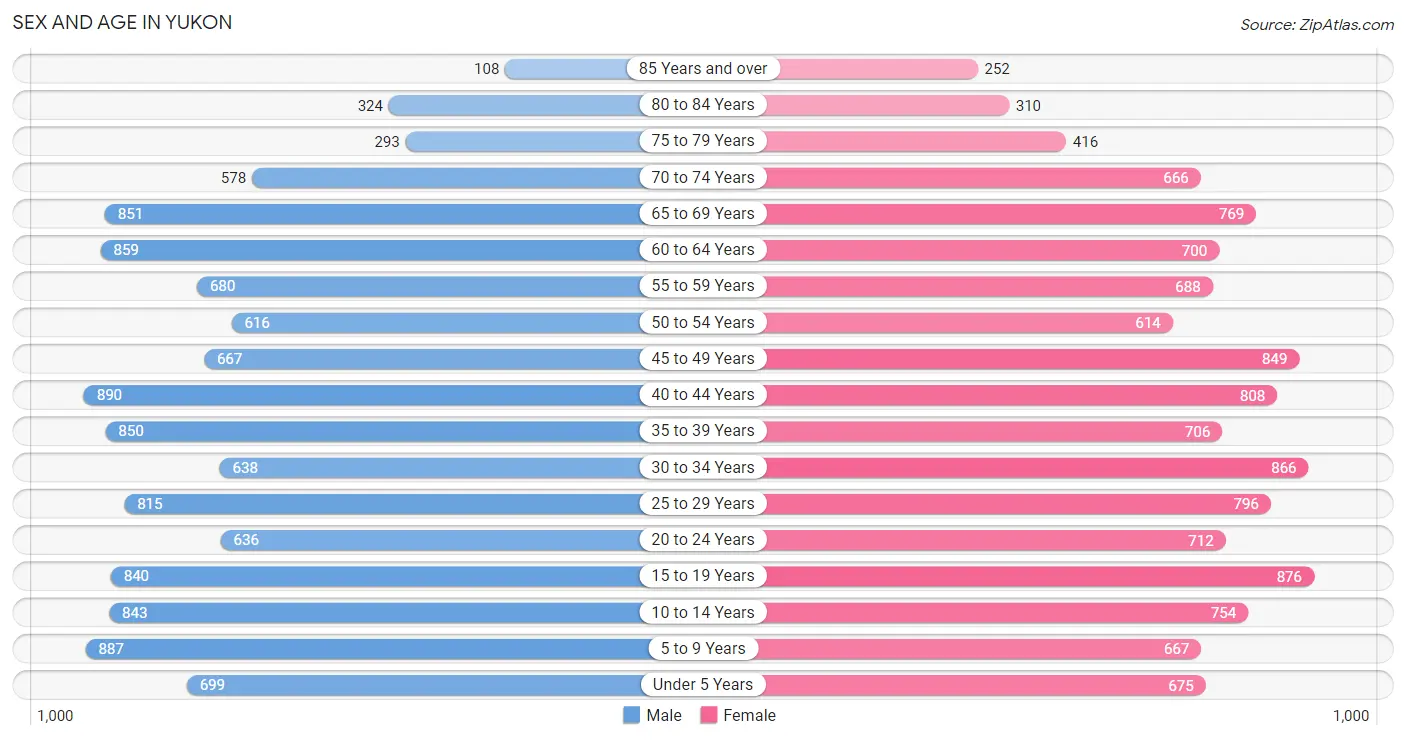
The most populous age groups in Yukon are 40 to 44 Years (890 | 7.4%) for men and 15 to 19 Years (876 | 7.2%) for women.
| Age Bracket | Male | Female |
| Under 5 Years | 699 (5.8%) | 675 (5.6%) |
| 5 to 9 Years | 887 (7.3%) | 667 (5.5%) |
| 10 to 14 Years | 843 (7.0%) | 754 (6.2%) |
| 15 to 19 Years | 840 (7.0%) | 876 (7.2%) |
| 20 to 24 Years | 636 (5.3%) | 712 (5.9%) |
| 25 to 29 Years | 815 (6.8%) | 796 (6.6%) |
| 30 to 34 Years | 638 (5.3%) | 866 (7.1%) |
| 35 to 39 Years | 850 (7.0%) | 706 (5.8%) |
| 40 to 44 Years | 890 (7.4%) | 808 (6.7%) |
| 45 to 49 Years | 667 (5.5%) | 849 (7.0%) |
| 50 to 54 Years | 616 (5.1%) | 614 (5.1%) |
| 55 to 59 Years | 680 (5.6%) | 688 (5.7%) |
| 60 to 64 Years | 859 (7.1%) | 700 (5.8%) |
| 65 to 69 Years | 851 (7.0%) | 769 (6.3%) |
| 70 to 74 Years | 578 (4.8%) | 666 (5.5%) |
| 75 to 79 Years | 293 (2.4%) | 416 (3.4%) |
| 80 to 84 Years | 324 (2.7%) | 310 (2.6%) |
| 85 Years and over | 108 (0.9%) | 252 (2.1%) |
| Total | 12,074 (100.0%) | 12,124 (100.0%) |
Families and Households in Yukon
Median Family Size in Yukon
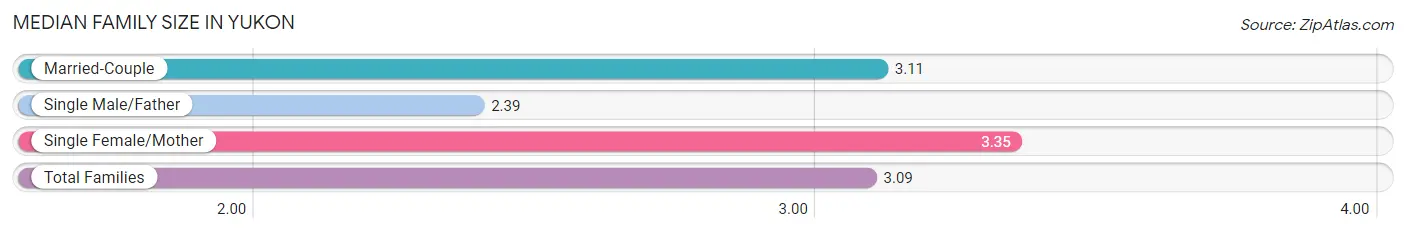
The median family size in Yukon is 3.09 persons per family, with single female/mother families (906 | 13.9%) accounting for the largest median family size of 3.35 persons per family. On the other hand, single male/father families (533 | 8.2%) represent the smallest median family size with 2.39 persons per family.
| Family Type | # Families | Family Size |
| Married-Couple | 5,068 (77.9%) | 3.11 |
| Single Male/Father | 533 (8.2%) | 2.39 |
| Single Female/Mother | 906 (13.9%) | 3.35 |
| Total Families | 6,507 (100.0%) | 3.09 |
Median Household Size in Yukon
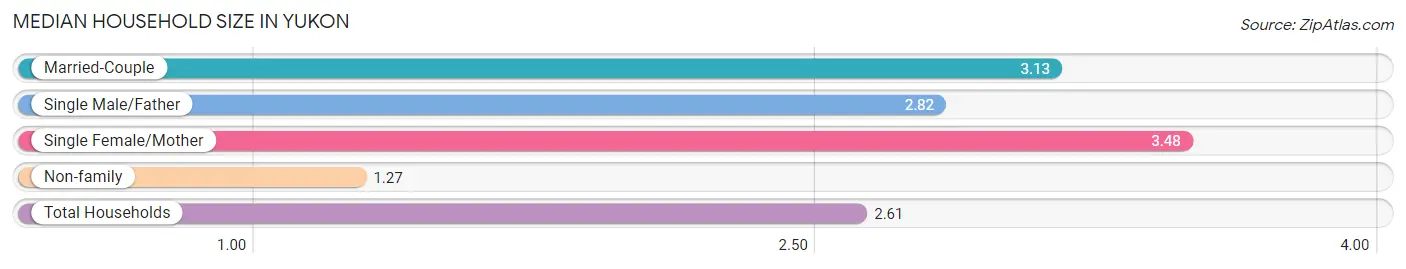
The median household size in Yukon is 2.61 persons per household, with single female/mother households (906 | 9.9%) accounting for the largest median household size of 3.48 persons per household. non-family households (2,648 | 28.9%) represent the smallest median household size with 1.27 persons per household.
| Household Type | # Households | Household Size |
| Married-Couple | 5,068 (55.4%) | 3.13 |
| Single Male/Father | 533 (5.8%) | 2.82 |
| Single Female/Mother | 906 (9.9%) | 3.48 |
| Non-family | 2,648 (28.9%) | 1.27 |
| Total Households | 9,155 (100.0%) | 2.61 |
Household Size by Marriage Status in Yukon
Out of a total of 9,155 households in Yukon, 6,507 (71.1%) are family households, while 2,648 (28.9%) are nonfamily households. The most numerous type of family households are 2-person households, comprising 3,211, and the most common type of nonfamily households are 1-person households, comprising 2,115.
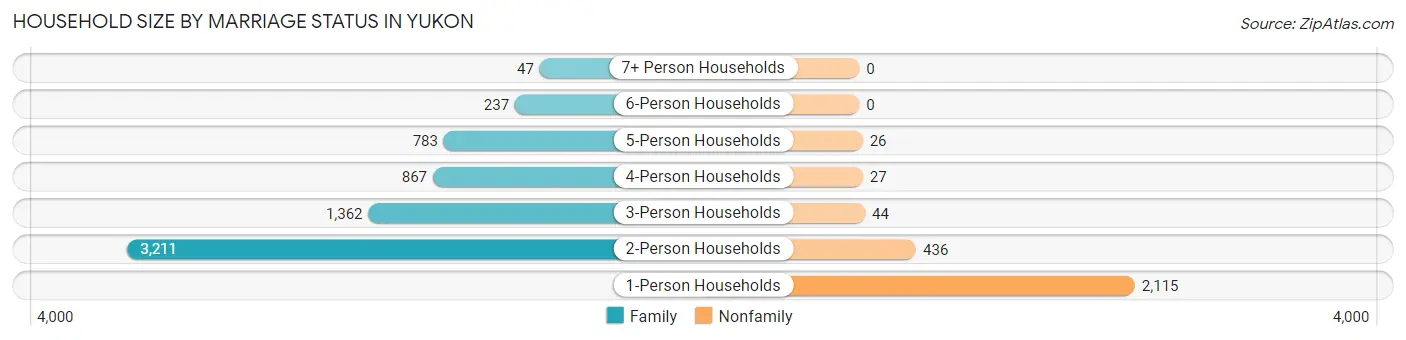
| Household Size | Family Households | Nonfamily Households |
| 1-Person Households | - | 2,115 (23.1%) |
| 2-Person Households | 3,211 (35.1%) | 436 (4.8%) |
| 3-Person Households | 1,362 (14.9%) | 44 (0.5%) |
| 4-Person Households | 867 (9.5%) | 27 (0.3%) |
| 5-Person Households | 783 (8.6%) | 26 (0.3%) |
| 6-Person Households | 237 (2.6%) | 0 (0.0%) |
| 7+ Person Households | 47 (0.5%) | 0 (0.0%) |
| Total | 6,507 (71.1%) | 2,648 (28.9%) |
Female Fertility in Yukon
Fertility by Age in Yukon
Average fertility rate in Yukon is 69.0 births per 1,000 women. Women in the age bracket of 20 to 34 years have the highest fertility rate with 134.0 births per 1,000 women. Women in the age bracket of 20 to 34 years acount for 80.9% of all women with births.
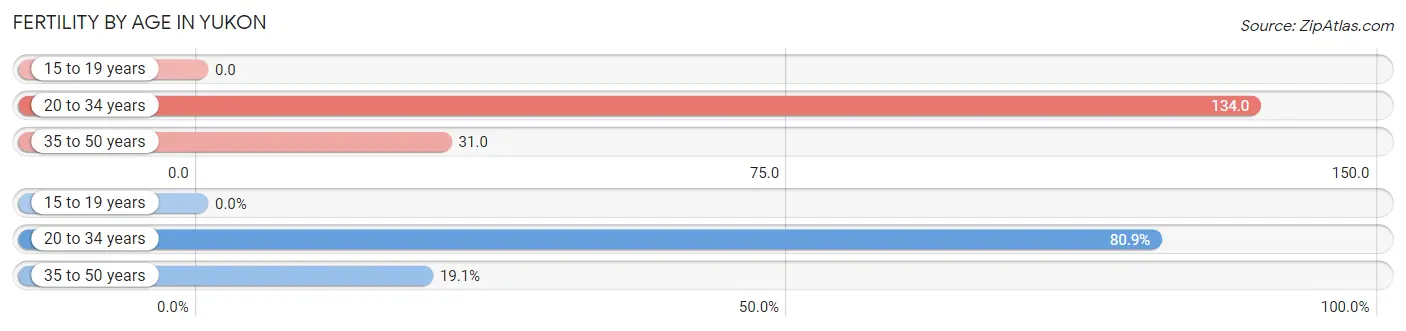
| Age Bracket | Women with Births | Births / 1,000 Women |
| 15 to 19 years | 0 (0.0%) | 0.0 |
| 20 to 34 years | 318 (80.9%) | 134.0 |
| 35 to 50 years | 75 (19.1%) | 31.0 |
| Total | 393 (100.0%) | 69.0 |
Fertility by Age by Marriage Status in Yukon
58.5% of women with births (393) in Yukon are married. The highest percentage of unmarried women with births falls into 35 to 50 years age bracket with 66.7% of them unmarried at the time of birth, while the lowest percentage of unmarried women with births belong to 20 to 34 years age bracket with 35.5% of them unmarried.
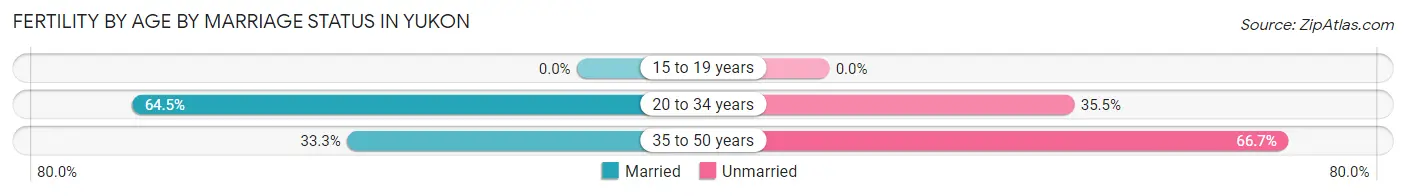
| Age Bracket | Married | Unmarried |
| 15 to 19 years | 0 (0.0%) | 0 (0.0%) |
| 20 to 34 years | 205 (64.5%) | 113 (35.5%) |
| 35 to 50 years | 25 (33.3%) | 50 (66.7%) |
| Total | 230 (58.5%) | 163 (41.5%) |
Fertility by Education in Yukon
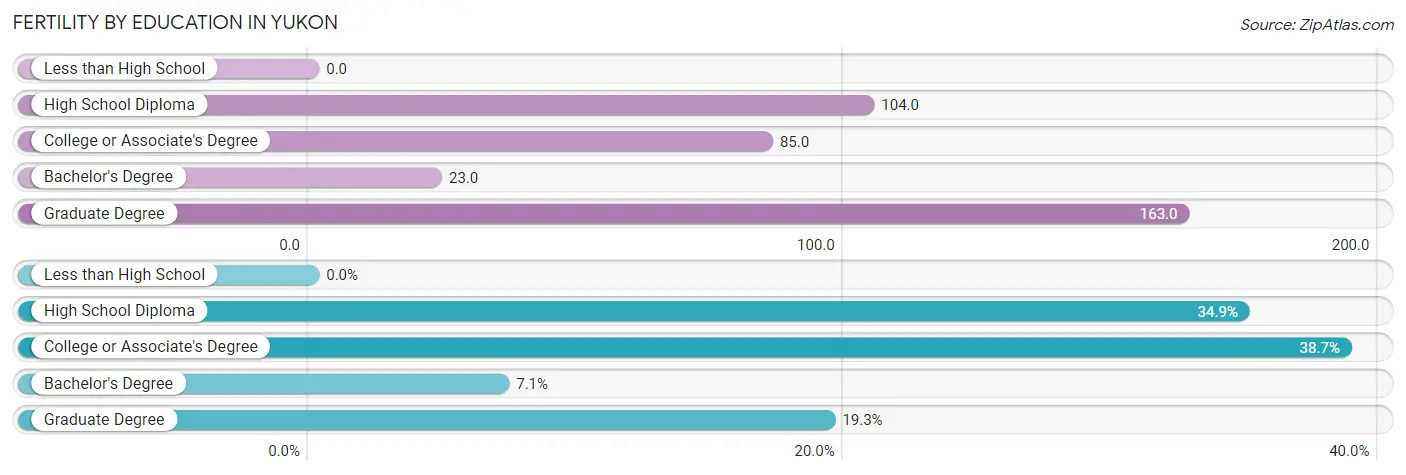
| Educational Attainment | Women with Births | Births / 1,000 Women |
| Less than High School | 0 (0.0%) | 0.0 |
| High School Diploma | 137 (34.9%) | 104.0 |
| College or Associate's Degree | 152 (38.7%) | 85.0 |
| Bachelor's Degree | 28 (7.1%) | 23.0 |
| Graduate Degree | 76 (19.3%) | 163.0 |
| Total | 393 (100.0%) | 69.0 |
Fertility by Education by Marriage Status in Yukon
41.5% of women with births in Yukon are unmarried. Women with the educational attainment of graduate degree are most likely to be married with 100.0% of them married at childbirth, while women with the educational attainment of high school diploma are least likely to be married with 72.3% of them unmarried at childbirth.
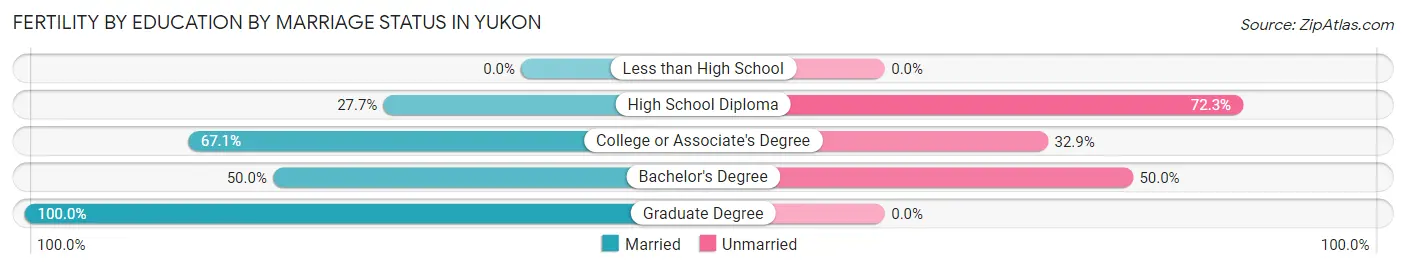
| Educational Attainment | Married | Unmarried |
| Less than High School | 0 (0.0%) | 0 (0.0%) |
| High School Diploma | 38 (27.7%) | 99 (72.3%) |
| College or Associate's Degree | 102 (67.1%) | 50 (32.9%) |
| Bachelor's Degree | 14 (50.0%) | 14 (50.0%) |
| Graduate Degree | 76 (100.0%) | 0 (0.0%) |
| Total | 230 (58.5%) | 163 (41.5%) |
Employment Characteristics in Yukon
Employment by Class of Employer in Yukon
Among the 12,105 employed individuals in Yukon, private company employees (8,329 | 68.8%), self-employed (not incorporated) (820 | 6.8%), and not-for-profit organizations (722 | 6.0%) make up the most common classes of employment.
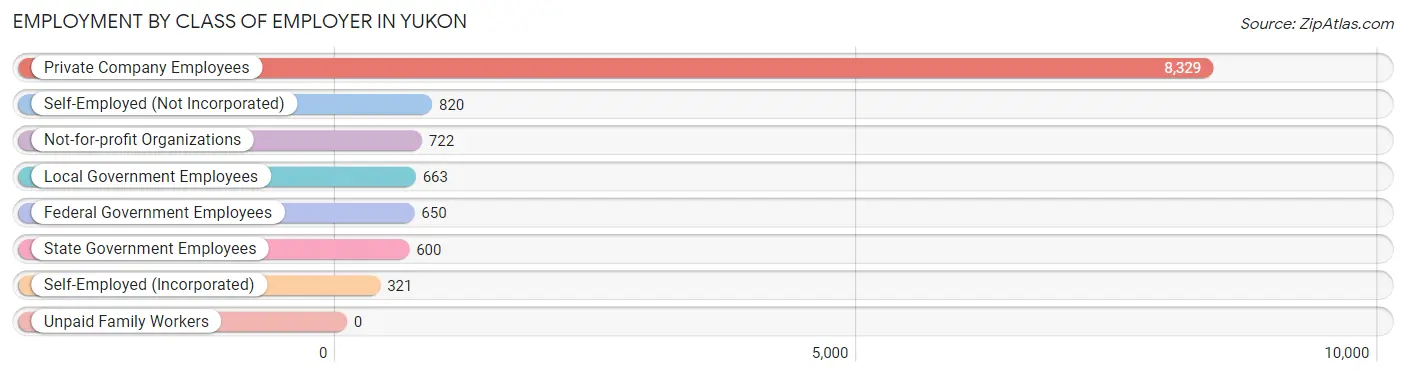
| Employer Class | # Employees | % Employees |
| Private Company Employees | 8,329 | 68.8% |
| Self-Employed (Incorporated) | 321 | 2.6% |
| Self-Employed (Not Incorporated) | 820 | 6.8% |
| Not-for-profit Organizations | 722 | 6.0% |
| Local Government Employees | 663 | 5.5% |
| State Government Employees | 600 | 5.0% |
| Federal Government Employees | 650 | 5.4% |
| Unpaid Family Workers | 0 | 0.0% |
| Total | 12,105 | 100.0% |
Employment Status by Age in Yukon
According to the labor force statistics for Yukon, out of the total population over 16 years of age (19,312), 66.2% or 12,785 individuals are in the labor force, with 4.0% or 511 of them unemployed. The age group with the highest labor force participation rate is 35 to 44 years, with 88.2% or 2,870 individuals in the labor force. Within the labor force, the 16 to 19 years age range has the highest percentage of unemployed individuals, with 20.3% or 133 of them being unemployed.
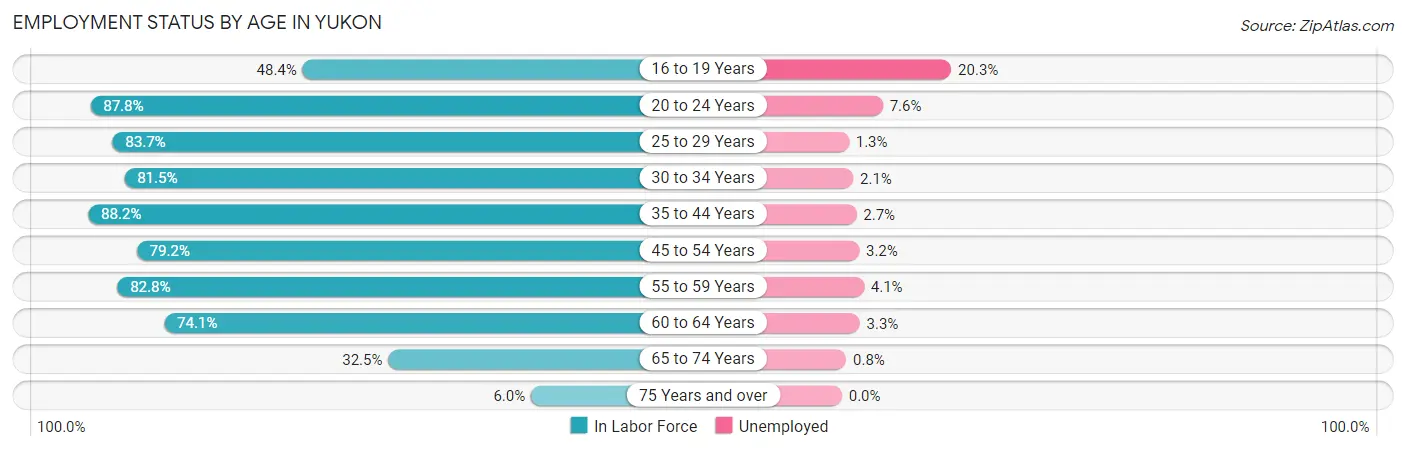
| Age Bracket | In Labor Force | Unemployed |
| 16 to 19 Years | 656 (48.4%) | 133 (20.3%) |
| 20 to 24 Years | 1,184 (87.8%) | 90 (7.6%) |
| 25 to 29 Years | 1,348 (83.7%) | 18 (1.3%) |
| 30 to 34 Years | 1,226 (81.5%) | 26 (2.1%) |
| 35 to 44 Years | 2,870 (88.2%) | 77 (2.7%) |
| 45 to 54 Years | 2,175 (79.2%) | 70 (3.2%) |
| 55 to 59 Years | 1,133 (82.8%) | 46 (4.1%) |
| 60 to 64 Years | 1,155 (74.1%) | 38 (3.3%) |
| 65 to 74 Years | 931 (32.5%) | 7 (0.8%) |
| 75 Years and over | 102 (6.0%) | 0 (0.0%) |
| Total | 12,785 (66.2%) | 511 (4.0%) |
Employment Status by Educational Attainment in Yukon
According to labor force statistics for Yukon, 82.3% of individuals (9,911) out of the total population between 25 and 64 years of age (12,042) are in the labor force, with 2.8% or 278 of them being unemployed. The group with the highest labor force participation rate are those with the educational attainment of bachelor's degree or higher, with 90.7% or 3,527 individuals in the labor force. Within the labor force, individuals with high school diploma education have the highest percentage of unemployment, with 5.7% or 149 of them being unemployed.
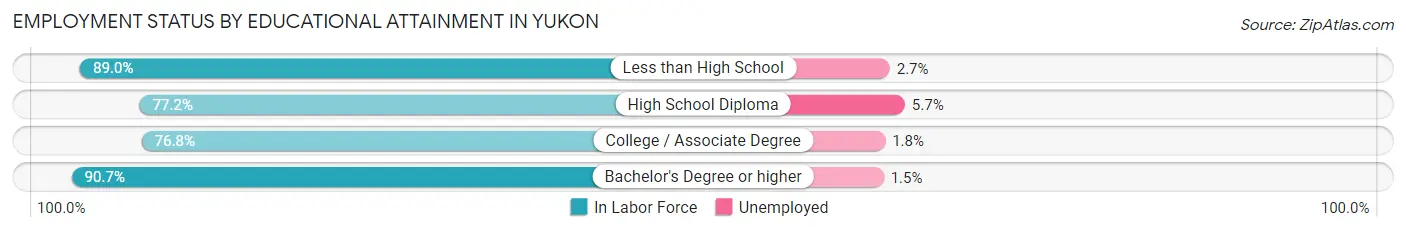
| Educational Attainment | In Labor Force | Unemployed |
| Less than High School | 790 (89.0%) | 24 (2.7%) |
| High School Diploma | 2,617 (77.2%) | 193 (5.7%) |
| College / Associate Degree | 2,976 (76.8%) | 70 (1.8%) |
| Bachelor's Degree or higher | 3,527 (90.7%) | 58 (1.5%) |
| Total | 9,911 (82.3%) | 337 (2.8%) |
Employment Occupations by Sex in Yukon
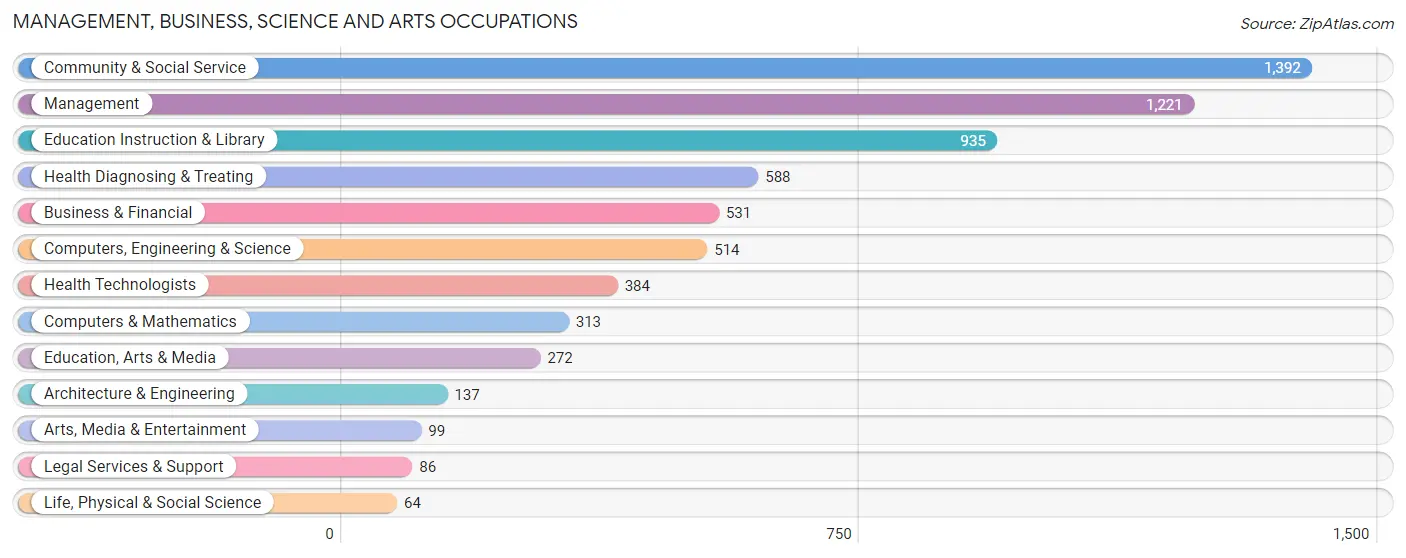
Management, Business, Science and Arts Occupations
The most common Management, Business, Science and Arts occupations in Yukon are Community & Social Service (1,392 | 11.4%), Management (1,221 | 10.0%), Education Instruction & Library (935 | 7.6%), Health Diagnosing & Treating (588 | 4.8%), and Business & Financial (531 | 4.3%).
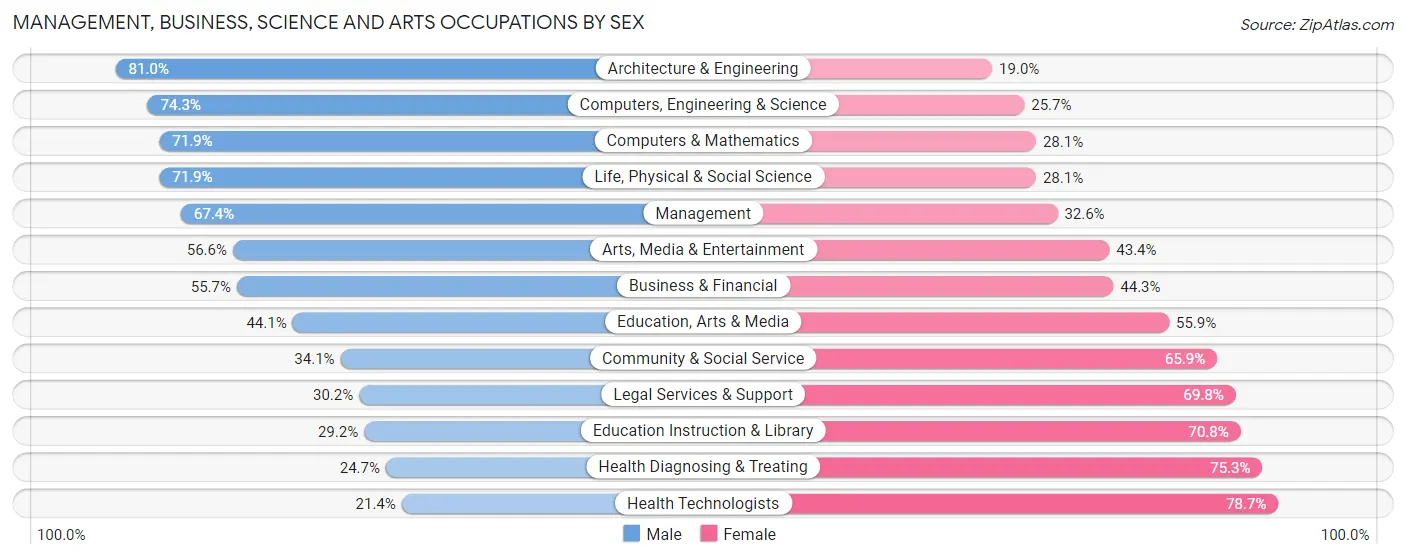
Management, Business, Science and Arts Occupations by Sex
Within the Management, Business, Science and Arts occupations in Yukon, the most male-oriented occupations are Architecture & Engineering (81.0%), Computers, Engineering & Science (74.3%), and Computers & Mathematics (71.9%), while the most female-oriented occupations are Health Technologists (78.6%), Health Diagnosing & Treating (75.3%), and Education Instruction & Library (70.8%).
| Occupation | Male | Female |
| Management | 823 (67.4%) | 398 (32.6%) |
| Business & Financial | 296 (55.7%) | 235 (44.3%) |
| Computers, Engineering & Science | 382 (74.3%) | 132 (25.7%) |
| Computers & Mathematics | 225 (71.9%) | 88 (28.1%) |
| Architecture & Engineering | 111 (81.0%) | 26 (19.0%) |
| Life, Physical & Social Science | 46 (71.9%) | 18 (28.1%) |
| Community & Social Service | 475 (34.1%) | 917 (65.9%) |
| Education, Arts & Media | 120 (44.1%) | 152 (55.9%) |
| Legal Services & Support | 26 (30.2%) | 60 (69.8%) |
| Education Instruction & Library | 273 (29.2%) | 662 (70.8%) |
| Arts, Media & Entertainment | 56 (56.6%) | 43 (43.4%) |
| Health Diagnosing & Treating | 145 (24.7%) | 443 (75.3%) |
| Health Technologists | 82 (21.3%) | 302 (78.6%) |
| Total (Category) | 2,121 (49.9%) | 2,125 (50.0%) |
| Total (Overall) | 6,538 (53.4%) | 5,712 (46.6%) |
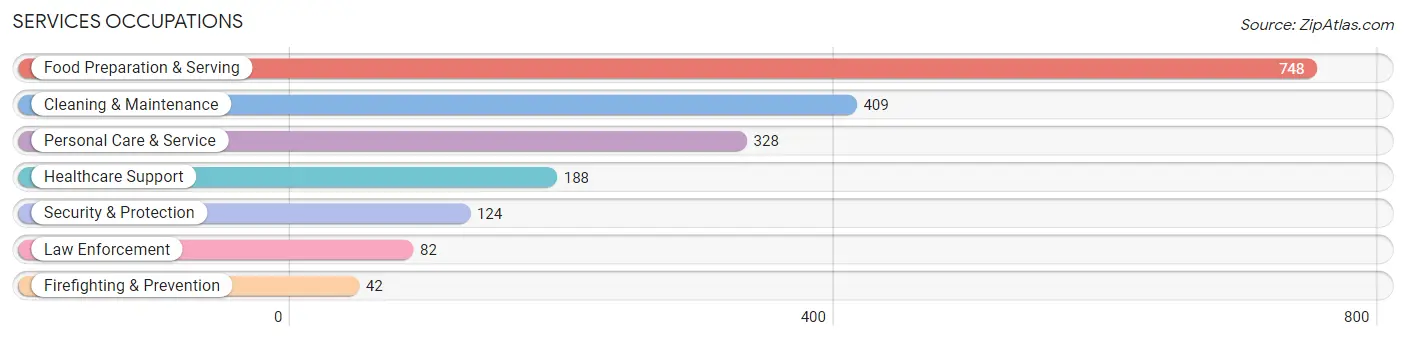
Services Occupations
The most common Services occupations in Yukon are Food Preparation & Serving (748 | 6.1%), Cleaning & Maintenance (409 | 3.3%), Personal Care & Service (328 | 2.7%), Healthcare Support (188 | 1.5%), and Security & Protection (124 | 1.0%).
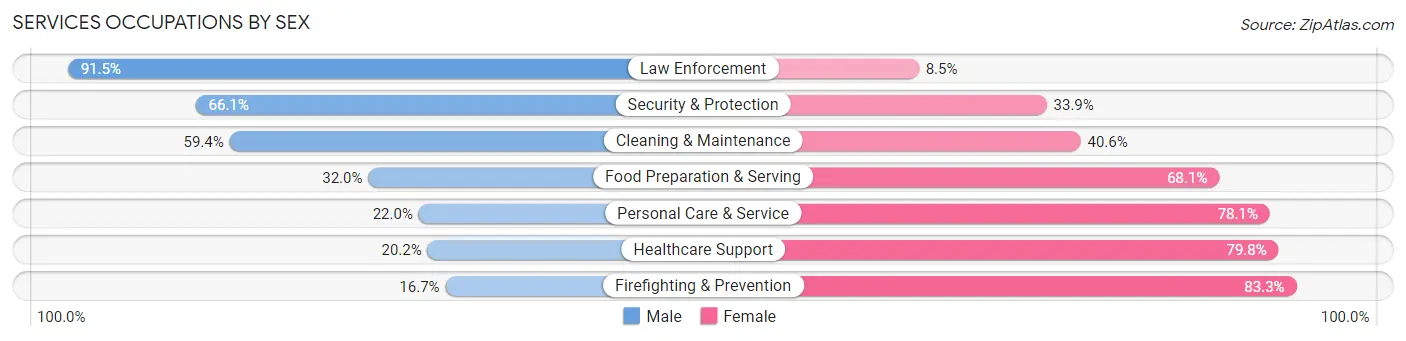
Services Occupations by Sex
Within the Services occupations in Yukon, the most male-oriented occupations are Law Enforcement (91.5%), Security & Protection (66.1%), and Cleaning & Maintenance (59.4%), while the most female-oriented occupations are Firefighting & Prevention (83.3%), Healthcare Support (79.8%), and Personal Care & Service (78.0%).
| Occupation | Male | Female |
| Healthcare Support | 38 (20.2%) | 150 (79.8%) |
| Security & Protection | 82 (66.1%) | 42 (33.9%) |
| Firefighting & Prevention | 7 (16.7%) | 35 (83.3%) |
| Law Enforcement | 75 (91.5%) | 7 (8.5%) |
| Food Preparation & Serving | 239 (32.0%) | 509 (68.0%) |
| Cleaning & Maintenance | 243 (59.4%) | 166 (40.6%) |
| Personal Care & Service | 72 (22.0%) | 256 (78.0%) |
| Total (Category) | 674 (37.5%) | 1,123 (62.5%) |
| Total (Overall) | 6,538 (53.4%) | 5,712 (46.6%) |
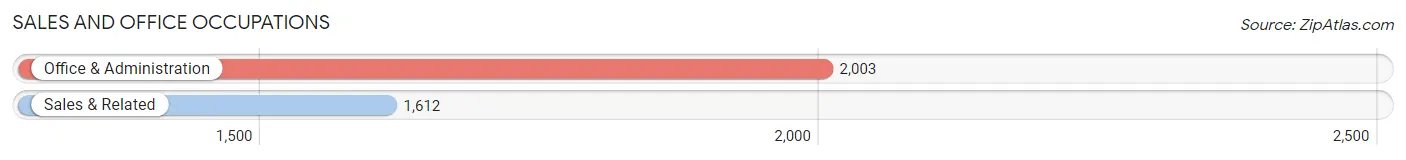
Sales and Office Occupations
The most common Sales and Office occupations in Yukon are Office & Administration (2,003 | 16.4%), and Sales & Related (1,612 | 13.2%).
Sales and Office Occupations by Sex
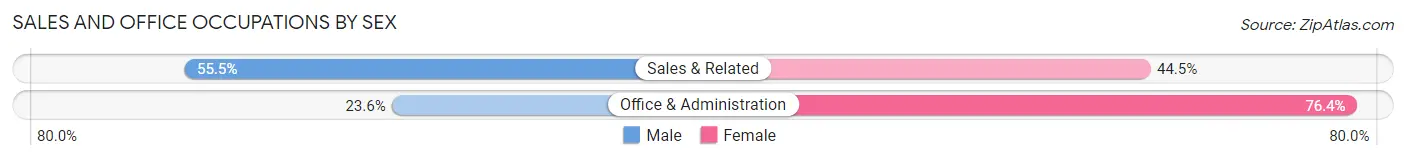
| Occupation | Male | Female |
| Sales & Related | 894 (55.5%) | 718 (44.5%) |
| Office & Administration | 472 (23.6%) | 1,531 (76.4%) |
| Total (Category) | 1,366 (37.8%) | 2,249 (62.2%) |
| Total (Overall) | 6,538 (53.4%) | 5,712 (46.6%) |
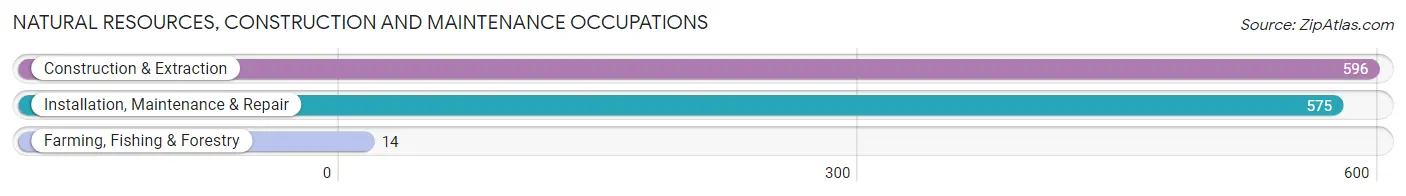
Natural Resources, Construction and Maintenance Occupations
The most common Natural Resources, Construction and Maintenance occupations in Yukon are Construction & Extraction (596 | 4.9%), Installation, Maintenance & Repair (575 | 4.7%), and Farming, Fishing & Forestry (14 | 0.1%).
Natural Resources, Construction and Maintenance Occupations by Sex
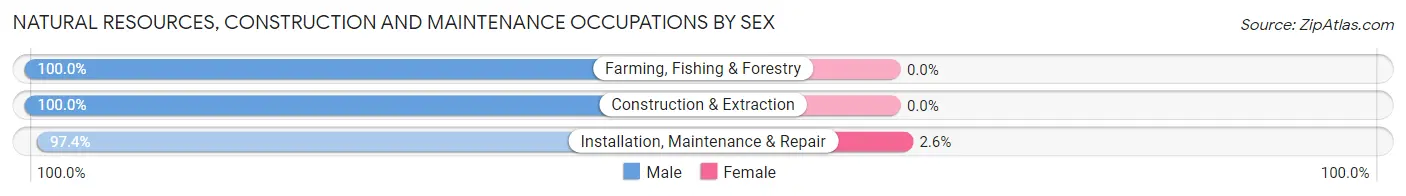
| Occupation | Male | Female |
| Farming, Fishing & Forestry | 14 (100.0%) | 0 (0.0%) |
| Construction & Extraction | 596 (100.0%) | 0 (0.0%) |
| Installation, Maintenance & Repair | 560 (97.4%) | 15 (2.6%) |
| Total (Category) | 1,170 (98.7%) | 15 (1.3%) |
| Total (Overall) | 6,538 (53.4%) | 5,712 (46.6%) |
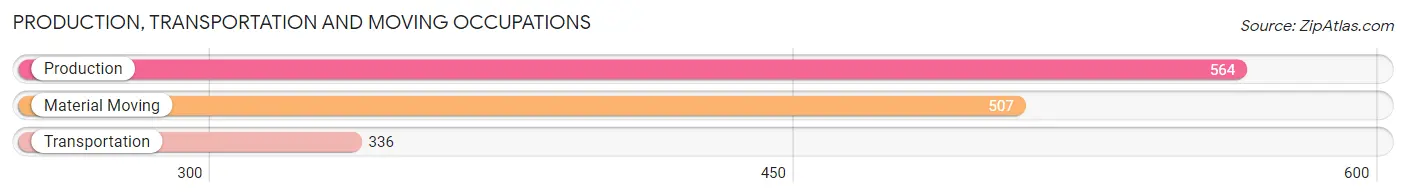
Production, Transportation and Moving Occupations
The most common Production, Transportation and Moving occupations in Yukon are Production (564 | 4.6%), Material Moving (507 | 4.1%), and Transportation (336 | 2.7%).
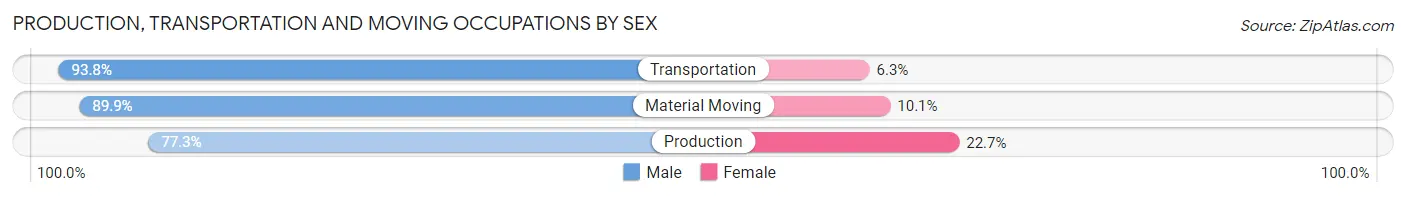
Production, Transportation and Moving Occupations by Sex
| Occupation | Male | Female |
| Production | 436 (77.3%) | 128 (22.7%) |
| Transportation | 315 (93.8%) | 21 (6.2%) |
| Material Moving | 456 (89.9%) | 51 (10.1%) |
| Total (Category) | 1,207 (85.8%) | 200 (14.2%) |
| Total (Overall) | 6,538 (53.4%) | 5,712 (46.6%) |
Employment Industries by Sex in Yukon
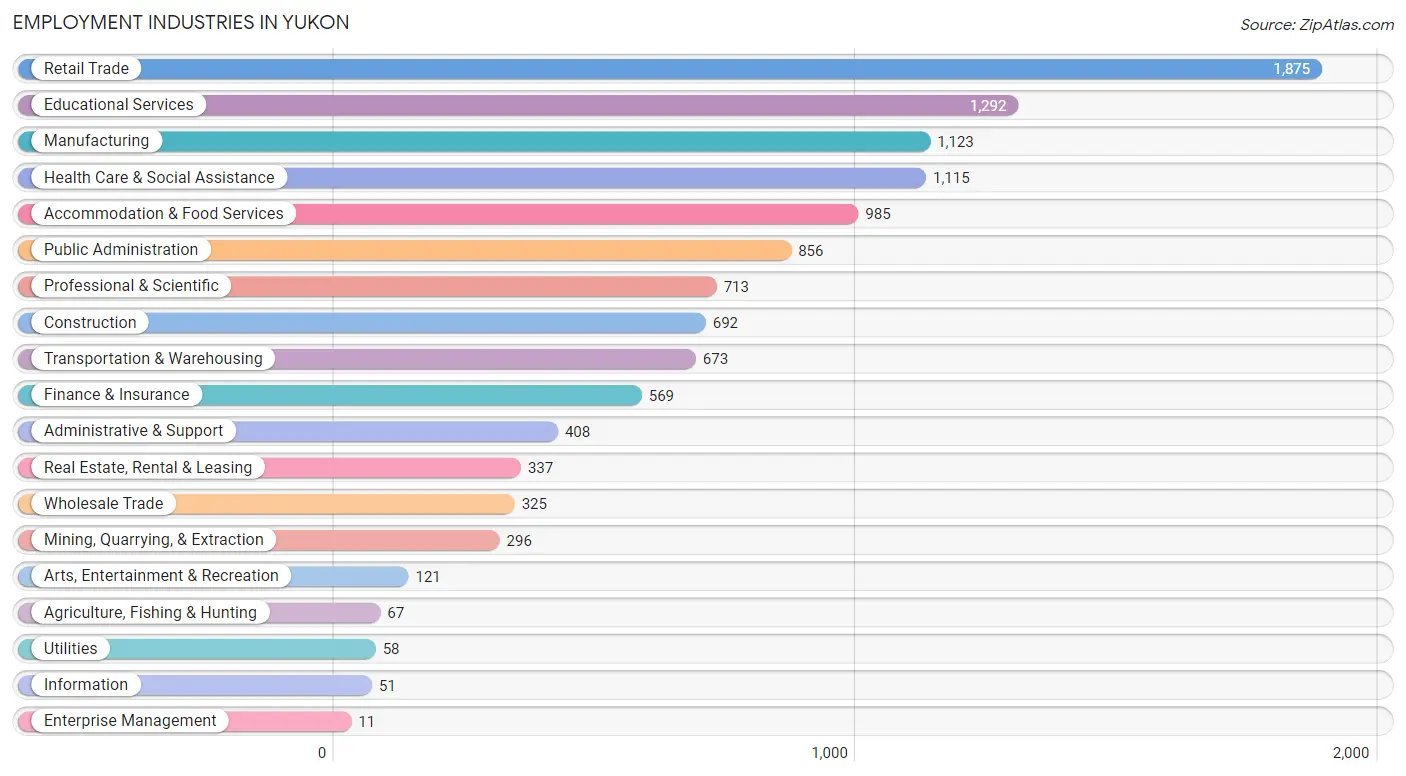
Employment Industries in Yukon
The major employment industries in Yukon include Retail Trade (1,875 | 15.3%), Educational Services (1,292 | 10.5%), Manufacturing (1,123 | 9.2%), Health Care & Social Assistance (1,115 | 9.1%), and Accommodation & Food Services (985 | 8.0%).
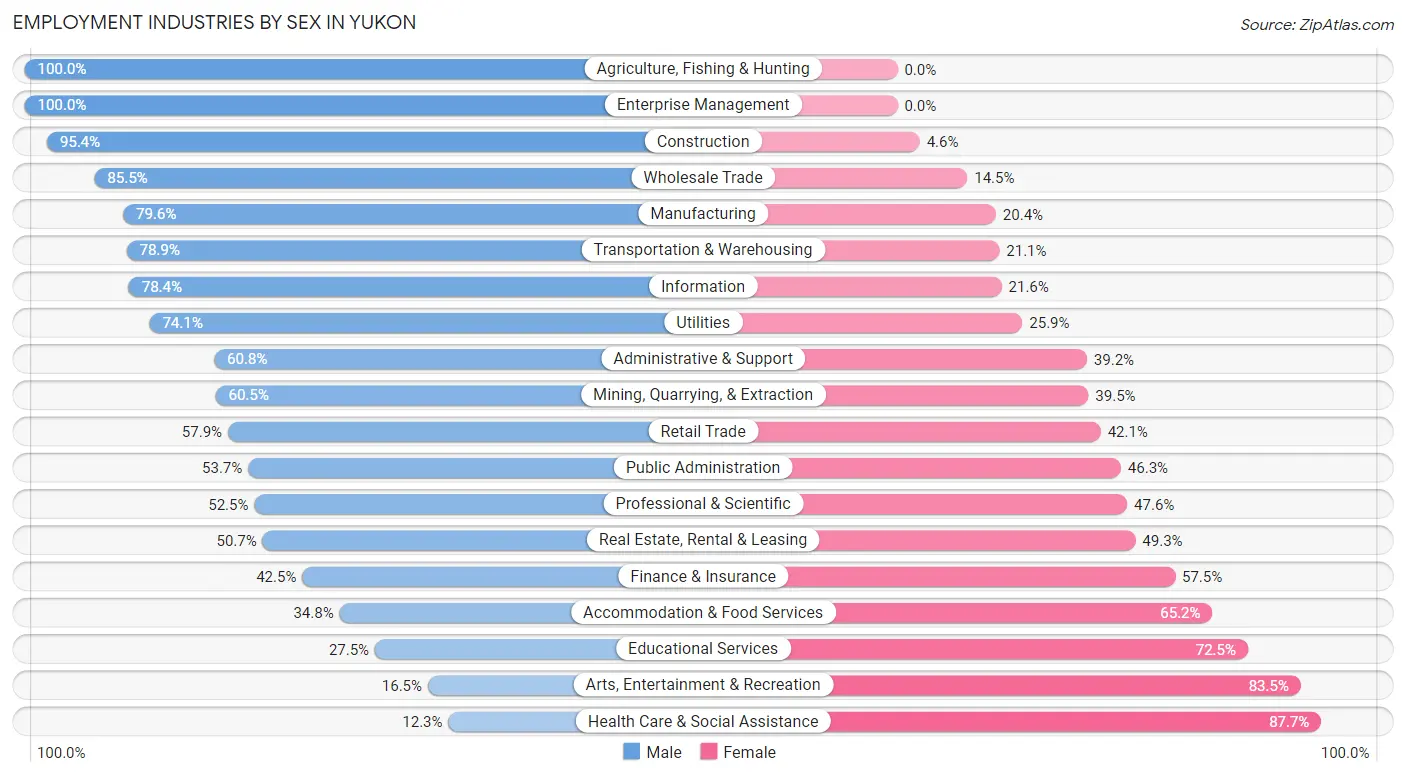
Employment Industries by Sex in Yukon
The Yukon industries that see more men than women are Agriculture, Fishing & Hunting (100.0%), Enterprise Management (100.0%), and Construction (95.4%), whereas the industries that tend to have a higher number of women are Health Care & Social Assistance (87.7%), Arts, Entertainment & Recreation (83.5%), and Educational Services (72.5%).
| Industry | Male | Female |
| Agriculture, Fishing & Hunting | 67 (100.0%) | 0 (0.0%) |
| Mining, Quarrying, & Extraction | 179 (60.5%) | 117 (39.5%) |
| Construction | 660 (95.4%) | 32 (4.6%) |
| Manufacturing | 894 (79.6%) | 229 (20.4%) |
| Wholesale Trade | 278 (85.5%) | 47 (14.5%) |
| Retail Trade | 1,086 (57.9%) | 789 (42.1%) |
| Transportation & Warehousing | 531 (78.9%) | 142 (21.1%) |
| Utilities | 43 (74.1%) | 15 (25.9%) |
| Information | 40 (78.4%) | 11 (21.6%) |
| Finance & Insurance | 242 (42.5%) | 327 (57.5%) |
| Real Estate, Rental & Leasing | 171 (50.7%) | 166 (49.3%) |
| Professional & Scientific | 374 (52.4%) | 339 (47.5%) |
| Enterprise Management | 11 (100.0%) | 0 (0.0%) |
| Administrative & Support | 248 (60.8%) | 160 (39.2%) |
| Educational Services | 355 (27.5%) | 937 (72.5%) |
| Health Care & Social Assistance | 137 (12.3%) | 978 (87.7%) |
| Arts, Entertainment & Recreation | 20 (16.5%) | 101 (83.5%) |
| Accommodation & Food Services | 343 (34.8%) | 642 (65.2%) |
| Public Administration | 460 (53.7%) | 396 (46.3%) |
| Total | 6,538 (53.4%) | 5,712 (46.6%) |
Education in Yukon
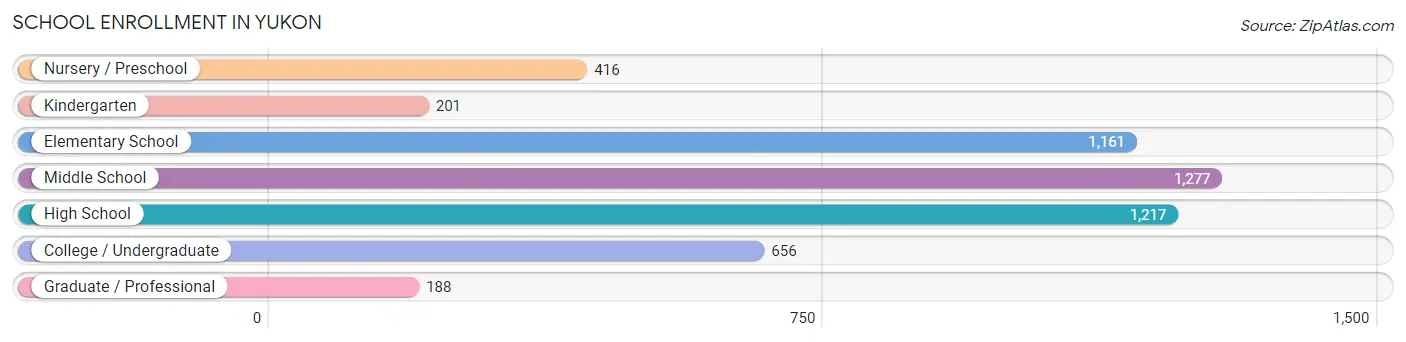
School Enrollment in Yukon
The most common levels of schooling among the 5,116 students in Yukon are middle school (1,277 | 25.0%), high school (1,217 | 23.8%), and elementary school (1,161 | 22.7%).
| School Level | # Students | % Students |
| Nursery / Preschool | 416 | 8.1% |
| Kindergarten | 201 | 3.9% |
| Elementary School | 1,161 | 22.7% |
| Middle School | 1,277 | 25.0% |
| High School | 1,217 | 23.8% |
| College / Undergraduate | 656 | 12.8% |
| Graduate / Professional | 188 | 3.7% |
| Total | 5,116 | 100.0% |
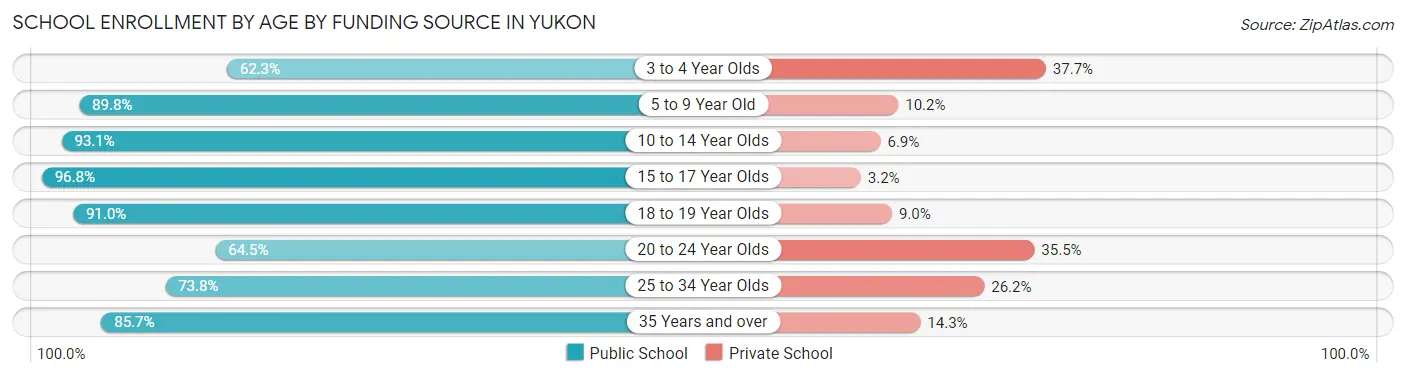
School Enrollment by Age by Funding Source in Yukon
Out of a total of 5,116 students who are enrolled in schools in Yukon, 578 (11.3%) attend a private institution, while the remaining 4,538 (88.7%) are enrolled in public schools. The age group of 3 to 4 year olds has the highest likelihood of being enrolled in private schools, with 84 (37.7% in the age bracket) enrolled. Conversely, the age group of 15 to 17 year olds has the lowest likelihood of being enrolled in a private school, with 908 (96.8% in the age bracket) attending a public institution.
| Age Bracket | Public School | Private School |
| 3 to 4 Year Olds | 139 (62.3%) | 84 (37.7%) |
| 5 to 9 Year Old | 1,237 (89.8%) | 140 (10.2%) |
| 10 to 14 Year Olds | 1,424 (93.1%) | 105 (6.9%) |
| 15 to 17 Year Olds | 908 (96.8%) | 30 (3.2%) |
| 18 to 19 Year Olds | 323 (91.0%) | 32 (9.0%) |
| 20 to 24 Year Olds | 127 (64.5%) | 70 (35.5%) |
| 25 to 34 Year Olds | 279 (73.8%) | 99 (26.2%) |
| 35 Years and over | 102 (85.7%) | 17 (14.3%) |
| Total | 4,538 (88.7%) | 578 (11.3%) |
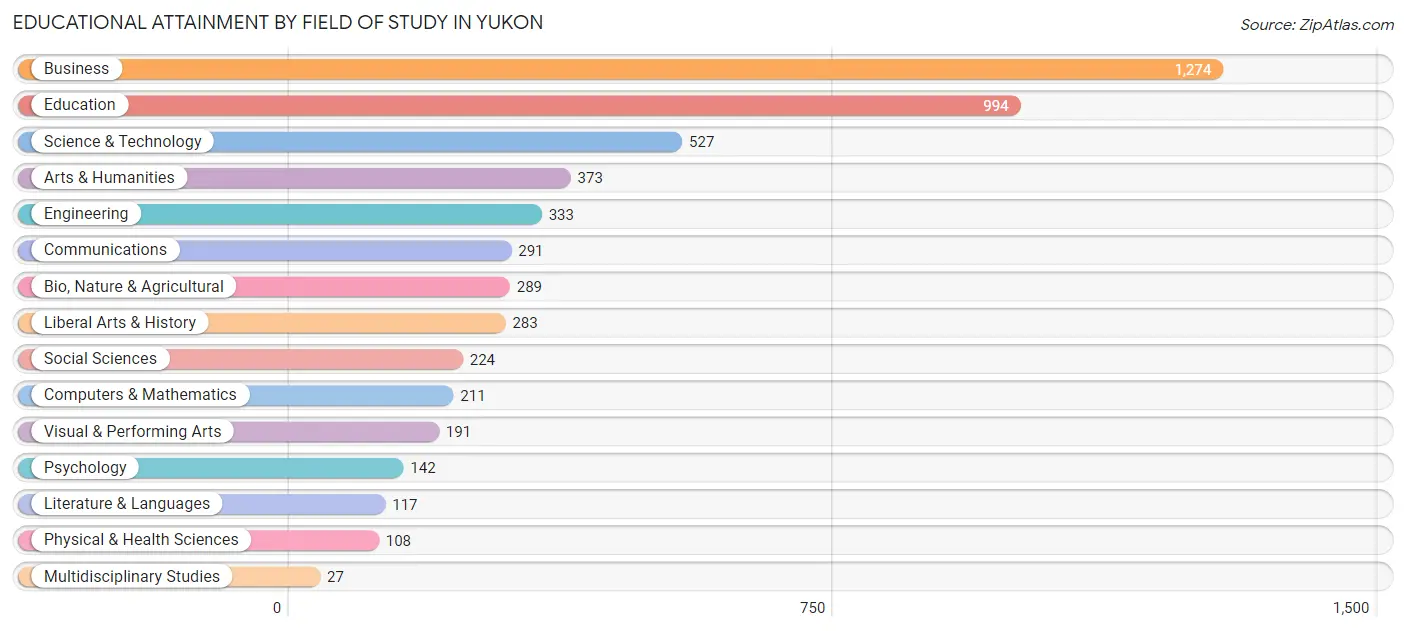
Educational Attainment by Field of Study in Yukon
Business (1,274 | 23.7%), education (994 | 18.5%), science & technology (527 | 9.8%), arts & humanities (373 | 6.9%), and engineering (333 | 6.2%) are the most common fields of study among 5,384 individuals in Yukon who have obtained a bachelor's degree or higher.
| Field of Study | # Graduates | % Graduates |
| Computers & Mathematics | 211 | 3.9% |
| Bio, Nature & Agricultural | 289 | 5.4% |
| Physical & Health Sciences | 108 | 2.0% |
| Psychology | 142 | 2.6% |
| Social Sciences | 224 | 4.2% |
| Engineering | 333 | 6.2% |
| Multidisciplinary Studies | 27 | 0.5% |
| Science & Technology | 527 | 9.8% |
| Business | 1,274 | 23.7% |
| Education | 994 | 18.5% |
| Literature & Languages | 117 | 2.2% |
| Liberal Arts & History | 283 | 5.3% |
| Visual & Performing Arts | 191 | 3.5% |
| Communications | 291 | 5.4% |
| Arts & Humanities | 373 | 6.9% |
| Total | 5,384 | 100.0% |
Transportation & Commute in Yukon
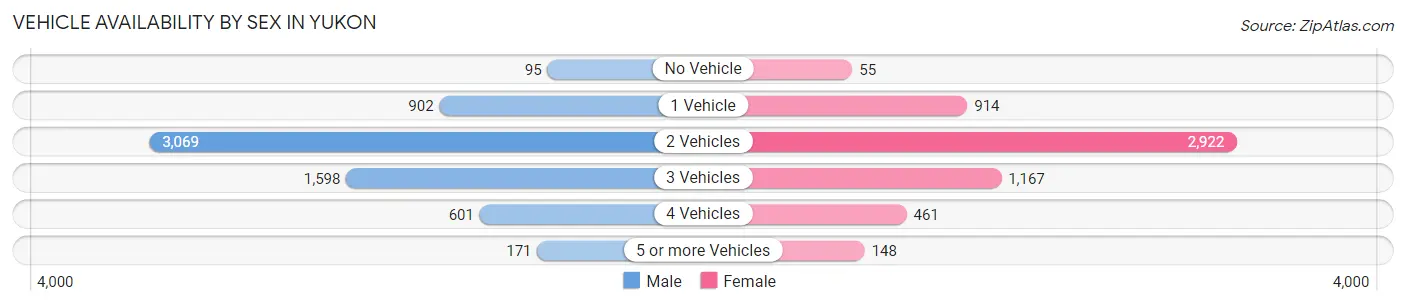
Vehicle Availability by Sex in Yukon
The most prevalent vehicle ownership categories in Yukon are males with 2 vehicles (3,069, accounting for 47.7%) and females with 2 vehicles (2,922, making up 54.2%).
| Vehicles Available | Male | Female |
| No Vehicle | 95 (1.5%) | 55 (1.0%) |
| 1 Vehicle | 902 (14.0%) | 914 (16.1%) |
| 2 Vehicles | 3,069 (47.7%) | 2,922 (51.6%) |
| 3 Vehicles | 1,598 (24.8%) | 1,167 (20.6%) |
| 4 Vehicles | 601 (9.3%) | 461 (8.1%) |
| 5 or more Vehicles | 171 (2.7%) | 148 (2.6%) |
| Total | 6,436 (100.0%) | 5,667 (100.0%) |
Commute Time in Yukon
The most frequently occuring commute durations in Yukon are 20 to 24 minutes (2,367 commuters, 20.8%), 30 to 34 minutes (2,016 commuters, 17.7%), and 15 to 19 minutes (1,647 commuters, 14.5%).
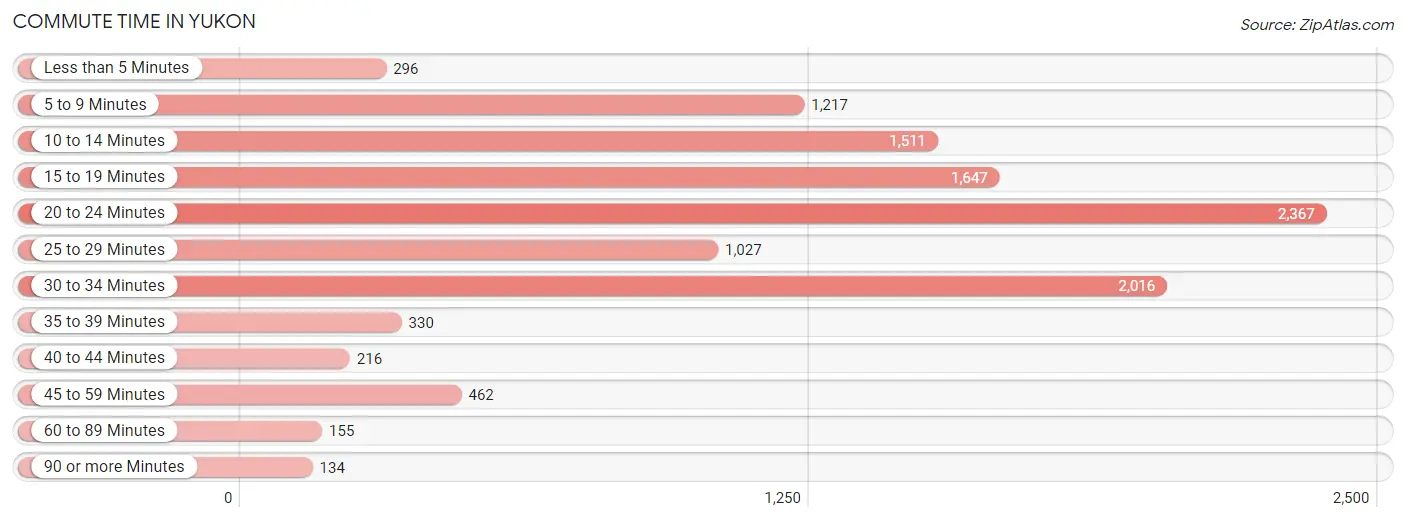
| Commute Time | # Commuters | % Commuters |
| Less than 5 Minutes | 296 | 2.6% |
| 5 to 9 Minutes | 1,217 | 10.7% |
| 10 to 14 Minutes | 1,511 | 13.3% |
| 15 to 19 Minutes | 1,647 | 14.5% |
| 20 to 24 Minutes | 2,367 | 20.8% |
| 25 to 29 Minutes | 1,027 | 9.0% |
| 30 to 34 Minutes | 2,016 | 17.7% |
| 35 to 39 Minutes | 330 | 2.9% |
| 40 to 44 Minutes | 216 | 1.9% |
| 45 to 59 Minutes | 462 | 4.1% |
| 60 to 89 Minutes | 155 | 1.4% |
| 90 or more Minutes | 134 | 1.2% |
Commute Time by Sex in Yukon
The most common commute times in Yukon are 15 to 19 minutes (1,194 commuters, 19.5%) for males and 20 to 24 minutes (1,191 commuters, 22.7%) for females.

| Commute Time | Male | Female |
| Less than 5 Minutes | 116 (1.9%) | 180 (3.4%) |
| 5 to 9 Minutes | 529 (8.6%) | 688 (13.1%) |
| 10 to 14 Minutes | 815 (13.3%) | 696 (13.2%) |
| 15 to 19 Minutes | 1,194 (19.5%) | 453 (8.6%) |
| 20 to 24 Minutes | 1,176 (19.2%) | 1,191 (22.7%) |
| 25 to 29 Minutes | 538 (8.8%) | 489 (9.3%) |
| 30 to 34 Minutes | 1,056 (17.2%) | 960 (18.3%) |
| 35 to 39 Minutes | 91 (1.5%) | 239 (4.5%) |
| 40 to 44 Minutes | 103 (1.7%) | 113 (2.1%) |
| 45 to 59 Minutes | 319 (5.2%) | 143 (2.7%) |
| 60 to 89 Minutes | 93 (1.5%) | 62 (1.2%) |
| 90 or more Minutes | 91 (1.5%) | 43 (0.8%) |
Time of Departure to Work by Sex in Yukon
The most frequent times of departure to work in Yukon are 7:00 AM to 7:29 AM (1,049, 17.1%) for males and 6:30 AM to 6:59 AM (849, 16.2%) for females.
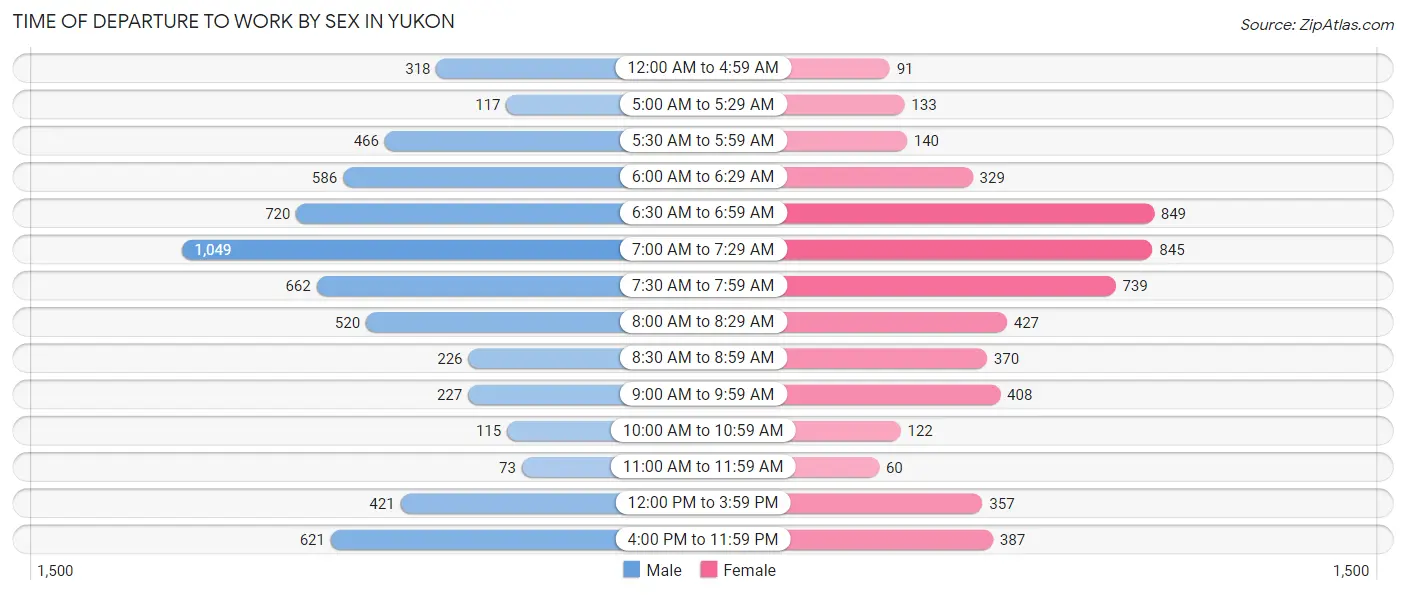
| Time of Departure | Male | Female |
| 12:00 AM to 4:59 AM | 318 (5.2%) | 91 (1.7%) |
| 5:00 AM to 5:29 AM | 117 (1.9%) | 133 (2.5%) |
| 5:30 AM to 5:59 AM | 466 (7.6%) | 140 (2.7%) |
| 6:00 AM to 6:29 AM | 586 (9.6%) | 329 (6.3%) |
| 6:30 AM to 6:59 AM | 720 (11.8%) | 849 (16.2%) |
| 7:00 AM to 7:29 AM | 1,049 (17.1%) | 845 (16.1%) |
| 7:30 AM to 7:59 AM | 662 (10.8%) | 739 (14.1%) |
| 8:00 AM to 8:29 AM | 520 (8.5%) | 427 (8.1%) |
| 8:30 AM to 8:59 AM | 226 (3.7%) | 370 (7.0%) |
| 9:00 AM to 9:59 AM | 227 (3.7%) | 408 (7.8%) |
| 10:00 AM to 10:59 AM | 115 (1.9%) | 122 (2.3%) |
| 11:00 AM to 11:59 AM | 73 (1.2%) | 60 (1.1%) |
| 12:00 PM to 3:59 PM | 421 (6.9%) | 357 (6.8%) |
| 4:00 PM to 11:59 PM | 621 (10.2%) | 387 (7.4%) |
| Total | 6,121 (100.0%) | 5,257 (100.0%) |
Housing Occupancy in Yukon
Occupancy by Ownership in Yukon
Of the total 9,155 dwellings in Yukon, owner-occupied units account for 6,552 (71.6%), while renter-occupied units make up 2,603 (28.4%).
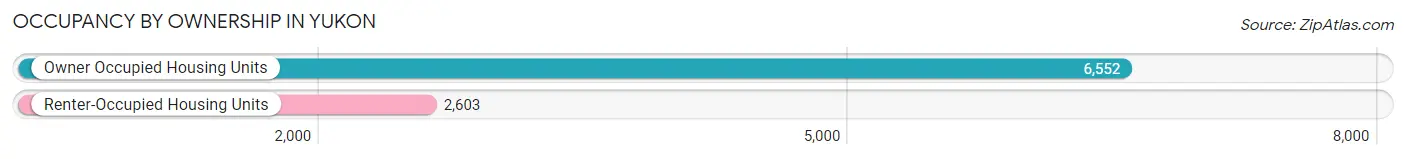
| Occupancy | # Housing Units | % Housing Units |
| Owner Occupied Housing Units | 6,552 | 71.6% |
| Renter-Occupied Housing Units | 2,603 | 28.4% |
| Total Occupied Housing Units | 9,155 | 100.0% |
Occupancy by Household Size in Yukon
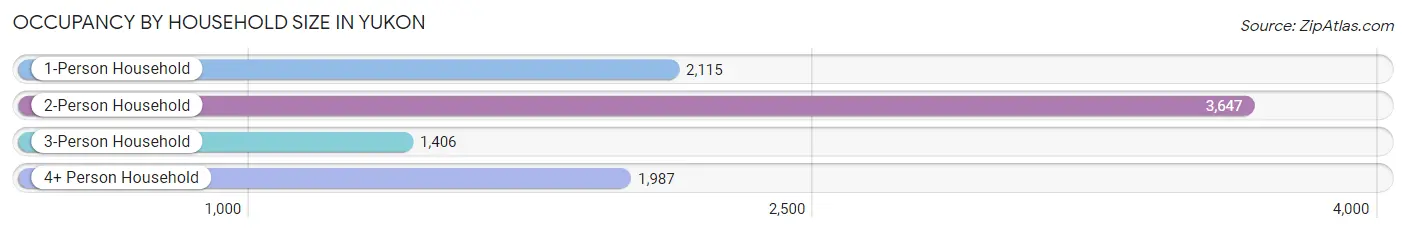
| Household Size | # Housing Units | % Housing Units |
| 1-Person Household | 2,115 | 23.1% |
| 2-Person Household | 3,647 | 39.8% |
| 3-Person Household | 1,406 | 15.4% |
| 4+ Person Household | 1,987 | 21.7% |
| Total Housing Units | 9,155 | 100.0% |
Occupancy by Ownership by Household Size in Yukon
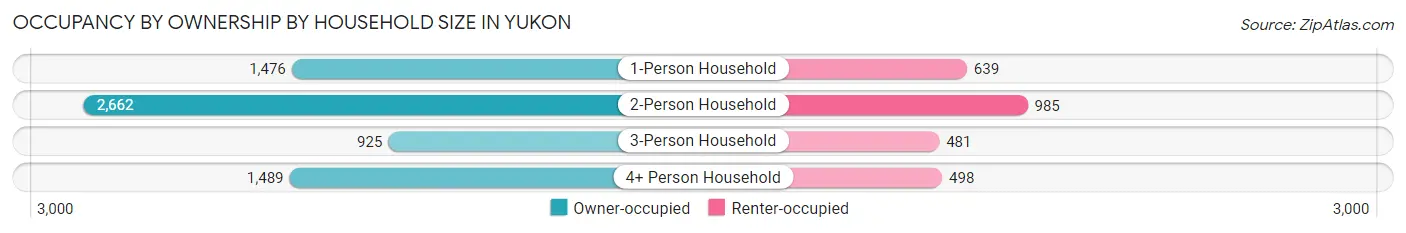
| Household Size | Owner-occupied | Renter-occupied |
| 1-Person Household | 1,476 (69.8%) | 639 (30.2%) |
| 2-Person Household | 2,662 (73.0%) | 985 (27.0%) |
| 3-Person Household | 925 (65.8%) | 481 (34.2%) |
| 4+ Person Household | 1,489 (74.9%) | 498 (25.1%) |
| Total Housing Units | 6,552 (71.6%) | 2,603 (28.4%) |
Occupancy by Educational Attainment in Yukon
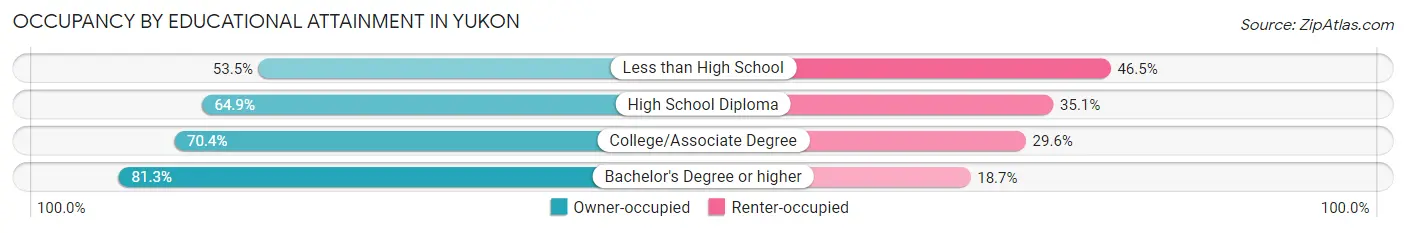
| Household Size | Owner-occupied | Renter-occupied |
| Less than High School | 348 (53.5%) | 302 (46.5%) |
| High School Diploma | 1,447 (64.9%) | 782 (35.1%) |
| College/Associate Degree | 2,229 (70.4%) | 939 (29.6%) |
| Bachelor's Degree or higher | 2,528 (81.3%) | 580 (18.7%) |
Occupancy by Age of Householder in Yukon

| Age Bracket | # Households | % Households |
| Under 35 Years | 1,545 | 16.9% |
| 35 to 44 Years | 1,631 | 17.8% |
| 45 to 54 Years | 1,698 | 18.5% |
| 55 to 64 Years | 1,567 | 17.1% |
| 65 to 74 Years | 1,657 | 18.1% |
| 75 to 84 Years | 834 | 9.1% |
| 85 Years and Over | 223 | 2.4% |
| Total | 9,155 | 100.0% |
Housing Finances in Yukon
Median Income by Occupancy in Yukon
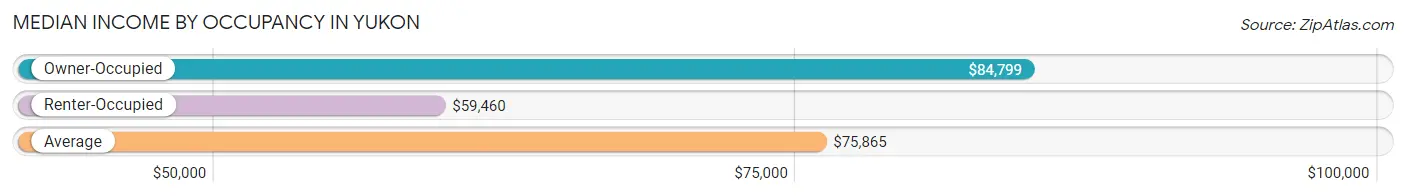
| Occupancy Type | # Households | Median Income |
| Owner-Occupied | 6,552 (71.6%) | $84,799 |
| Renter-Occupied | 2,603 (28.4%) | $59,460 |
| Average | 9,155 (100.0%) | $75,865 |
Occupancy by Householder Income Bracket in Yukon
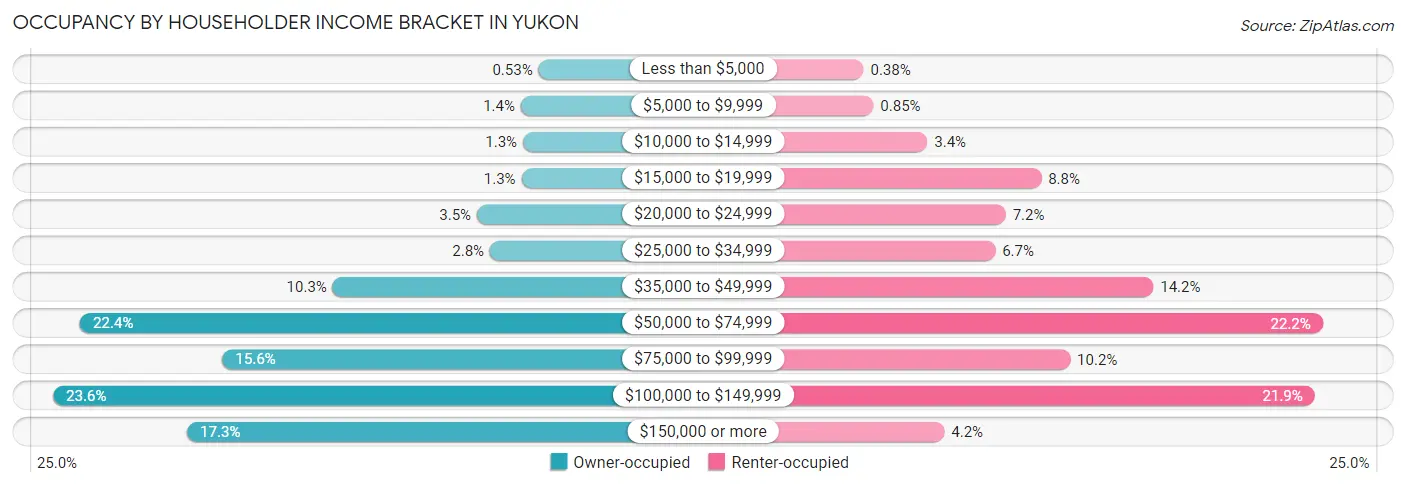
| Income Bracket | Owner-occupied | Renter-occupied |
| Less than $5,000 | 35 (0.5%) | 10 (0.4%) |
| $5,000 to $9,999 | 90 (1.4%) | 22 (0.9%) |
| $10,000 to $14,999 | 83 (1.3%) | 89 (3.4%) |
| $15,000 to $19,999 | 88 (1.3%) | 230 (8.8%) |
| $20,000 to $24,999 | 227 (3.5%) | 186 (7.1%) |
| $25,000 to $34,999 | 186 (2.8%) | 173 (6.7%) |
| $35,000 to $49,999 | 677 (10.3%) | 369 (14.2%) |
| $50,000 to $74,999 | 1,465 (22.4%) | 579 (22.2%) |
| $75,000 to $99,999 | 1,021 (15.6%) | 266 (10.2%) |
| $100,000 to $149,999 | 1,549 (23.6%) | 569 (21.9%) |
| $150,000 or more | 1,131 (17.3%) | 110 (4.2%) |
| Total | 6,552 (100.0%) | 2,603 (100.0%) |
Monthly Housing Cost Tiers in Yukon
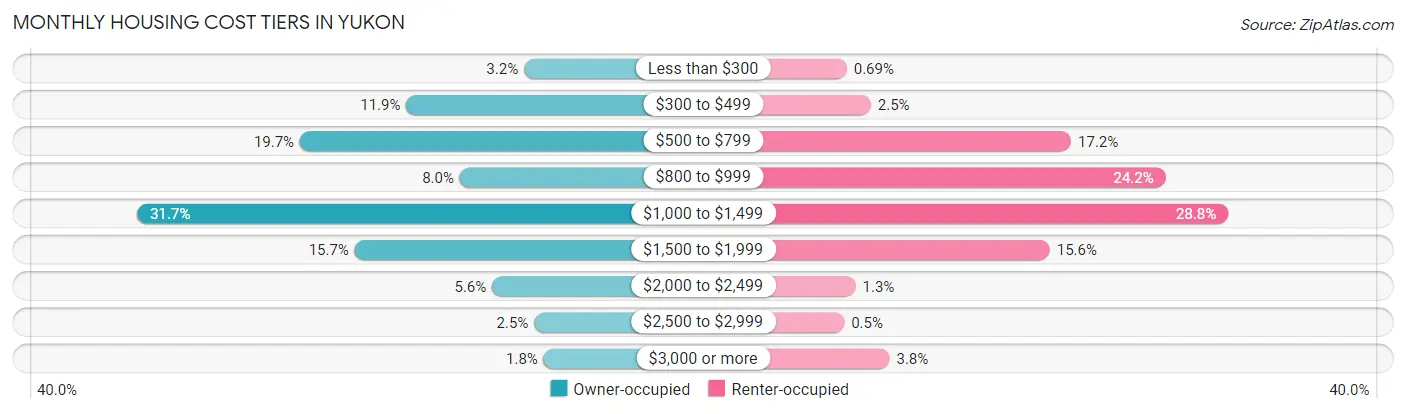
| Monthly Cost | Owner-occupied | Renter-occupied |
| Less than $300 | 211 (3.2%) | 18 (0.7%) |
| $300 to $499 | 779 (11.9%) | 64 (2.5%) |
| $500 to $799 | 1,292 (19.7%) | 448 (17.2%) |
| $800 to $999 | 521 (8.0%) | 629 (24.2%) |
| $1,000 to $1,499 | 2,078 (31.7%) | 749 (28.8%) |
| $1,500 to $1,999 | 1,028 (15.7%) | 407 (15.6%) |
| $2,000 to $2,499 | 365 (5.6%) | 35 (1.3%) |
| $2,500 to $2,999 | 162 (2.5%) | 13 (0.5%) |
| $3,000 or more | 116 (1.8%) | 100 (3.8%) |
| Total | 6,552 (100.0%) | 2,603 (100.0%) |
Physical Housing Characteristics in Yukon
Housing Structures in Yukon
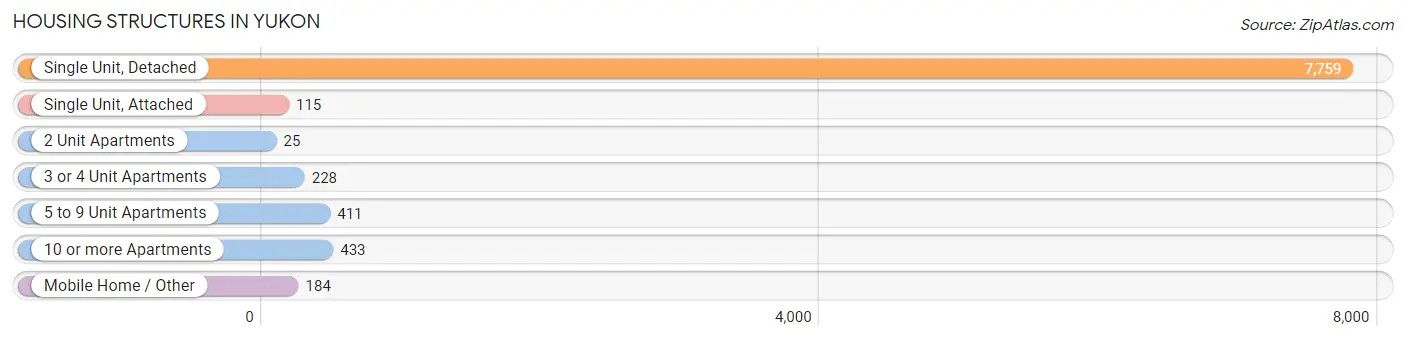
| Structure Type | # Housing Units | % Housing Units |
| Single Unit, Detached | 7,759 | 84.8% |
| Single Unit, Attached | 115 | 1.3% |
| 2 Unit Apartments | 25 | 0.3% |
| 3 or 4 Unit Apartments | 228 | 2.5% |
| 5 to 9 Unit Apartments | 411 | 4.5% |
| 10 or more Apartments | 433 | 4.7% |
| Mobile Home / Other | 184 | 2.0% |
| Total | 9,155 | 100.0% |
Housing Structures by Occupancy in Yukon
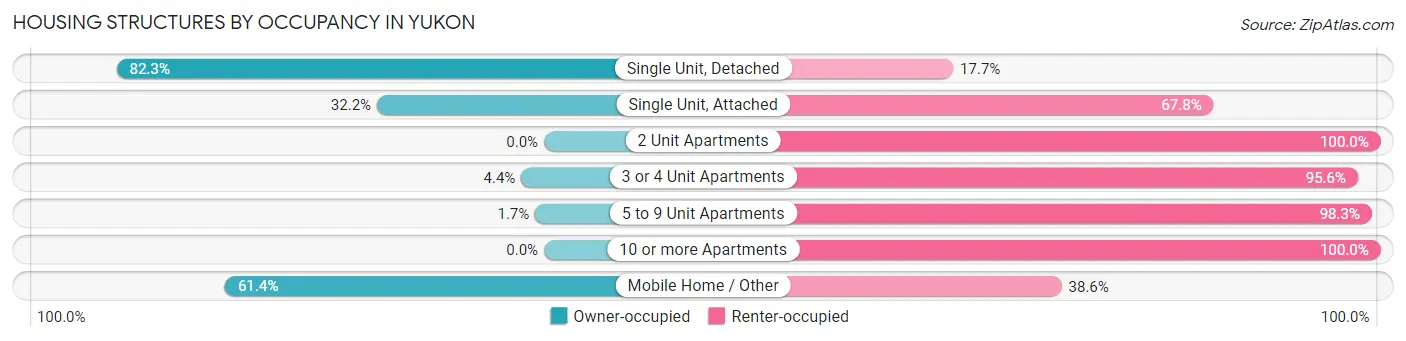
| Structure Type | Owner-occupied | Renter-occupied |
| Single Unit, Detached | 6,385 (82.3%) | 1,374 (17.7%) |
| Single Unit, Attached | 37 (32.2%) | 78 (67.8%) |
| 2 Unit Apartments | 0 (0.0%) | 25 (100.0%) |
| 3 or 4 Unit Apartments | 10 (4.4%) | 218 (95.6%) |
| 5 to 9 Unit Apartments | 7 (1.7%) | 404 (98.3%) |
| 10 or more Apartments | 0 (0.0%) | 433 (100.0%) |
| Mobile Home / Other | 113 (61.4%) | 71 (38.6%) |
| Total | 6,552 (71.6%) | 2,603 (28.4%) |
Housing Structures by Number of Rooms in Yukon
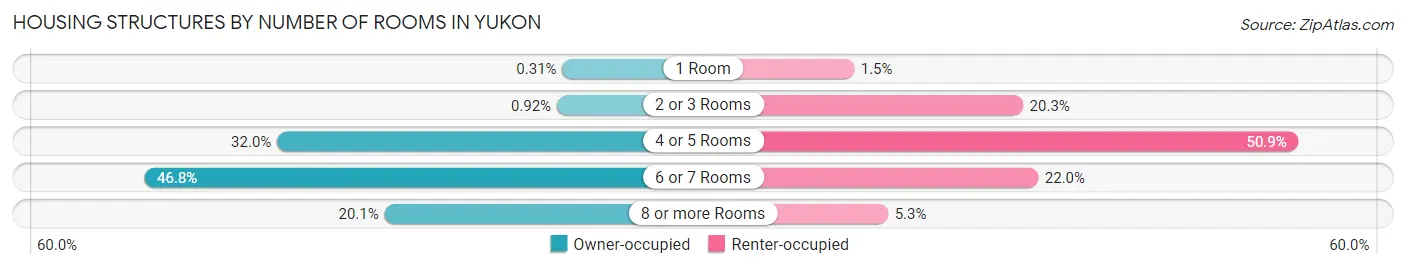
| Number of Rooms | Owner-occupied | Renter-occupied |
| 1 Room | 20 (0.3%) | 40 (1.5%) |
| 2 or 3 Rooms | 60 (0.9%) | 528 (20.3%) |
| 4 or 5 Rooms | 2,095 (32.0%) | 1,325 (50.9%) |
| 6 or 7 Rooms | 3,063 (46.8%) | 572 (22.0%) |
| 8 or more Rooms | 1,314 (20.1%) | 138 (5.3%) |
| Total | 6,552 (100.0%) | 2,603 (100.0%) |
Housing Structure by Heating Type in Yukon
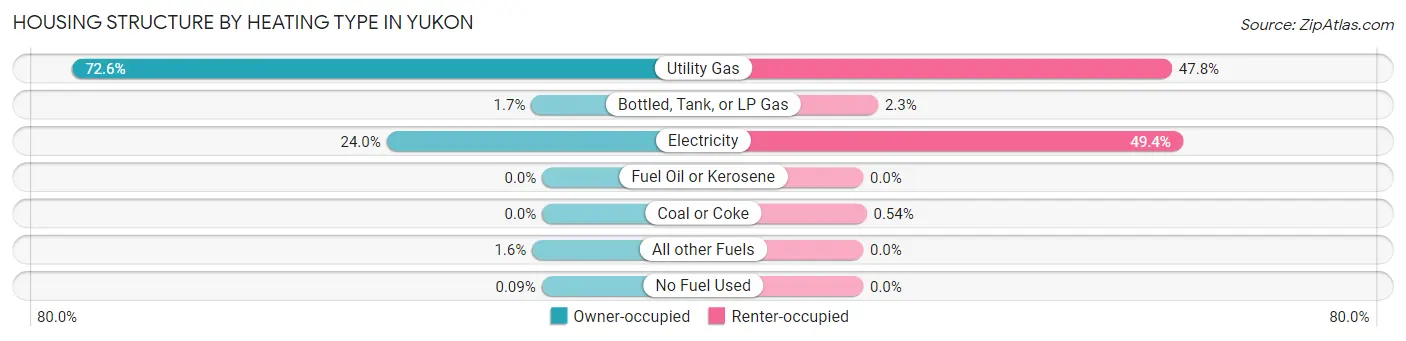
| Heating Type | Owner-occupied | Renter-occupied |
| Utility Gas | 4,759 (72.6%) | 1,243 (47.7%) |
| Bottled, Tank, or LP Gas | 110 (1.7%) | 60 (2.3%) |
| Electricity | 1,575 (24.0%) | 1,286 (49.4%) |
| Fuel Oil or Kerosene | 0 (0.0%) | 0 (0.0%) |
| Coal or Coke | 0 (0.0%) | 14 (0.5%) |
| All other Fuels | 102 (1.6%) | 0 (0.0%) |
| No Fuel Used | 6 (0.1%) | 0 (0.0%) |
| Total | 6,552 (100.0%) | 2,603 (100.0%) |
Household Vehicle Usage in Yukon
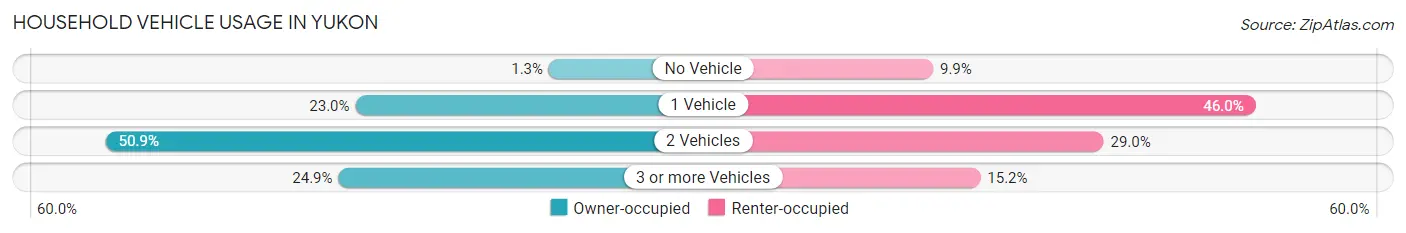
| Vehicles per Household | Owner-occupied | Renter-occupied |
| No Vehicle | 83 (1.3%) | 257 (9.9%) |
| 1 Vehicle | 1,504 (23.0%) | 1,197 (46.0%) |
| 2 Vehicles | 3,337 (50.9%) | 754 (29.0%) |
| 3 or more Vehicles | 1,628 (24.8%) | 395 (15.2%) |
| Total | 6,552 (100.0%) | 2,603 (100.0%) |
Real Estate & Mortgages in Yukon
Real Estate and Mortgage Overview in Yukon
| Characteristic | Without Mortgage | With Mortgage |
| Housing Units | 2,567 | 3,985 |
| Median Property Value | $168,200 | $174,900 |
| Median Household Income | $63,512 | $822 |
| Monthly Housing Costs | $554 | $116 |
| Real Estate Taxes | $1,580 | $194 |
Property Value by Mortgage Status in Yukon
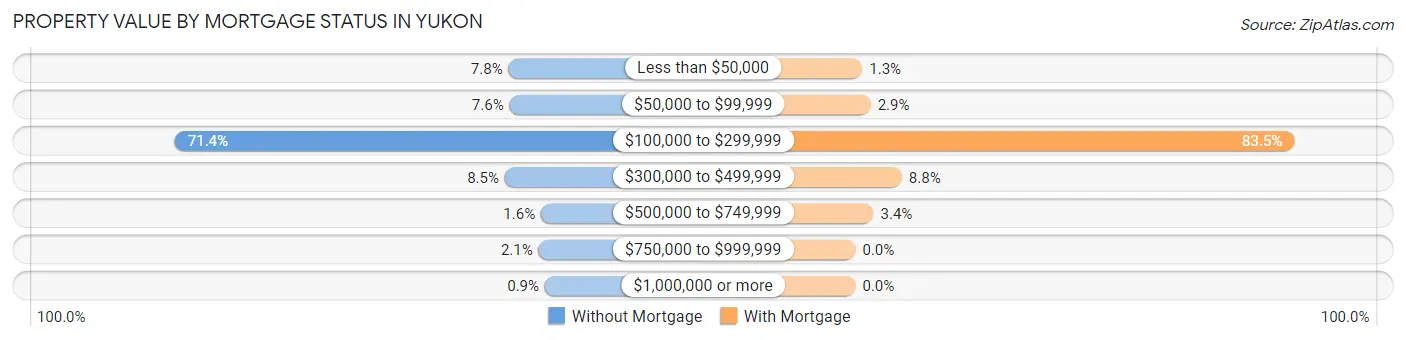
| Property Value | Without Mortgage | With Mortgage |
| Less than $50,000 | 201 (7.8%) | 52 (1.3%) |
| $50,000 to $99,999 | 196 (7.6%) | 115 (2.9%) |
| $100,000 to $299,999 | 1,832 (71.4%) | 3,329 (83.5%) |
| $300,000 to $499,999 | 219 (8.5%) | 352 (8.8%) |
| $500,000 to $749,999 | 42 (1.6%) | 137 (3.4%) |
| $750,000 to $999,999 | 54 (2.1%) | 0 (0.0%) |
| $1,000,000 or more | 23 (0.9%) | 0 (0.0%) |
| Total | 2,567 (100.0%) | 3,985 (100.0%) |
Household Income by Mortgage Status in Yukon
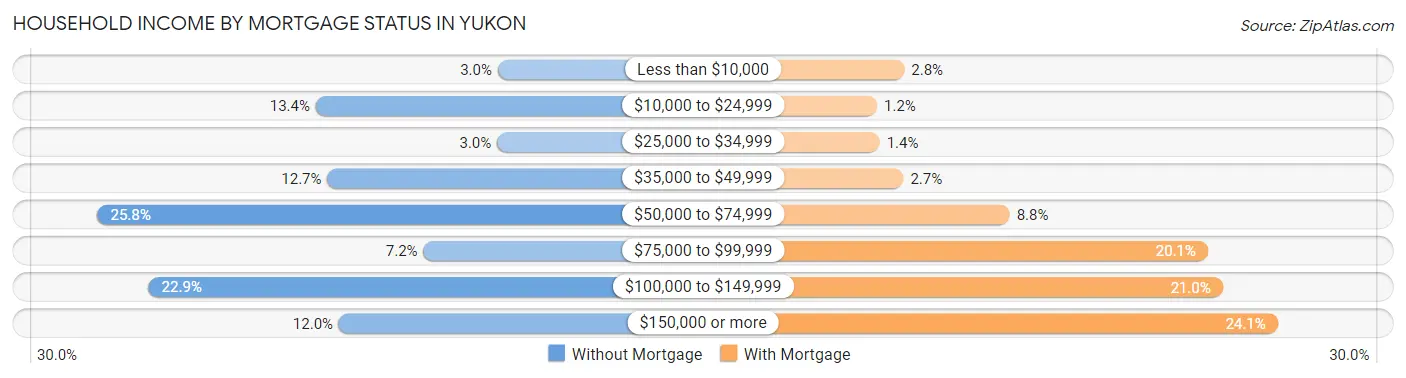
| Household Income | Without Mortgage | With Mortgage |
| Less than $10,000 | 76 (3.0%) | 111 (2.8%) |
| $10,000 to $24,999 | 343 (13.4%) | 49 (1.2%) |
| $25,000 to $34,999 | 77 (3.0%) | 55 (1.4%) |
| $35,000 to $49,999 | 326 (12.7%) | 109 (2.7%) |
| $50,000 to $74,999 | 663 (25.8%) | 351 (8.8%) |
| $75,000 to $99,999 | 185 (7.2%) | 802 (20.1%) |
| $100,000 to $149,999 | 588 (22.9%) | 836 (21.0%) |
| $150,000 or more | 309 (12.0%) | 961 (24.1%) |
| Total | 2,567 (100.0%) | 3,985 (100.0%) |
Property Value to Household Income Ratio in Yukon
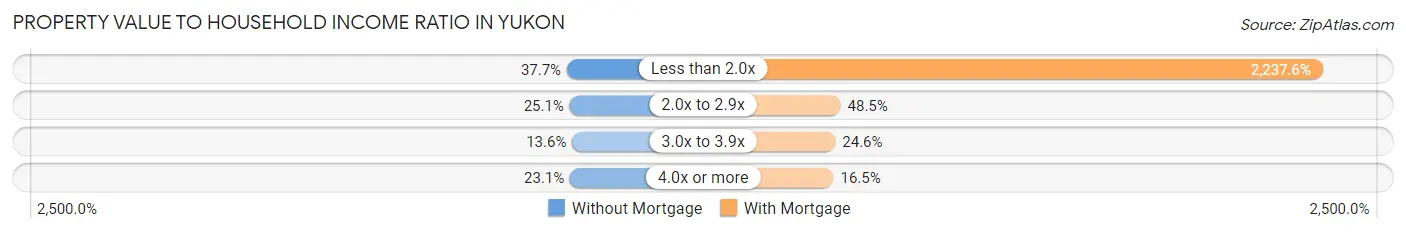
| Value-to-Income Ratio | Without Mortgage | With Mortgage |
| Less than 2.0x | 967 (37.7%) | 89,169 (2,237.6%) |
| 2.0x to 2.9x | 643 (25.1%) | 1,933 (48.5%) |
| 3.0x to 3.9x | 349 (13.6%) | 980 (24.6%) |
| 4.0x or more | 594 (23.1%) | 656 (16.5%) |
| Total | 2,567 (100.0%) | 3,985 (100.0%) |
Real Estate Taxes by Mortgage Status in Yukon
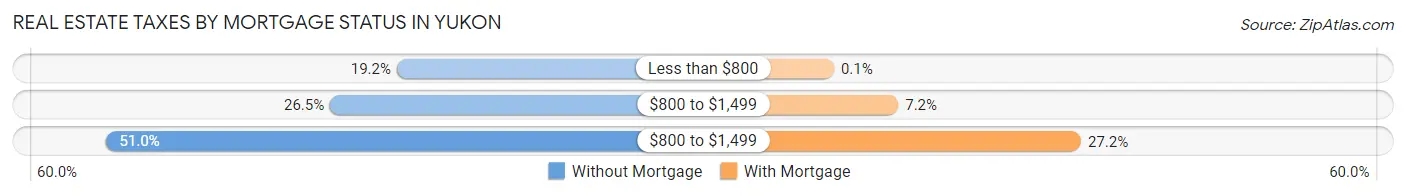
| Property Taxes | Without Mortgage | With Mortgage |
| Less than $800 | 493 (19.2%) | 4 (0.1%) |
| $800 to $1,499 | 681 (26.5%) | 285 (7.1%) |
| $800 to $1,499 | 1,310 (51.0%) | 1,083 (27.2%) |
| Total | 2,567 (100.0%) | 3,985 (100.0%) |
Health & Disability in Yukon
Health Insurance Coverage by Age in Yukon
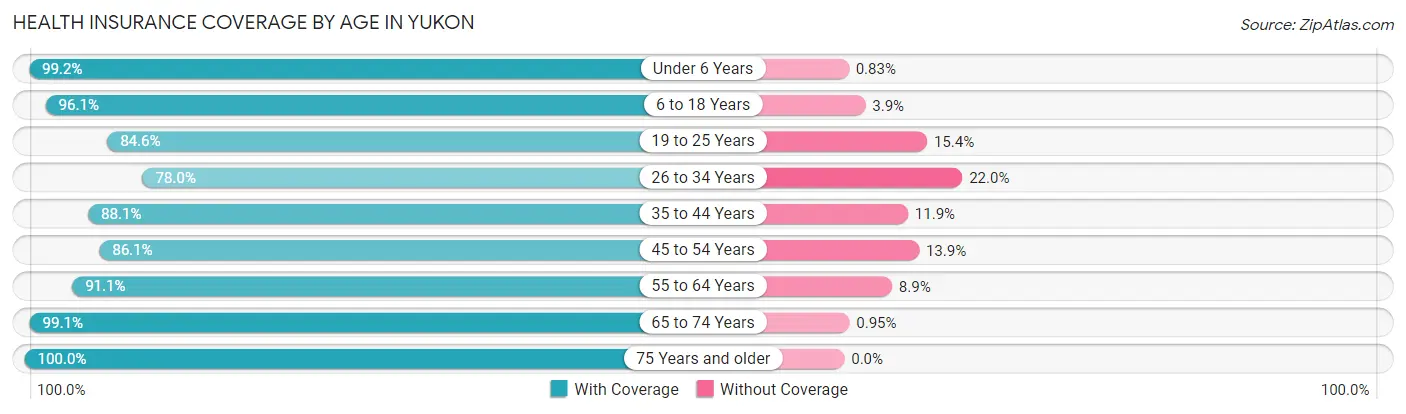
| Age Bracket | With Coverage | Without Coverage |
| Under 6 Years | 1,790 (99.2%) | 15 (0.8%) |
| 6 to 18 Years | 3,884 (96.1%) | 159 (3.9%) |
| 19 to 25 Years | 1,974 (84.6%) | 360 (15.4%) |
| 26 to 34 Years | 1,955 (78.0%) | 551 (22.0%) |
| 35 to 44 Years | 2,854 (88.1%) | 384 (11.9%) |
| 45 to 54 Years | 2,347 (86.1%) | 380 (13.9%) |
| 55 to 64 Years | 2,637 (91.1%) | 257 (8.9%) |
| 65 to 74 Years | 2,720 (99.1%) | 26 (0.9%) |
| 75 Years and older | 1,594 (100.0%) | 0 (0.0%) |
| Total | 21,755 (91.1%) | 2,132 (8.9%) |
Health Insurance Coverage by Citizenship Status in Yukon
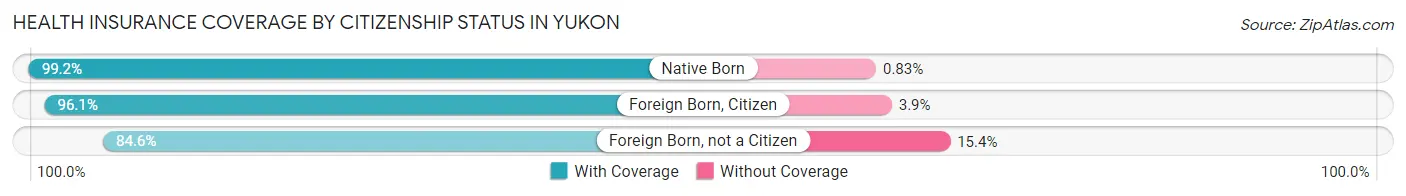
| Citizenship Status | With Coverage | Without Coverage |
| Native Born | 1,790 (99.2%) | 15 (0.8%) |
| Foreign Born, Citizen | 3,884 (96.1%) | 159 (3.9%) |
| Foreign Born, not a Citizen | 1,974 (84.6%) | 360 (15.4%) |
Health Insurance Coverage by Household Income in Yukon
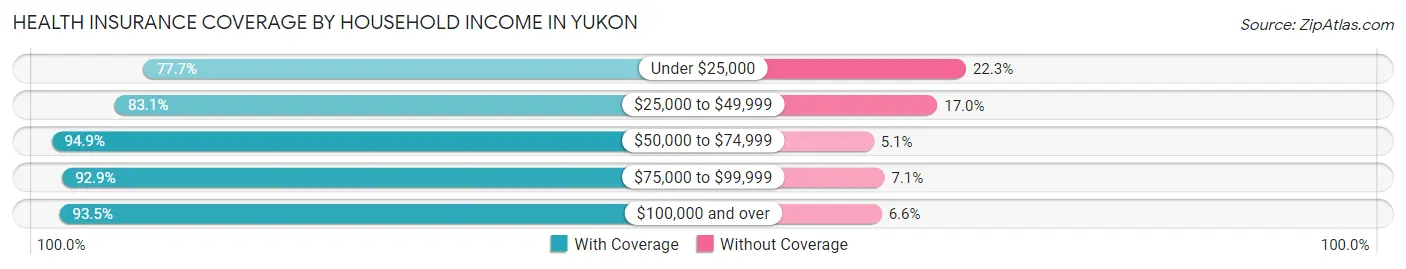
| Household Income | With Coverage | Without Coverage |
| Under $25,000 | 1,475 (77.7%) | 424 (22.3%) |
| $25,000 to $49,999 | 2,508 (83.1%) | 512 (17.0%) |
| $50,000 to $74,999 | 4,163 (94.9%) | 222 (5.1%) |
| $75,000 to $99,999 | 3,409 (92.9%) | 259 (7.1%) |
| $100,000 and over | 10,195 (93.4%) | 715 (6.6%) |
Public vs Private Health Insurance Coverage by Age in Yukon
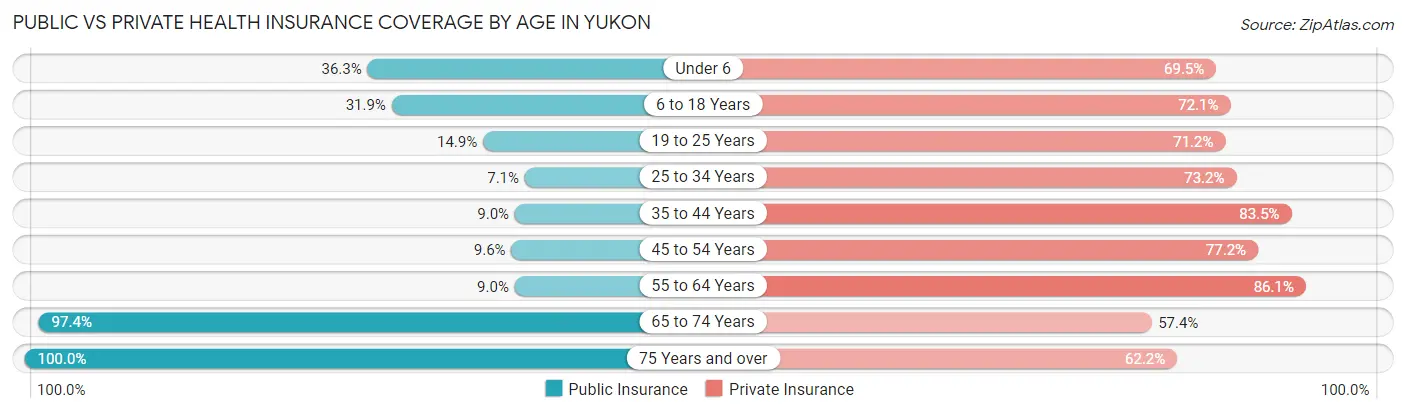
| Age Bracket | Public Insurance | Private Insurance |
| Under 6 | 656 (36.3%) | 1,254 (69.5%) |
| 6 to 18 Years | 1,288 (31.9%) | 2,916 (72.1%) |
| 19 to 25 Years | 348 (14.9%) | 1,661 (71.2%) |
| 25 to 34 Years | 179 (7.1%) | 1,835 (73.2%) |
| 35 to 44 Years | 291 (9.0%) | 2,702 (83.5%) |
| 45 to 54 Years | 263 (9.6%) | 2,106 (77.2%) |
| 55 to 64 Years | 261 (9.0%) | 2,492 (86.1%) |
| 65 to 74 Years | 2,674 (97.4%) | 1,577 (57.4%) |
| 75 Years and over | 1,594 (100.0%) | 992 (62.2%) |
| Total | 7,554 (31.6%) | 17,535 (73.4%) |
Disability Status by Sex by Age in Yukon
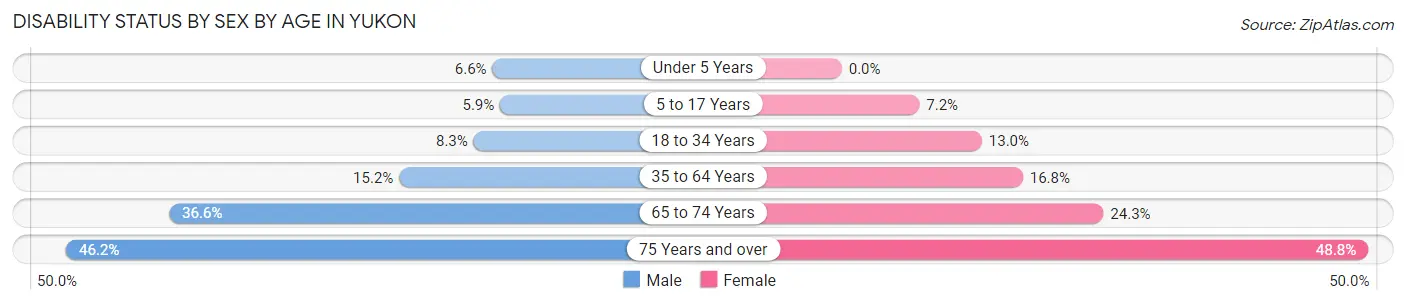
| Age Bracket | Male | Female |
| Under 5 Years | 46 (6.6%) | 0 (0.0%) |
| 5 to 17 Years | 128 (5.9%) | 143 (7.2%) |
| 18 to 34 Years | 205 (8.3%) | 349 (13.0%) |
| 35 to 64 Years | 688 (15.2%) | 730 (16.8%) |
| 65 to 74 Years | 521 (36.6%) | 321 (24.3%) |
| 75 Years and over | 318 (46.2%) | 442 (48.8%) |
Disability Class by Sex by Age in Yukon
Disability Class: Hearing Difficulty
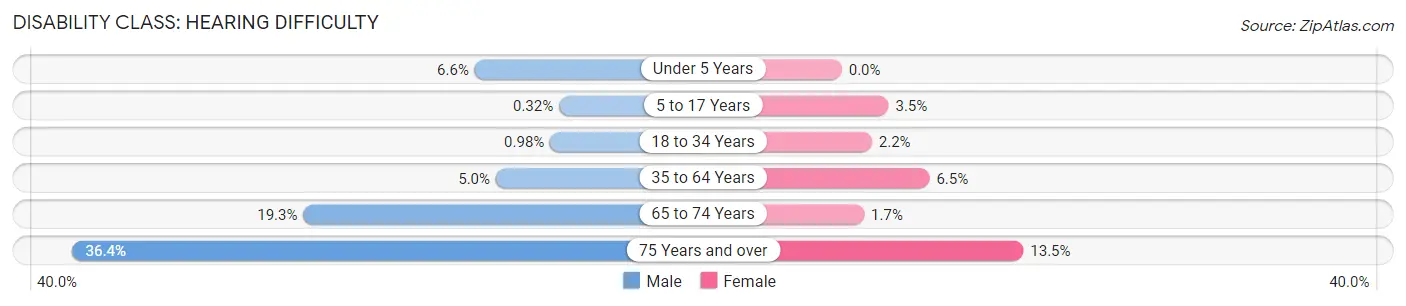
| Age Bracket | Male | Female |
| Under 5 Years | 46 (6.6%) | 0 (0.0%) |
| 5 to 17 Years | 7 (0.3%) | 69 (3.5%) |
| 18 to 34 Years | 24 (1.0%) | 60 (2.2%) |
| 35 to 64 Years | 226 (5.0%) | 283 (6.5%) |
| 65 to 74 Years | 275 (19.3%) | 22 (1.7%) |
| 75 Years and over | 251 (36.4%) | 122 (13.5%) |
Disability Class: Vision Difficulty
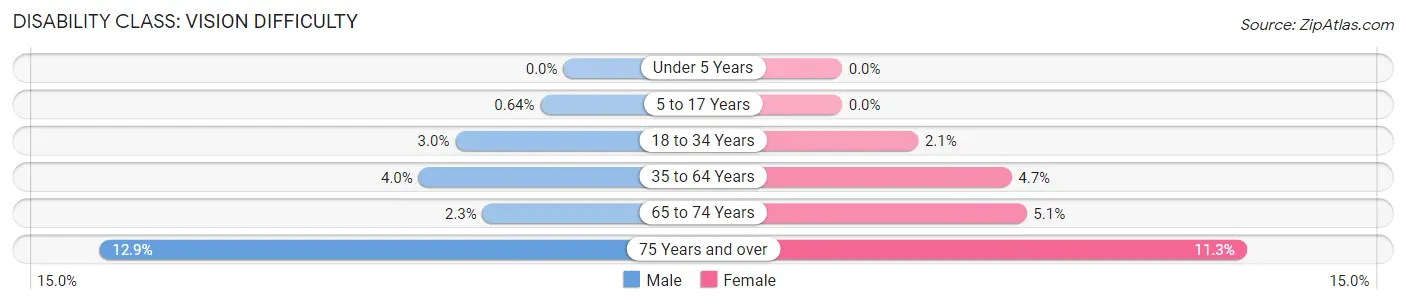
| Age Bracket | Male | Female |
| Under 5 Years | 0 (0.0%) | 0 (0.0%) |
| 5 to 17 Years | 14 (0.6%) | 0 (0.0%) |
| 18 to 34 Years | 74 (3.0%) | 57 (2.1%) |
| 35 to 64 Years | 182 (4.0%) | 205 (4.7%) |
| 65 to 74 Years | 32 (2.2%) | 68 (5.1%) |
| 75 Years and over | 89 (12.9%) | 102 (11.3%) |
Disability Class: Cognitive Difficulty
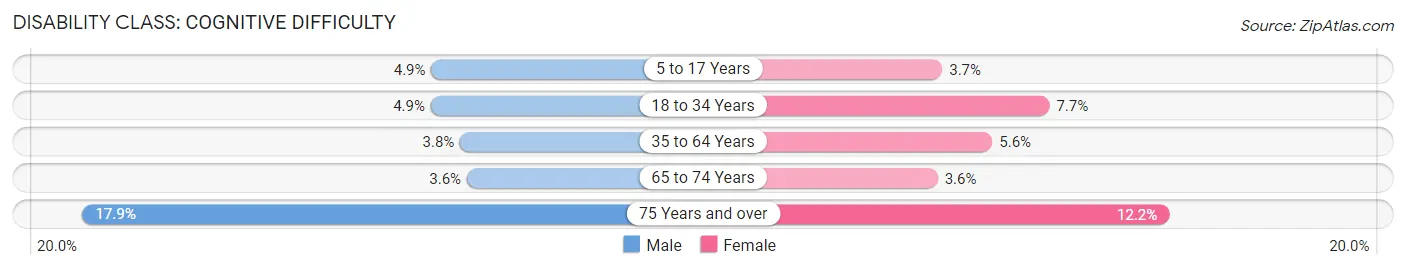
| Age Bracket | Male | Female |
| 5 to 17 Years | 107 (4.9%) | 74 (3.7%) |
| 18 to 34 Years | 121 (4.9%) | 207 (7.7%) |
| 35 to 64 Years | 173 (3.8%) | 243 (5.6%) |
| 65 to 74 Years | 51 (3.6%) | 47 (3.6%) |
| 75 Years and over | 123 (17.8%) | 110 (12.1%) |
Disability Class: Ambulatory Difficulty
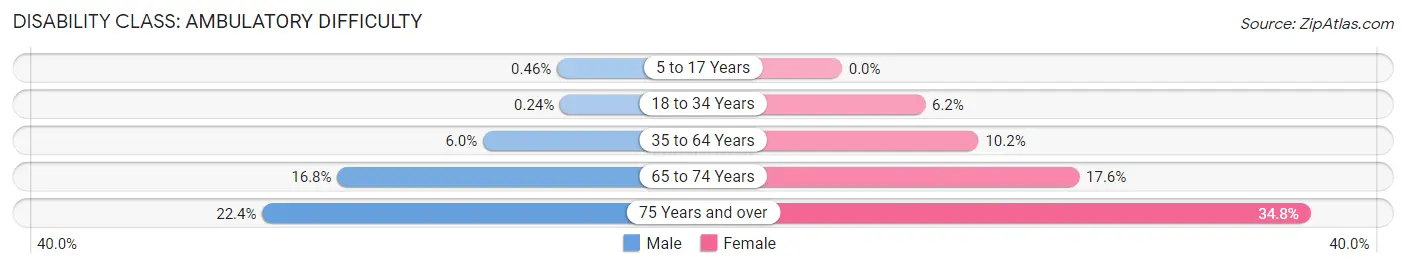
| Age Bracket | Male | Female |
| 5 to 17 Years | 10 (0.5%) | 0 (0.0%) |
| 18 to 34 Years | 6 (0.2%) | 166 (6.2%) |
| 35 to 64 Years | 269 (6.0%) | 441 (10.2%) |
| 65 to 74 Years | 239 (16.8%) | 233 (17.6%) |
| 75 Years and over | 154 (22.4%) | 315 (34.8%) |
Disability Class: Self-Care Difficulty
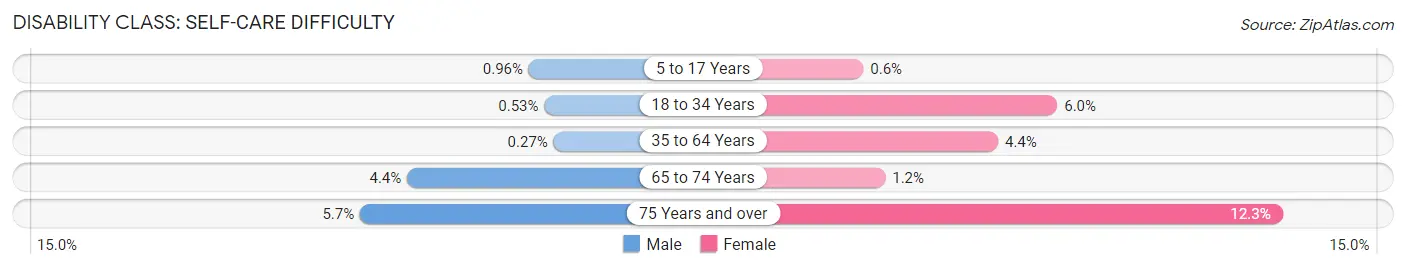
| Age Bracket | Male | Female |
| 5 to 17 Years | 21 (1.0%) | 12 (0.6%) |
| 18 to 34 Years | 13 (0.5%) | 161 (6.0%) |
| 35 to 64 Years | 12 (0.3%) | 189 (4.3%) |
| 65 to 74 Years | 62 (4.3%) | 16 (1.2%) |
| 75 Years and over | 39 (5.7%) | 111 (12.3%) |
Technology Access in Yukon
Computing Device Access in Yukon
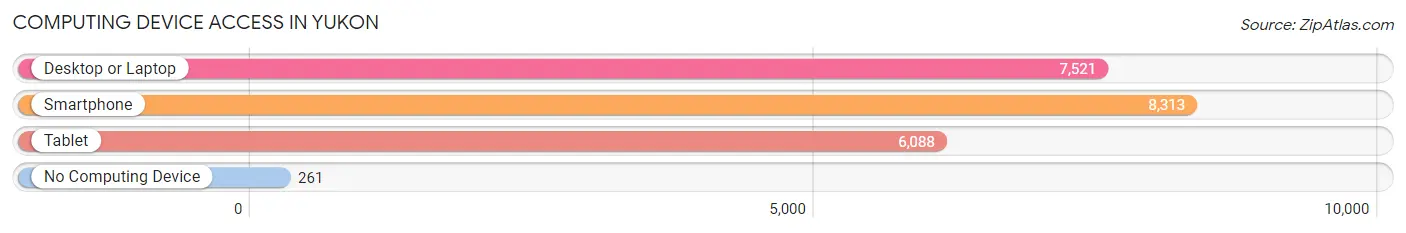
| Device Type | # Households | % Households |
| Desktop or Laptop | 7,521 | 82.2% |
| Smartphone | 8,313 | 90.8% |
| Tablet | 6,088 | 66.5% |
| No Computing Device | 261 | 2.9% |
| Total | 9,155 | 100.0% |
Internet Access in Yukon
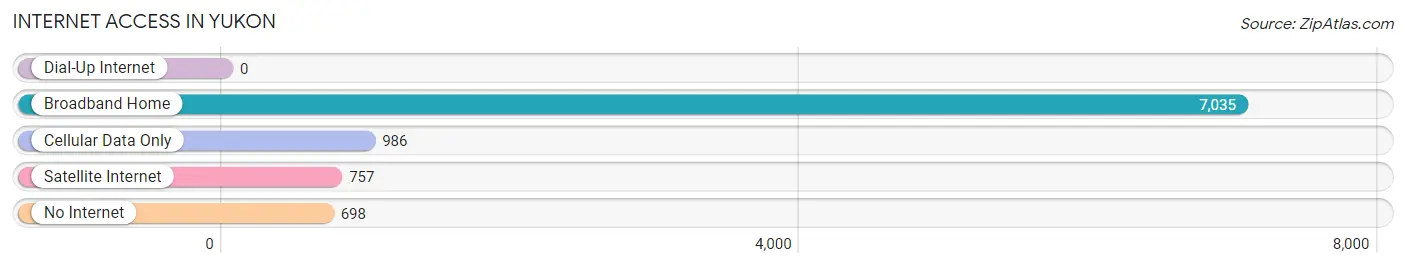
| Internet Type | # Households | % Households |
| Dial-Up Internet | 0 | 0.0% |
| Broadband Home | 7,035 | 76.8% |
| Cellular Data Only | 986 | 10.8% |
| Satellite Internet | 757 | 8.3% |
| No Internet | 698 | 7.6% |
| Total | 9,155 | 100.0% |
Yukon Summary
Yukon is a city located in Canadian County, Oklahoma, United States. It is part of the Oklahoma City metropolitan area. The population was 22,709 at the 2010 census.
History
Yukon was founded in the late 1800s by settlers from the Midwest. The town was named after the Yukon River in Canada. The first post office was established in 1891. The town was incorporated in 1901.
In the early 1900s, Yukon was a small farming community. The town began to grow in the 1950s when the nearby Tinker Air Force Base was established. The population of Yukon increased rapidly during this time.
Geography
Yukon is located in Canadian County, Oklahoma, at 35°31'25" North, 97°45'17" West (35.523607, -97.754720). It is situated at the intersection of Interstate 40 and State Highway 66.
The city has a total area of 16.2 square miles, of which 16.1 square miles is land and 0.1 square miles is water.
Economy
Yukon's economy is largely based on the nearby Tinker Air Force Base. The base is the largest single-site employer in the state of Oklahoma, with more than 30,000 employees. Other major employers in the city include the Yukon Public Schools, the City of Yukon, and the Yukon Medical Center.
The city also has a thriving retail sector, with several large shopping centers and numerous restaurants.
Demographics
As of the 2010 census, there were 22,709 people, 8,717 households, and 6,072 families residing in the city. The population density was 1,408.2 people per square mile. The racial makeup of the city was 79.2% White, 8.2% African American, 3.3% Native American, 2.2% Asian, 0.1% Pacific Islander, 4.2% from other races, and 2.9% from two or more races. Hispanic or Latino of any race were 8.7% of the population.
The median income for a household in the city was $50,945, and the median income for a family was $60,945. The per capita income for the city was $23,945. About 5.2% of families and 7.2% of the population were below the poverty line, including 9.2% of those under age 18 and 6.2% of those age 65 or over.
Conclusion
Yukon is a city located in Canadian County, Oklahoma, United States. It is part of the Oklahoma City metropolitan area. The population was 22,709 at the 2010 census. Yukon was founded in the late 1800s by settlers from the Midwest and has since grown to become a thriving city with a strong economy based on the nearby Tinker Air Force Base. The city has a diverse population with a median household income of $50,945 and a per capita income of $23,945. Yukon is a great place to live, work, and play.
Common Questions
What is Per Capita Income in Yukon?
Per Capita income in Yukon is $36,461.
What is the Median Family Income in Yukon?
Median Family Income in Yukon is $92,906.
What is the Median Household income in Yukon?
Median Household Income in Yukon is $75,865.
What is Income or Wage Gap in Yukon?
Income or Wage Gap in Yukon is 32.5%.
Women in Yukon earn 67.5 cents for every dollar earned by a man.
What is Family Income Deficit in Yukon?
Family Income Deficit in Yukon is $9,217.
Families that are below poverty line in Yukon earn $9,217 less on average than the poverty threshold level.
What is Inequality or Gini Index in Yukon?
Inequality or Gini Index in Yukon is 0.38.
What is the Total Population of Yukon?
Total Population of Yukon is 24,198.
What is the Total Male Population of Yukon?
Total Male Population of Yukon is 12,074.
What is the Total Female Population of Yukon?
Total Female Population of Yukon is 12,124.
What is the Ratio of Males per 100 Females in Yukon?
There are 99.59 Males per 100 Females in Yukon.
What is the Ratio of Females per 100 Males in Yukon?
There are 100.41 Females per 100 Males in Yukon.
What is the Median Population Age in Yukon?
Median Population Age in Yukon is 39.3 Years.
What is the Average Family Size in Yukon
Average Family Size in Yukon is 3.1 People.
What is the Average Household Size in Yukon
Average Household Size in Yukon is 2.6 People.
How Large is the Labor Force in Yukon?
There are 12,785 People in the Labor Forcein in Yukon.
What is the Percentage of People in the Labor Force in Yukon?
66.2% of People are in the Labor Force in Yukon.
What is the Unemployment Rate in Yukon?
Unemployment Rate in Yukon is 4.0%.