Durant, OK Map & Demographics
Durant Map
Durant Overview
$28,129
PER CAPITA INCOME
$58,837
AVG FAMILY INCOME
$44,593
AVG HOUSEHOLD INCOME
17.8%
WAGE / INCOME GAP [ % ]
82.2¢/ $1
WAGE / INCOME GAP [ $ ]
$9,242
FAMILY INCOME DEFICIT
0.48
INEQUALITY / GINI INDEX
18,759
TOTAL POPULATION
9,133
MALE POPULATION
9,626
FEMALE POPULATION
94.88
MALES / 100 FEMALES
105.40
FEMALES / 100 MALES
34.0
MEDIAN AGE
3.0
AVG FAMILY SIZE
2.5
AVG HOUSEHOLD SIZE
9,087
LABOR FORCE [ PEOPLE ]
60.7%
PERCENT IN LABOR FORCE
5.5%
UNEMPLOYMENT RATE
Durant Zip Codes
Durant Area Codes
Income in Durant
Income Overview in Durant
Per Capita Income in Durant is $28,129, while median incomes of families and households are $58,837 and $44,593 respectively.
| Characteristic | Number | Measure |
| Per Capita Income | 18,759 | $28,129 |
| Median Family Income | 4,323 | $58,837 |
| Mean Family Income | 4,323 | $81,330 |
| Median Household Income | 7,316 | $44,593 |
| Mean Household Income | 7,316 | $68,346 |
| Income Deficit | 4,323 | $9,242 |
| Wage / Income Gap (%) | 18,759 | 17.85% |
| Wage / Income Gap ($) | 18,759 | 82.15¢ per $1 |
| Gini / Inequality Index | 18,759 | 0.48 |
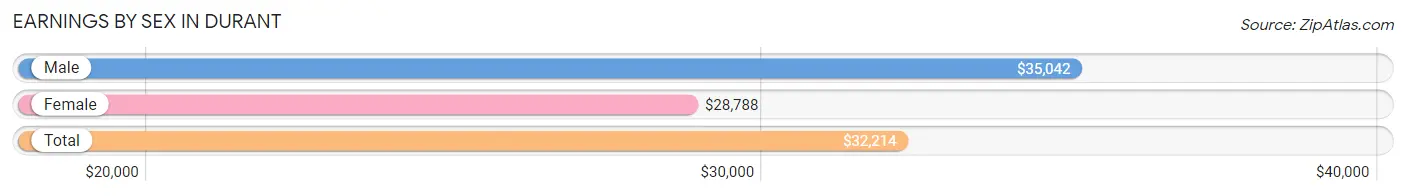
Earnings by Sex in Durant
Average Earnings in Durant are $32,214, $35,042 for men and $28,788 for women, a difference of 17.8%.
| Sex | Number | Average Earnings |
| Male | 5,042 (52.9%) | $35,042 |
| Female | 4,492 (47.1%) | $28,788 |
| Total | 9,534 (100.0%) | $32,214 |
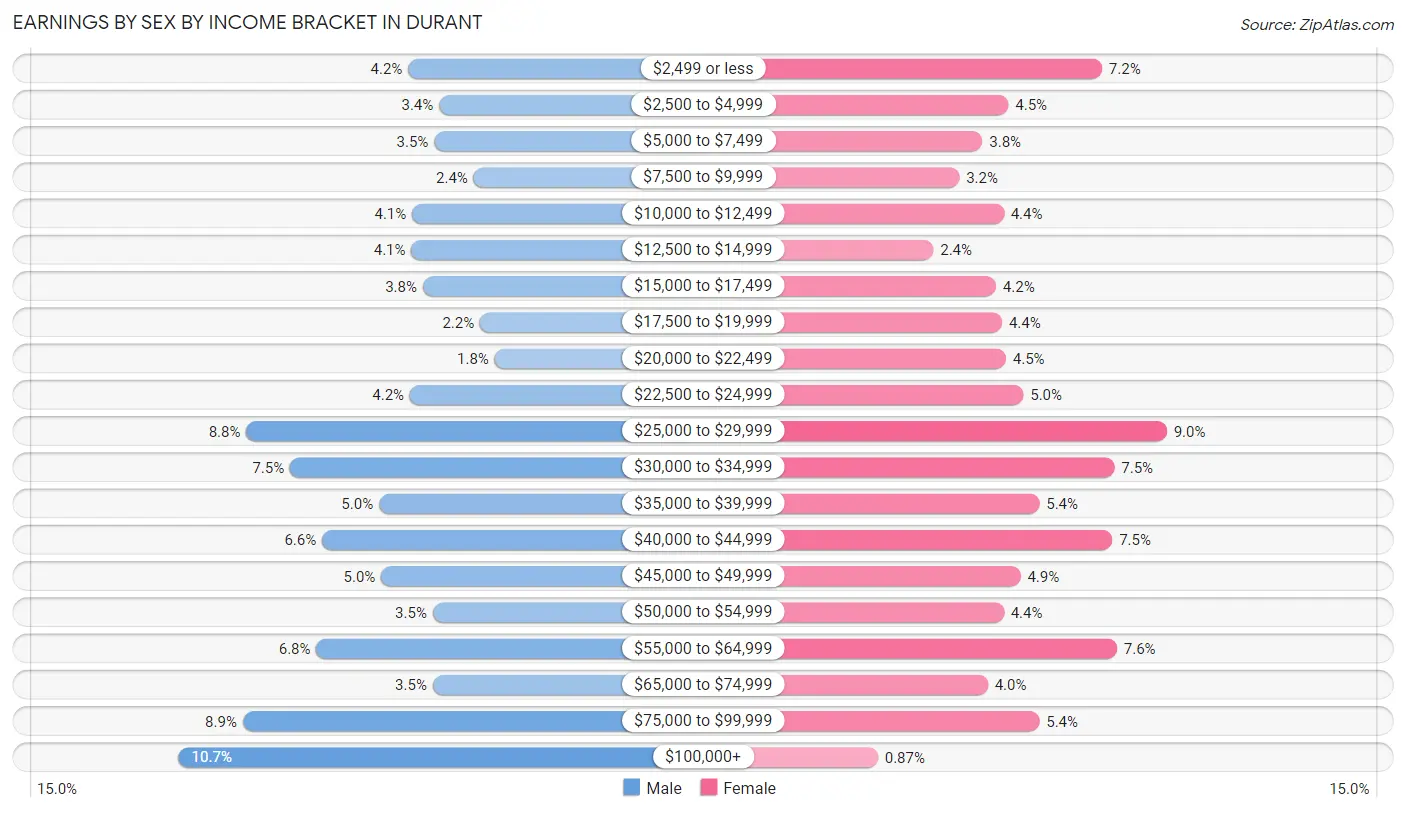
Earnings by Sex by Income Bracket in Durant
The most common earnings brackets in Durant are $100,000+ for men (538 | 10.7%) and $25,000 to $29,999 for women (404 | 9.0%).
| Income | Male | Female |
| $2,499 or less | 213 (4.2%) | 322 (7.2%) |
| $2,500 to $4,999 | 169 (3.4%) | 204 (4.5%) |
| $5,000 to $7,499 | 176 (3.5%) | 171 (3.8%) |
| $7,500 to $9,999 | 120 (2.4%) | 142 (3.2%) |
| $10,000 to $12,499 | 207 (4.1%) | 198 (4.4%) |
| $12,500 to $14,999 | 208 (4.1%) | 109 (2.4%) |
| $15,000 to $17,499 | 192 (3.8%) | 188 (4.2%) |
| $17,500 to $19,999 | 111 (2.2%) | 196 (4.4%) |
| $20,000 to $22,499 | 90 (1.8%) | 201 (4.5%) |
| $22,500 to $24,999 | 210 (4.2%) | 223 (5.0%) |
| $25,000 to $29,999 | 442 (8.8%) | 404 (9.0%) |
| $30,000 to $34,999 | 380 (7.5%) | 338 (7.5%) |
| $35,000 to $39,999 | 254 (5.0%) | 243 (5.4%) |
| $40,000 to $44,999 | 335 (6.6%) | 335 (7.5%) |
| $45,000 to $49,999 | 251 (5.0%) | 219 (4.9%) |
| $50,000 to $54,999 | 178 (3.5%) | 198 (4.4%) |
| $55,000 to $64,999 | 343 (6.8%) | 341 (7.6%) |
| $65,000 to $74,999 | 178 (3.5%) | 178 (4.0%) |
| $75,000 to $99,999 | 447 (8.9%) | 243 (5.4%) |
| $100,000+ | 538 (10.7%) | 39 (0.9%) |
| Total | 5,042 (100.0%) | 4,492 (100.0%) |
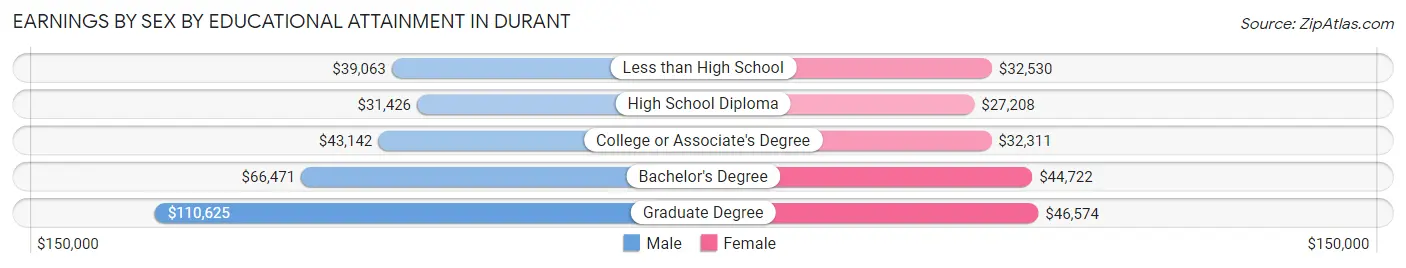
Earnings by Sex by Educational Attainment in Durant
Average earnings in Durant are $41,798 for men and $34,287 for women, a difference of 18.0%. Men with an educational attainment of graduate degree enjoy the highest average annual earnings of $110,625, while those with high school diploma education earn the least with $31,426. Women with an educational attainment of graduate degree earn the most with the average annual earnings of $46,574, while those with high school diploma education have the smallest earnings of $27,208.
| Educational Attainment | Male Income | Female Income |
| Less than High School | $39,063 | $32,530 |
| High School Diploma | $31,426 | $27,208 |
| College or Associate's Degree | $43,142 | $32,311 |
| Bachelor's Degree | $66,471 | $44,722 |
| Graduate Degree | $110,625 | $46,574 |
| Total | $41,798 | $34,287 |
Family Income in Durant
Family Income Brackets in Durant
According to the Durant family income data, there are 739 families falling into the $35,000 to $49,999 income range, which is the most common income bracket and makes up 17.1% of all families. Conversely, the $10,000 to $14,999 income bracket is the least frequent group with only 160 families (3.7%) belonging to this category.
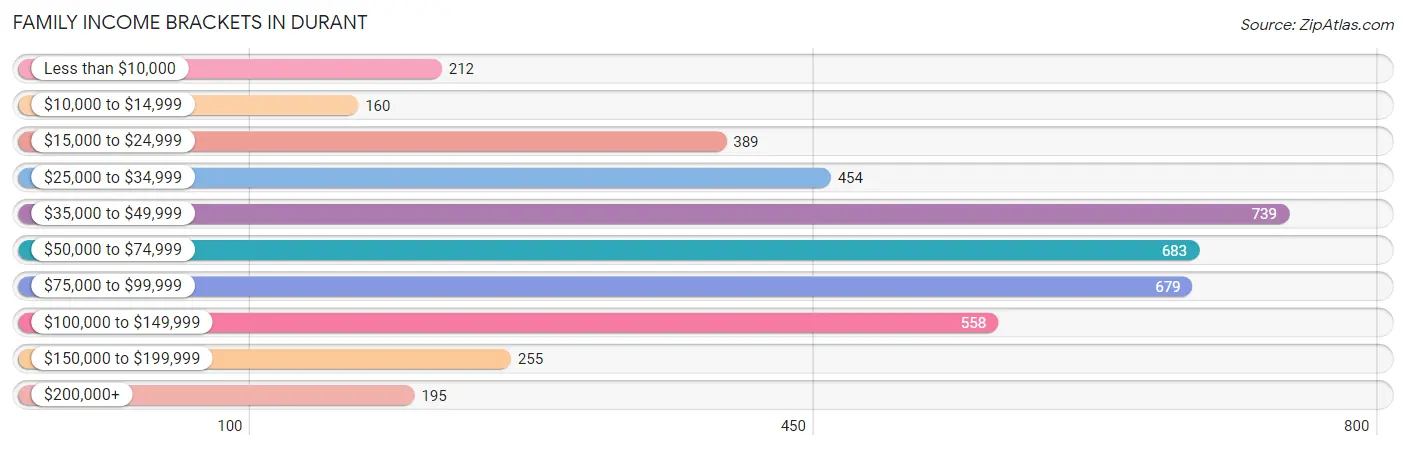
| Income Bracket | # Families | % Families |
| Less than $10,000 | 212 | 4.9% |
| $10,000 to $14,999 | 160 | 3.7% |
| $15,000 to $24,999 | 389 | 9.0% |
| $25,000 to $34,999 | 454 | 10.5% |
| $35,000 to $49,999 | 739 | 17.1% |
| $50,000 to $74,999 | 683 | 15.8% |
| $75,000 to $99,999 | 679 | 15.7% |
| $100,000 to $149,999 | 558 | 12.9% |
| $150,000 to $199,999 | 255 | 5.9% |
| $200,000+ | 195 | 4.5% |
Family Income by Famaliy Size in Durant
7+ person families (30 | 0.7%) account for the highest median family income in Durant with $128,026 per family, while 2-person families (2,234 | 51.7%) have the highest median income of $29,406 per family member.
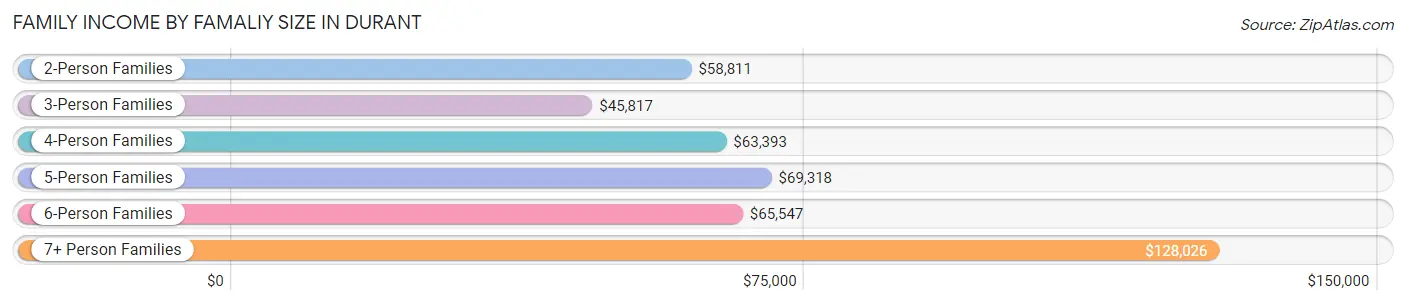
| Income Bracket | # Families | Median Income |
| 2-Person Families | 2,234 (51.7%) | $58,811 |
| 3-Person Families | 711 (16.5%) | $45,817 |
| 4-Person Families | 895 (20.7%) | $63,393 |
| 5-Person Families | 366 (8.5%) | $69,318 |
| 6-Person Families | 87 (2.0%) | $65,547 |
| 7+ Person Families | 30 (0.7%) | $128,026 |
| Total | 4,323 (100.0%) | $58,837 |
Family Income by Number of Earners in Durant
The median family income in Durant is $58,837, with families comprising 3+ earners (238) having the highest median family income of $141,250, while families with no earners (806) have the lowest median family income of $37,175, accounting for 5.5% and 18.6% of families, respectively.
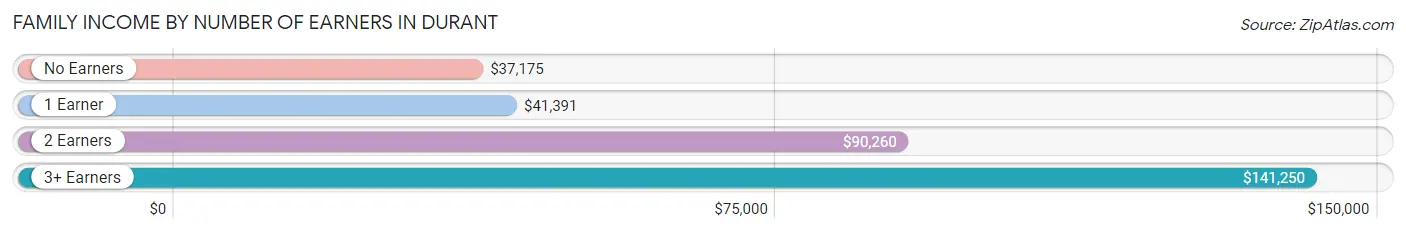
| Number of Earners | # Families | Median Income |
| No Earners | 806 (18.6%) | $37,175 |
| 1 Earner | 1,648 (38.1%) | $41,391 |
| 2 Earners | 1,631 (37.7%) | $90,260 |
| 3+ Earners | 238 (5.5%) | $141,250 |
| Total | 4,323 (100.0%) | $58,837 |
Household Income in Durant
Household Income Brackets in Durant
With 1,185 households falling in the category, the $35,000 to $49,999 income range is the most frequent in Durant, accounting for 16.2% of all households. In contrast, only 227 households (3.1%) fall into the $200,000+ income bracket, making it the least populous group.
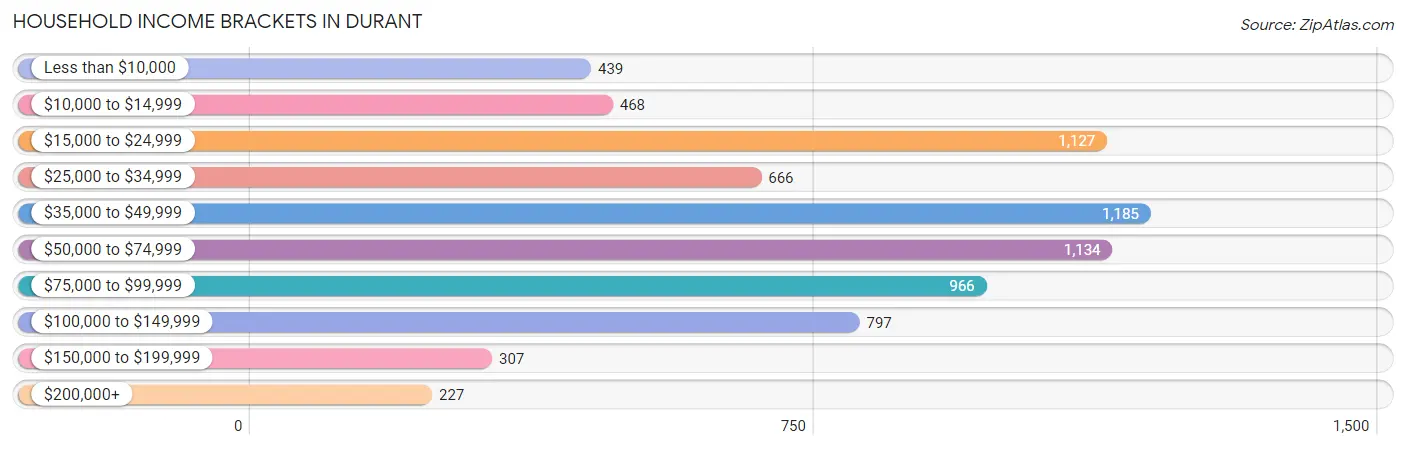
| Income Bracket | # Households | % Households |
| Less than $10,000 | 439 | 6.0% |
| $10,000 to $14,999 | 468 | 6.4% |
| $15,000 to $24,999 | 1,127 | 15.4% |
| $25,000 to $34,999 | 666 | 9.1% |
| $35,000 to $49,999 | 1,185 | 16.2% |
| $50,000 to $74,999 | 1,134 | 15.5% |
| $75,000 to $99,999 | 966 | 13.2% |
| $100,000 to $149,999 | 797 | 10.9% |
| $150,000 to $199,999 | 307 | 4.2% |
| $200,000+ | 227 | 3.1% |
Household Income by Householder Age in Durant
The median household income in Durant is $44,593, with the highest median household income of $60,911 found in the 25 to 44 years age bracket for the primary householder. A total of 2,515 households (34.4%) fall into this category. Meanwhile, the 15 to 24 years age bracket for the primary householder has the lowest median household income of $31,125, with 803 households (11.0%) in this group.
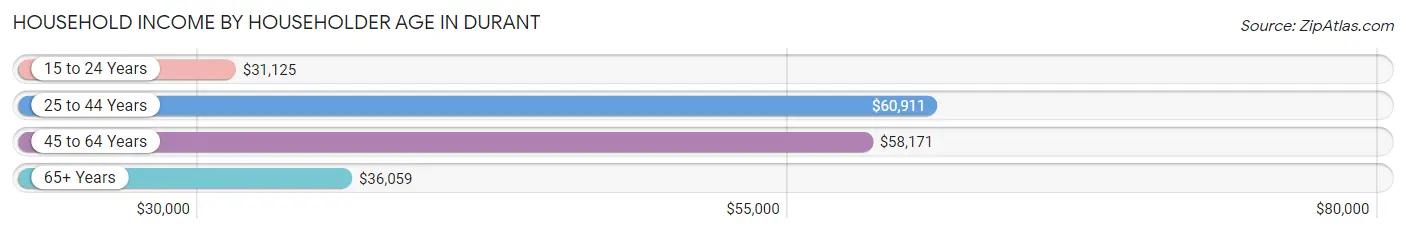
| Income Bracket | # Households | Median Income |
| 15 to 24 Years | 803 (11.0%) | $31,125 |
| 25 to 44 Years | 2,515 (34.4%) | $60,911 |
| 45 to 64 Years | 2,216 (30.3%) | $58,171 |
| 65+ Years | 1,782 (24.4%) | $36,059 |
| Total | 7,316 (100.0%) | $44,593 |
Poverty in Durant
Income Below Poverty by Sex and Age in Durant
With 19.1% poverty level for males and 19.7% for females among the residents of Durant, under 5 year old males and 5 year old females are the most vulnerable to poverty, with 187 males (37.9%) and 51 females (44.7%) in their respective age groups living below the poverty level.
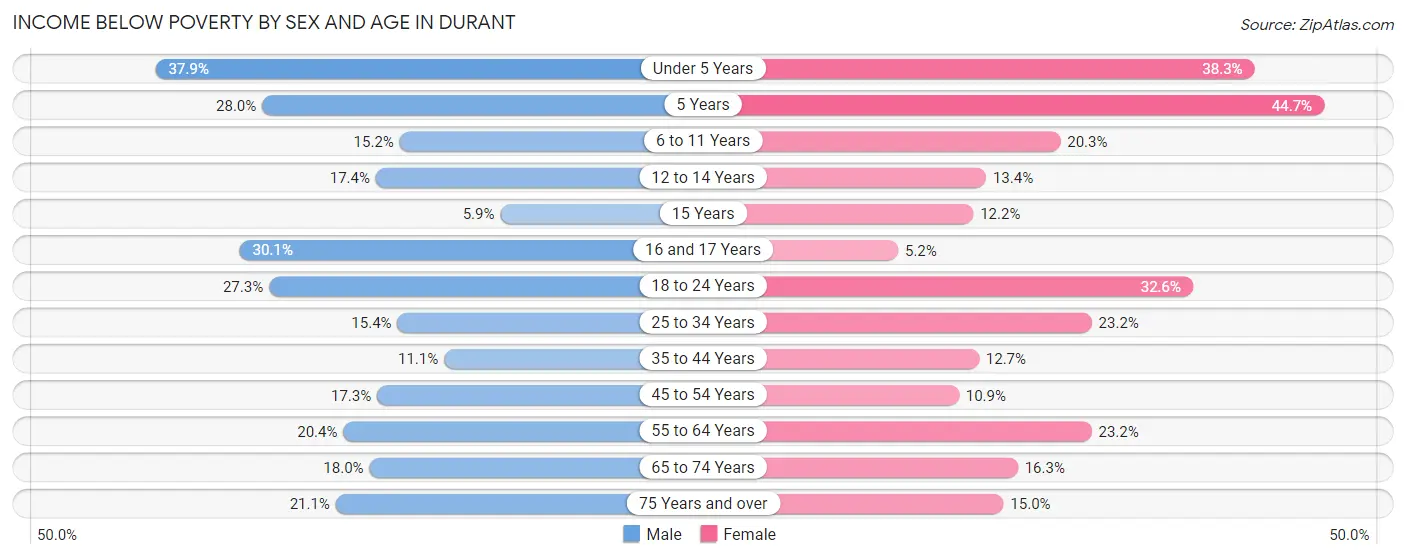
| Age Bracket | Male | Female |
| Under 5 Years | 187 (37.9%) | 152 (38.3%) |
| 5 Years | 26 (28.0%) | 51 (44.7%) |
| 6 to 11 Years | 101 (15.2%) | 172 (20.3%) |
| 12 to 14 Years | 66 (17.4%) | 55 (13.4%) |
| 15 Years | 10 (5.9%) | 10 (12.2%) |
| 16 and 17 Years | 55 (30.0%) | 14 (5.2%) |
| 18 to 24 Years | 292 (27.3%) | 328 (32.6%) |
| 25 to 34 Years | 222 (15.4%) | 323 (23.2%) |
| 35 to 44 Years | 129 (11.1%) | 143 (12.7%) |
| 45 to 54 Years | 162 (17.3%) | 114 (10.9%) |
| 55 to 64 Years | 174 (20.4%) | 194 (23.2%) |
| 65 to 74 Years | 110 (18.0%) | 154 (16.3%) |
| 75 Years and over | 86 (21.1%) | 123 (15.0%) |
| Total | 1,620 (19.1%) | 1,833 (19.7%) |
Income Above Poverty by Sex and Age in Durant
According to the poverty statistics in Durant, males aged 15 years and females aged 16 and 17 years are the age groups that are most secure financially, with 94.2% of males and 94.8% of females in these age groups living above the poverty line.
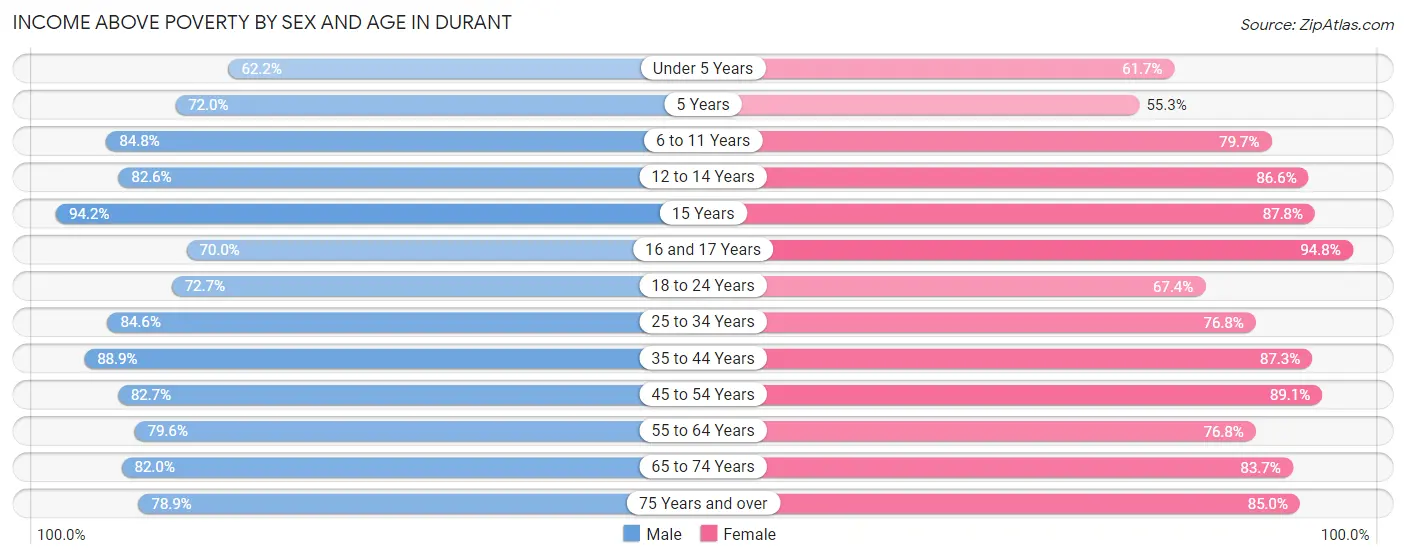
| Age Bracket | Male | Female |
| Under 5 Years | 307 (62.2%) | 245 (61.7%) |
| 5 Years | 67 (72.0%) | 63 (55.3%) |
| 6 to 11 Years | 564 (84.8%) | 676 (79.7%) |
| 12 to 14 Years | 313 (82.6%) | 356 (86.6%) |
| 15 Years | 161 (94.2%) | 72 (87.8%) |
| 16 and 17 Years | 128 (70.0%) | 254 (94.8%) |
| 18 to 24 Years | 777 (72.7%) | 679 (67.4%) |
| 25 to 34 Years | 1,220 (84.6%) | 1,070 (76.8%) |
| 35 to 44 Years | 1,036 (88.9%) | 981 (87.3%) |
| 45 to 54 Years | 775 (82.7%) | 936 (89.1%) |
| 55 to 64 Years | 678 (79.6%) | 643 (76.8%) |
| 65 to 74 Years | 501 (82.0%) | 789 (83.7%) |
| 75 Years and over | 321 (78.9%) | 697 (85.0%) |
| Total | 6,848 (80.9%) | 7,461 (80.3%) |
Income Below Poverty Among Married-Couple Families in Durant
The poverty statistics for married-couple families in Durant show that 11.2% or 287 of the total 2,557 families live below the poverty line. Families with 1 or 2 children have the highest poverty rate of 12.2%, comprising of 94 families. On the other hand, families with 5 or more children have the lowest poverty rate of 0.0%, which includes 0 families.
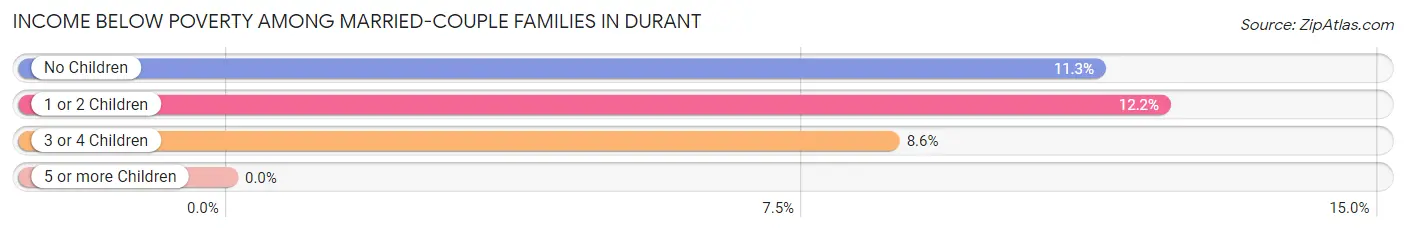
| Children | Above Poverty | Below Poverty |
| No Children | 1,291 (88.7%) | 165 (11.3%) |
| 1 or 2 Children | 678 (87.8%) | 94 (12.2%) |
| 3 or 4 Children | 296 (91.4%) | 28 (8.6%) |
| 5 or more Children | 5 (100.0%) | 0 (0.0%) |
| Total | 2,270 (88.8%) | 287 (11.2%) |
Income Below Poverty Among Single-Parent Households in Durant
According to the poverty data in Durant, 23.9% or 137 single-father households and 22.0% or 263 single-mother households are living below the poverty line. Among single-father households, those with 1 or 2 children have the highest poverty rate, with 118 households (45.7%) experiencing poverty. Likewise, among single-mother households, those with 3 or 4 children have the highest poverty rate, with 91 households (35.5%) falling below the poverty line.
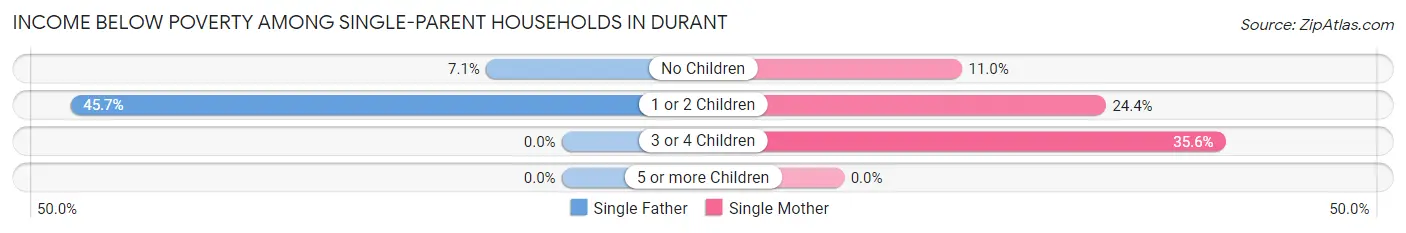
| Children | Single Father | Single Mother |
| No Children | 19 (7.1%) | 45 (11.0%) |
| 1 or 2 Children | 118 (45.7%) | 127 (24.4%) |
| 3 or 4 Children | 0 (0.0%) | 91 (35.5%) |
| 5 or more Children | 0 (0.0%) | 0 (0.0%) |
| Total | 137 (23.9%) | 263 (22.0%) |
Income Below Poverty Among Married-Couple vs Single-Parent Households in Durant
The poverty data for Durant shows that 287 of the married-couple family households (11.2%) and 400 of the single-parent households (22.7%) are living below the poverty level. Within the married-couple family households, those with 1 or 2 children have the highest poverty rate, with 94 households (12.2%) falling below the poverty line. Among the single-parent households, those with 1 or 2 children have the highest poverty rate, with 245 household (31.5%) living below poverty.
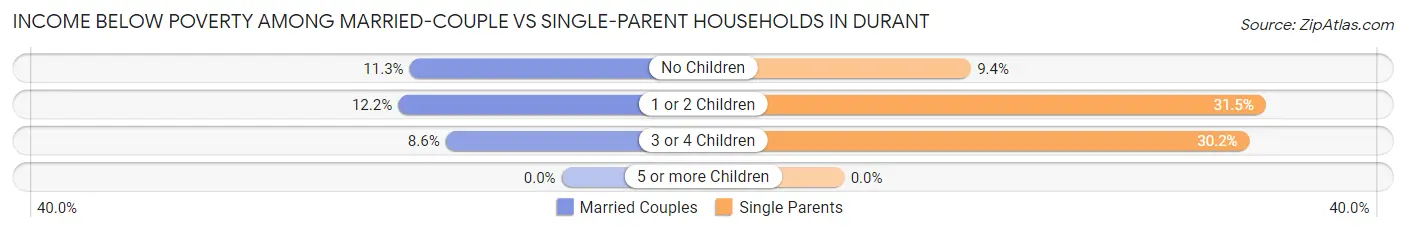
| Children | Married-Couple Families | Single-Parent Households |
| No Children | 165 (11.3%) | 64 (9.4%) |
| 1 or 2 Children | 94 (12.2%) | 245 (31.5%) |
| 3 or 4 Children | 28 (8.6%) | 91 (30.2%) |
| 5 or more Children | 0 (0.0%) | 0 (0.0%) |
| Total | 287 (11.2%) | 400 (22.7%) |
Race in Durant
The most populous races in Durant are White / Caucasian (12,632 | 67.3%), Native / Alaskan (2,649 | 14.1%), and Two or more Races (2,226 | 11.9%).
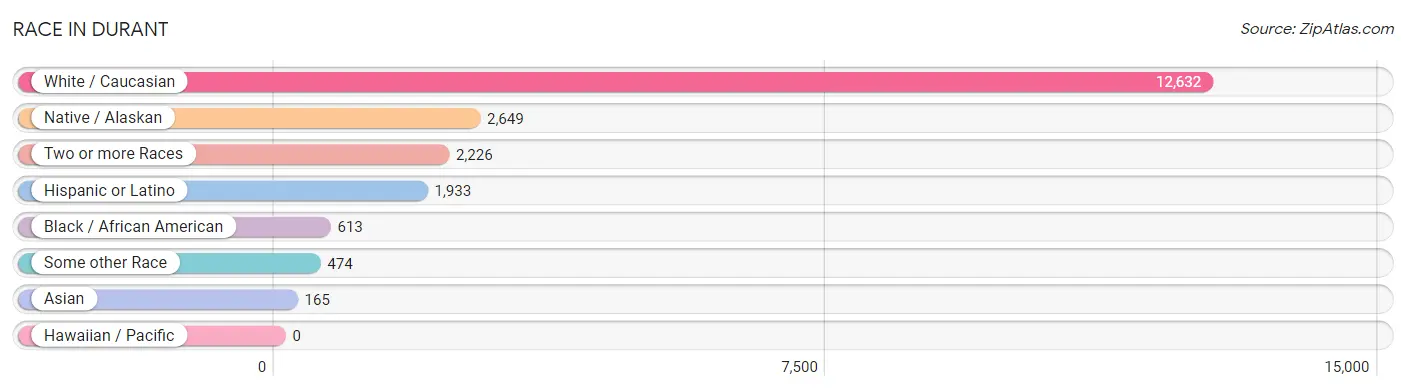
| Race | # Population | % Population |
| Asian | 165 | 0.9% |
| Black / African American | 613 | 3.3% |
| Hawaiian / Pacific | 0 | 0.0% |
| Hispanic or Latino | 1,933 | 10.3% |
| Native / Alaskan | 2,649 | 14.1% |
| White / Caucasian | 12,632 | 67.3% |
| Two or more Races | 2,226 | 11.9% |
| Some other Race | 474 | 2.5% |
| Total | 18,759 | 100.0% |
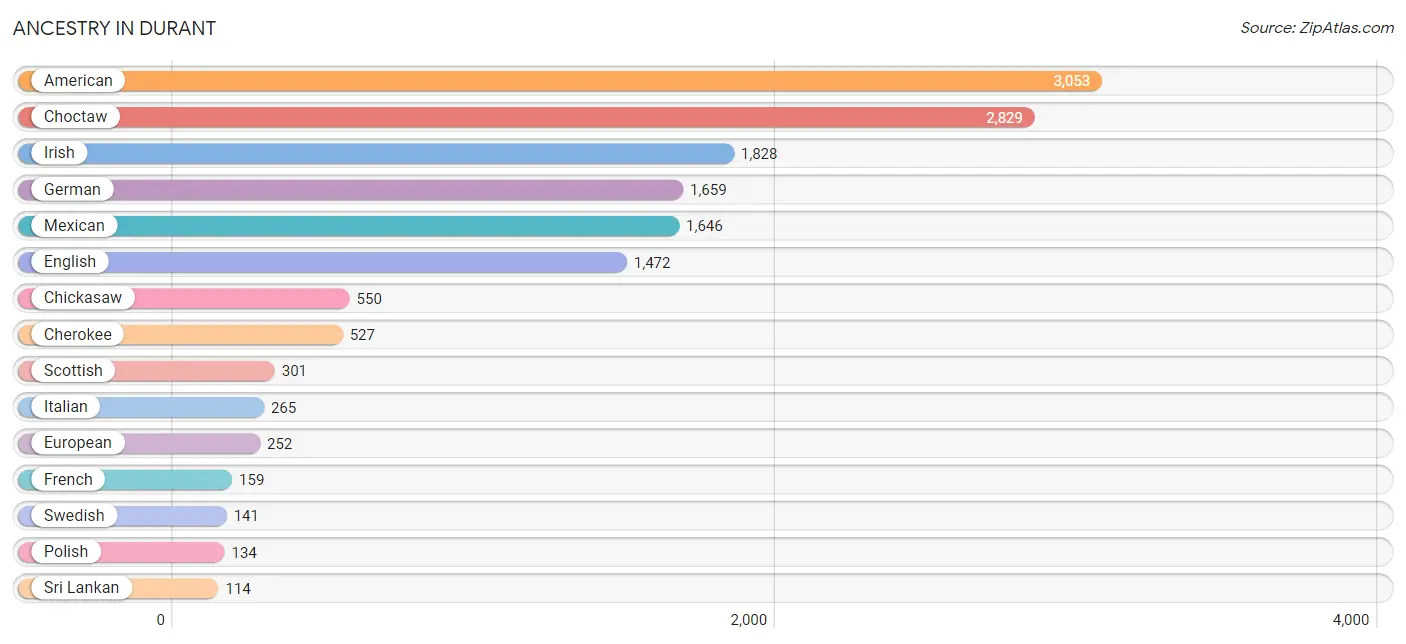
Ancestry in Durant
The most populous ancestries reported in Durant are American (3,053 | 16.3%), Choctaw (2,829 | 15.1%), Irish (1,828 | 9.7%), German (1,659 | 8.8%), and Mexican (1,646 | 8.8%), together accounting for 58.7% of all Durant residents.
| Ancestry | # Population | % Population |
| African | 71 | 0.4% |
| American | 3,053 | 16.3% |
| Arab | 25 | 0.1% |
| Australian | 18 | 0.1% |
| Blackfeet | 22 | 0.1% |
| British | 34 | 0.2% |
| Burmese | 6 | 0.0% |
| Central American | 45 | 0.2% |
| Central American Indian | 15 | 0.1% |
| Cherokee | 527 | 2.8% |
| Chickasaw | 550 | 2.9% |
| Choctaw | 2,829 | 15.1% |
| Cree | 8 | 0.0% |
| Creek | 63 | 0.3% |
| Czech | 9 | 0.1% |
| Czechoslovakian | 8 | 0.0% |
| Danish | 59 | 0.3% |
| Dutch | 53 | 0.3% |
| Dutch West Indian | 51 | 0.3% |
| English | 1,472 | 7.9% |
| European | 252 | 1.3% |
| Finnish | 6 | 0.0% |
| French | 159 | 0.9% |
| French Canadian | 10 | 0.1% |
| German | 1,659 | 8.8% |
| Guamanian / Chamorro | 7 | 0.0% |
| Indian (Asian) | 43 | 0.2% |
| Irish | 1,828 | 9.7% |
| Israeli | 17 | 0.1% |
| Italian | 265 | 1.4% |
| Kiowa | 8 | 0.0% |
| Korean | 50 | 0.3% |
| Laotian | 16 | 0.1% |
| Macedonian | 35 | 0.2% |
| Mexican | 1,646 | 8.8% |
| Moroccan | 24 | 0.1% |
| Navajo | 111 | 0.6% |
| Northern European | 54 | 0.3% |
| Norwegian | 106 | 0.6% |
| Peruvian | 39 | 0.2% |
| Polish | 134 | 0.7% |
| Potawatomi | 60 | 0.3% |
| Pueblo | 15 | 0.1% |
| Puerto Rican | 48 | 0.3% |
| Russian | 40 | 0.2% |
| Salvadoran | 45 | 0.2% |
| Scandinavian | 16 | 0.1% |
| Scotch-Irish | 72 | 0.4% |
| Scottish | 301 | 1.6% |
| Seminole | 17 | 0.1% |
| Slovak | 6 | 0.0% |
| South African | 14 | 0.1% |
| South American | 55 | 0.3% |
| Spaniard | 52 | 0.3% |
| Spanish | 10 | 0.1% |
| Sri Lankan | 114 | 0.6% |
| Subsaharan African | 85 | 0.4% |
| Swedish | 141 | 0.7% |
| Thai | 47 | 0.3% |
| Tohono O'Odham | 3 | 0.0% |
| Venezuelan | 16 | 0.1% |
| Welsh | 104 | 0.5% | View All 62 Rows |
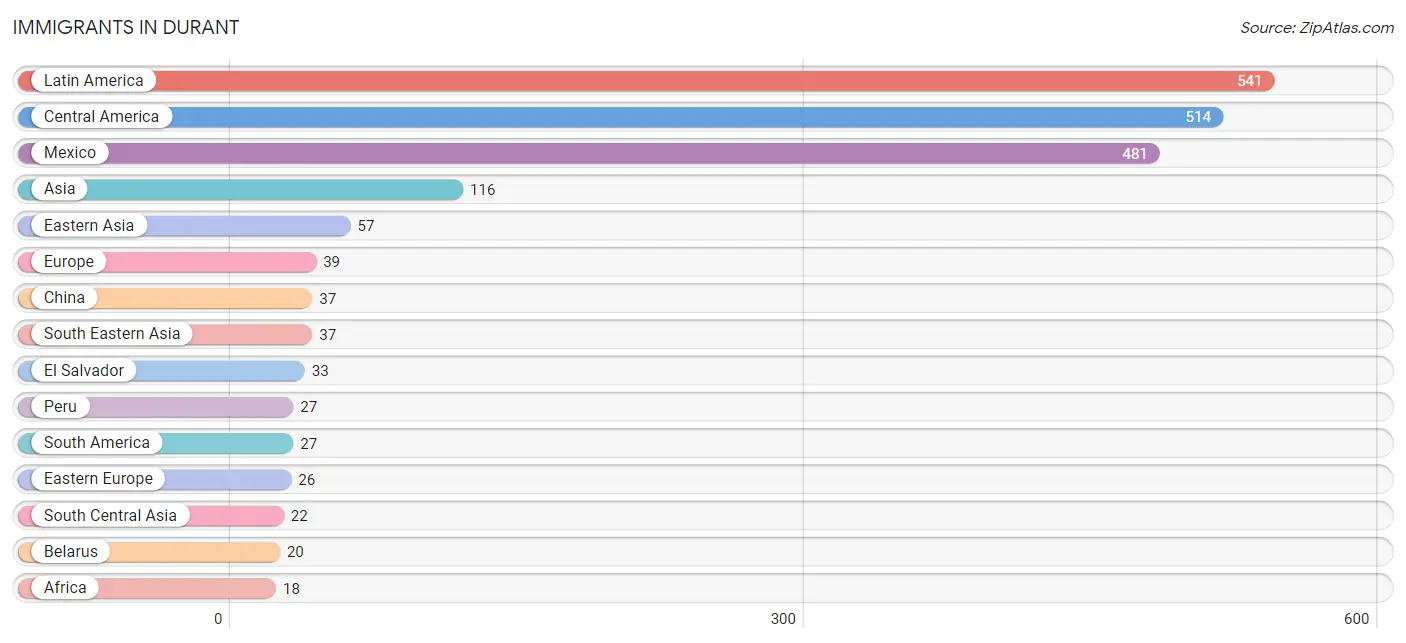
Immigrants in Durant
The most numerous immigrant groups reported in Durant came from Latin America (541 | 2.9%), Central America (514 | 2.7%), Mexico (481 | 2.6%), Asia (116 | 0.6%), and Eastern Asia (57 | 0.3%), together accounting for 9.1% of all Durant residents.
| Immigration Origin | # Population | % Population |
| Africa | 18 | 0.1% |
| Asia | 116 | 0.6% |
| Belarus | 20 | 0.1% |
| Canada | 8 | 0.0% |
| Central America | 514 | 2.7% |
| China | 37 | 0.2% |
| Eastern Asia | 57 | 0.3% |
| Eastern Europe | 26 | 0.1% |
| El Salvador | 33 | 0.2% |
| Europe | 39 | 0.2% |
| Germany | 13 | 0.1% |
| India | 5 | 0.0% |
| Indonesia | 6 | 0.0% |
| Japan | 11 | 0.1% |
| Korea | 9 | 0.1% |
| Latin America | 541 | 2.9% |
| Mexico | 481 | 2.6% |
| Middle Africa | 4 | 0.0% |
| Nepal | 17 | 0.1% |
| Peru | 27 | 0.1% |
| Philippines | 14 | 0.1% |
| Russia | 6 | 0.0% |
| South Africa | 14 | 0.1% |
| South America | 27 | 0.1% |
| South Central Asia | 22 | 0.1% |
| South Eastern Asia | 37 | 0.2% |
| Vietnam | 17 | 0.1% |
| Western Europe | 13 | 0.1% |
| Zaire | 4 | 0.0% | View All 29 Rows |
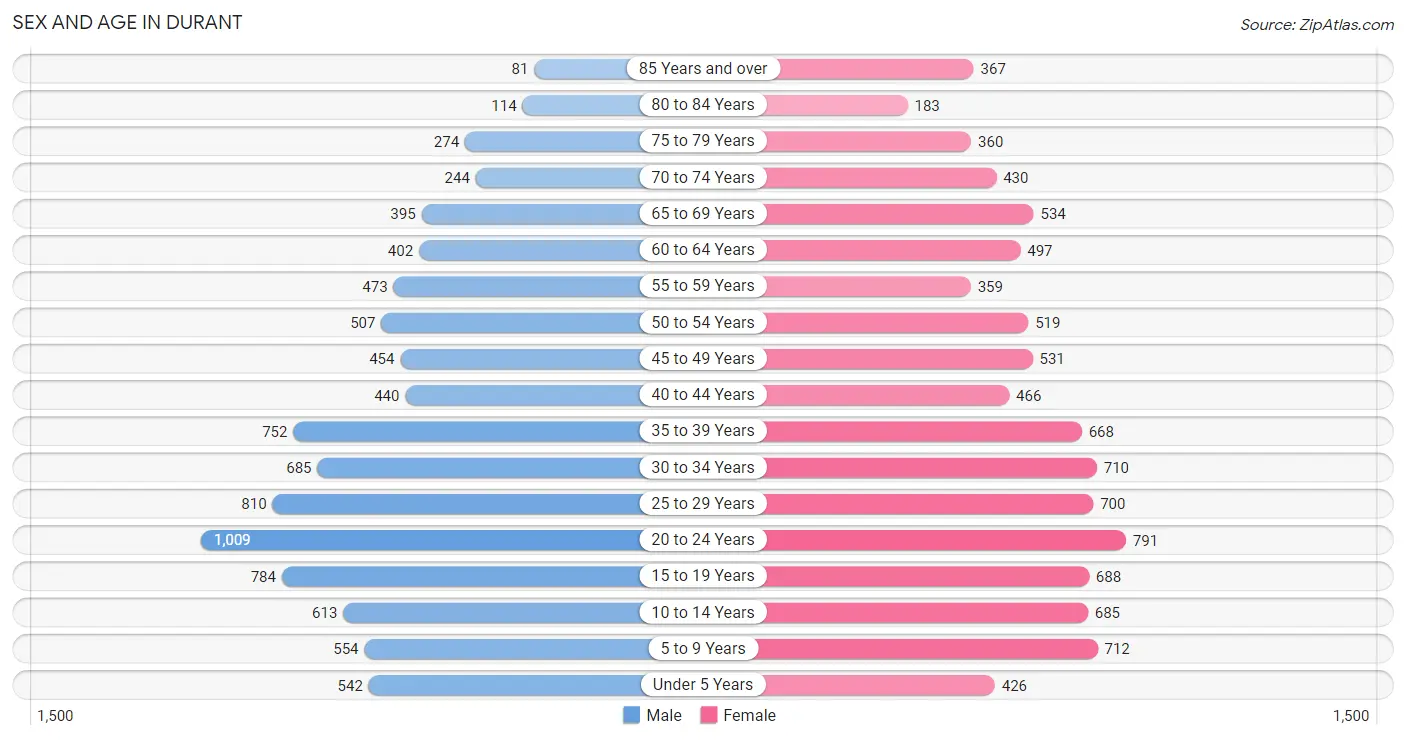
Sex and Age in Durant
Sex and Age in Durant
The most populous age groups in Durant are 20 to 24 Years (1,009 | 11.1%) for men and 20 to 24 Years (791 | 8.2%) for women.
| Age Bracket | Male | Female |
| Under 5 Years | 542 (5.9%) | 426 (4.4%) |
| 5 to 9 Years | 554 (6.1%) | 712 (7.4%) |
| 10 to 14 Years | 613 (6.7%) | 685 (7.1%) |
| 15 to 19 Years | 784 (8.6%) | 688 (7.1%) |
| 20 to 24 Years | 1,009 (11.1%) | 791 (8.2%) |
| 25 to 29 Years | 810 (8.9%) | 700 (7.3%) |
| 30 to 34 Years | 685 (7.5%) | 710 (7.4%) |
| 35 to 39 Years | 752 (8.2%) | 668 (6.9%) |
| 40 to 44 Years | 440 (4.8%) | 466 (4.8%) |
| 45 to 49 Years | 454 (5.0%) | 531 (5.5%) |
| 50 to 54 Years | 507 (5.6%) | 519 (5.4%) |
| 55 to 59 Years | 473 (5.2%) | 359 (3.7%) |
| 60 to 64 Years | 402 (4.4%) | 497 (5.2%) |
| 65 to 69 Years | 395 (4.3%) | 534 (5.6%) |
| 70 to 74 Years | 244 (2.7%) | 430 (4.5%) |
| 75 to 79 Years | 274 (3.0%) | 360 (3.7%) |
| 80 to 84 Years | 114 (1.3%) | 183 (1.9%) |
| 85 Years and over | 81 (0.9%) | 367 (3.8%) |
| Total | 9,133 (100.0%) | 9,626 (100.0%) |
Families and Households in Durant
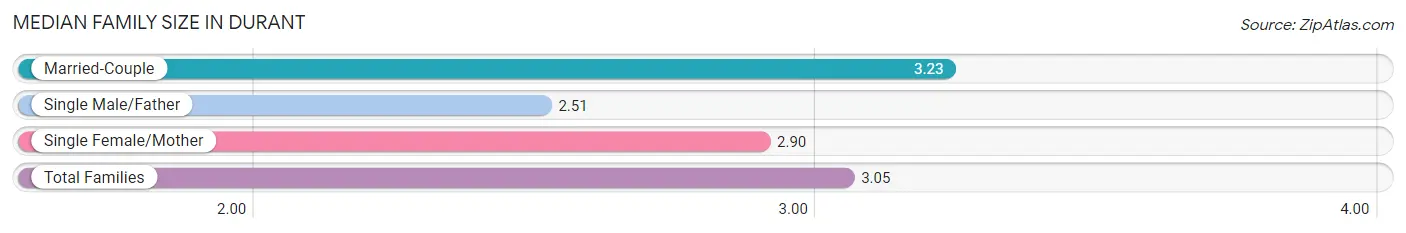
Median Family Size in Durant
The median family size in Durant is 3.05 persons per family, with married-couple families (2,557 | 59.2%) accounting for the largest median family size of 3.23 persons per family. On the other hand, single male/father families (572 | 13.2%) represent the smallest median family size with 2.51 persons per family.
| Family Type | # Families | Family Size |
| Married-Couple | 2,557 (59.2%) | 3.23 |
| Single Male/Father | 572 (13.2%) | 2.51 |
| Single Female/Mother | 1,194 (27.6%) | 2.90 |
| Total Families | 4,323 (100.0%) | 3.05 |
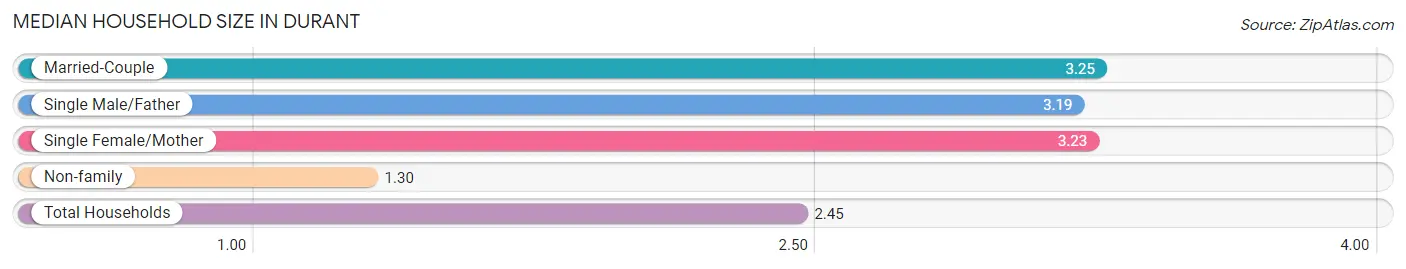
Median Household Size in Durant
The median household size in Durant is 2.45 persons per household, with married-couple households (2,557 | 34.9%) accounting for the largest median household size of 3.25 persons per household. non-family households (2,993 | 40.9%) represent the smallest median household size with 1.30 persons per household.
| Household Type | # Households | Household Size |
| Married-Couple | 2,557 (34.9%) | 3.25 |
| Single Male/Father | 572 (7.8%) | 3.19 |
| Single Female/Mother | 1,194 (16.3%) | 3.23 |
| Non-family | 2,993 (40.9%) | 1.30 |
| Total Households | 7,316 (100.0%) | 2.45 |
Household Size by Marriage Status in Durant
Out of a total of 7,316 households in Durant, 4,323 (59.1%) are family households, while 2,993 (40.9%) are nonfamily households. The most numerous type of family households are 2-person households, comprising 1,925, and the most common type of nonfamily households are 1-person households, comprising 2,446.
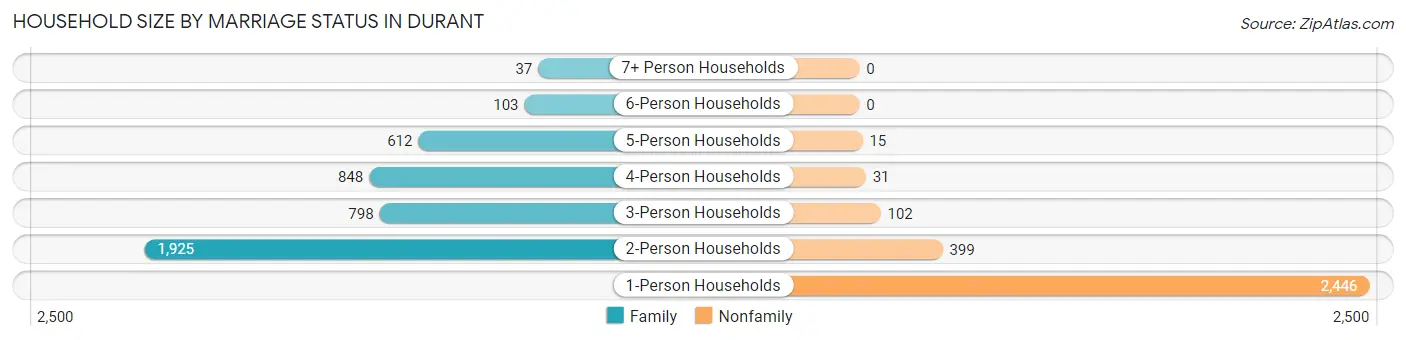
| Household Size | Family Households | Nonfamily Households |
| 1-Person Households | - | 2,446 (33.4%) |
| 2-Person Households | 1,925 (26.3%) | 399 (5.4%) |
| 3-Person Households | 798 (10.9%) | 102 (1.4%) |
| 4-Person Households | 848 (11.6%) | 31 (0.4%) |
| 5-Person Households | 612 (8.4%) | 15 (0.2%) |
| 6-Person Households | 103 (1.4%) | 0 (0.0%) |
| 7+ Person Households | 37 (0.5%) | 0 (0.0%) |
| Total | 4,323 (59.1%) | 2,993 (40.9%) |
Female Fertility in Durant
Fertility by Age in Durant
Average fertility rate in Durant is 29.0 births per 1,000 women. Women in the age bracket of 20 to 34 years have the highest fertility rate with 47.0 births per 1,000 women. Women in the age bracket of 20 to 34 years acount for 77.6% of all women with births.
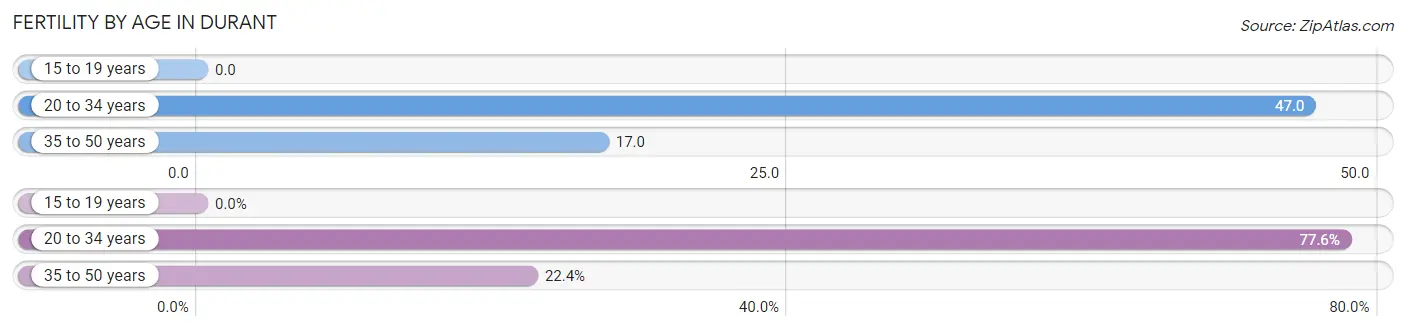
| Age Bracket | Women with Births | Births / 1,000 Women |
| 15 to 19 years | 0 (0.0%) | 0.0 |
| 20 to 34 years | 104 (77.6%) | 47.0 |
| 35 to 50 years | 30 (22.4%) | 17.0 |
| Total | 134 (100.0%) | 29.0 |
Fertility by Age by Marriage Status in Durant
59.0% of women with births (134) in Durant are married. The highest percentage of unmarried women with births falls into 20 to 34 years age bracket with 44.2% of them unmarried at the time of birth, while the lowest percentage of unmarried women with births belong to 35 to 50 years age bracket with 30.0% of them unmarried.
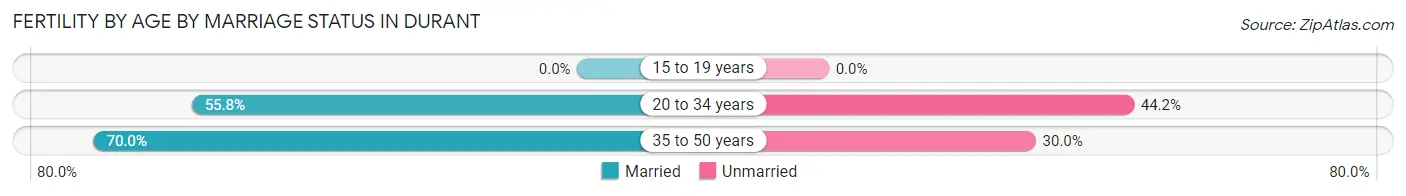
| Age Bracket | Married | Unmarried |
| 15 to 19 years | 0 (0.0%) | 0 (0.0%) |
| 20 to 34 years | 58 (55.8%) | 46 (44.2%) |
| 35 to 50 years | 21 (70.0%) | 9 (30.0%) |
| Total | 79 (59.0%) | 55 (41.0%) |
Fertility by Education in Durant
Average fertility rate in Durant is 29.0 births per 1,000 women. Women with the education attainment of graduate degree have the highest fertility rate of 56.0 births per 1,000 women, while women with the education attainment of bachelor's degree have the lowest fertility at 13.0 births per 1,000 women. Women with the education attainment of college or associate's degree represent 41.8% of all women with births.
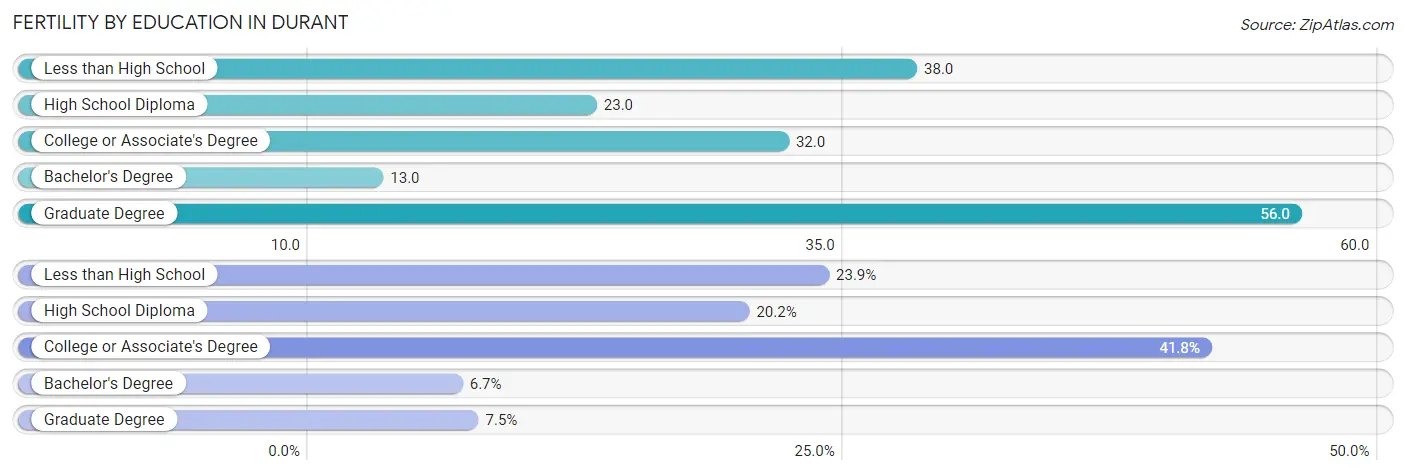
| Educational Attainment | Women with Births | Births / 1,000 Women |
| Less than High School | 32 (23.9%) | 38.0 |
| High School Diploma | 27 (20.2%) | 23.0 |
| College or Associate's Degree | 56 (41.8%) | 32.0 |
| Bachelor's Degree | 9 (6.7%) | 13.0 |
| Graduate Degree | 10 (7.5%) | 56.0 |
| Total | 134 (100.0%) | 29.0 |
Fertility by Education by Marriage Status in Durant
41.0% of women with births in Durant are unmarried. Women with the educational attainment of high school diploma are most likely to be married with 100.0% of them married at childbirth, while women with the educational attainment of bachelor's degree are least likely to be married with 100.0% of them unmarried at childbirth.
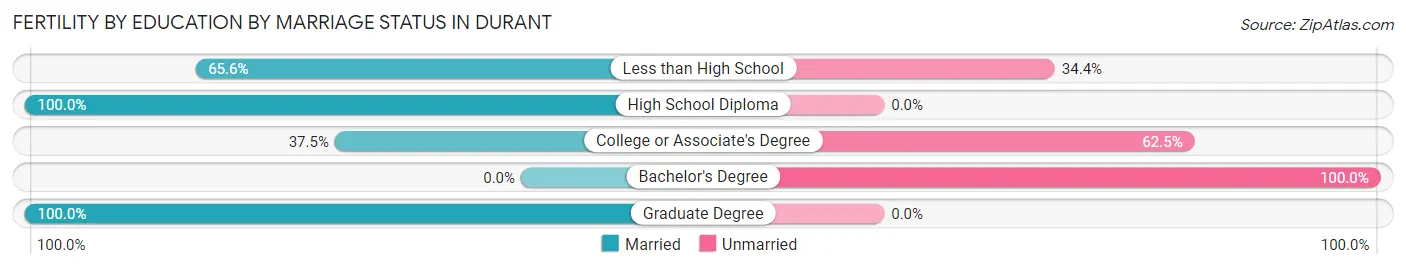
| Educational Attainment | Married | Unmarried |
| Less than High School | 21 (65.6%) | 11 (34.4%) |
| High School Diploma | 27 (100.0%) | 0 (0.0%) |
| College or Associate's Degree | 21 (37.5%) | 35 (62.5%) |
| Bachelor's Degree | 0 (0.0%) | 9 (100.0%) |
| Graduate Degree | 10 (100.0%) | 0 (0.0%) |
| Total | 79 (59.0%) | 55 (41.0%) |
Employment Characteristics in Durant
Employment by Class of Employer in Durant
Among the 8,421 employed individuals in Durant, private company employees (5,799 | 68.9%), state government employees (825 | 9.8%), and federal government employees (614 | 7.3%) make up the most common classes of employment.
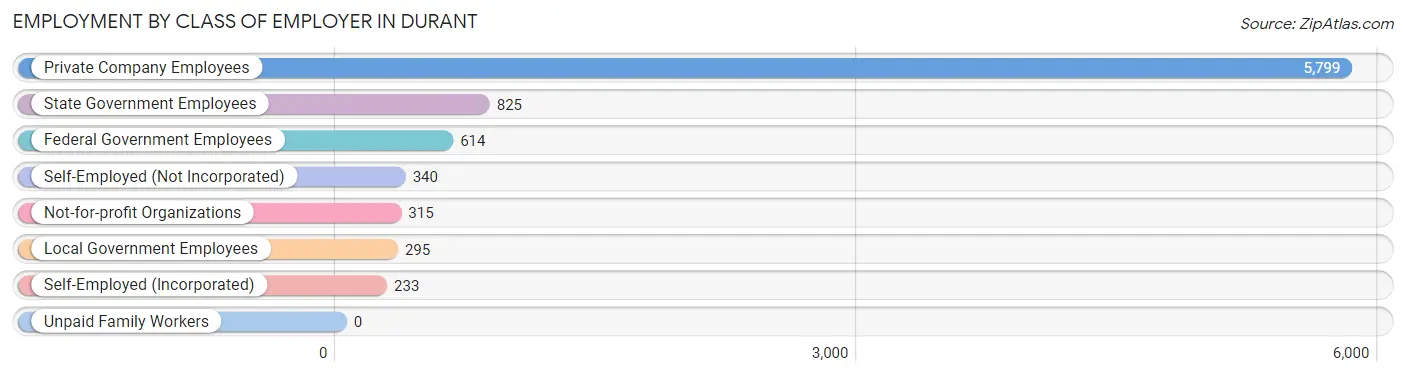
| Employer Class | # Employees | % Employees |
| Private Company Employees | 5,799 | 68.9% |
| Self-Employed (Incorporated) | 233 | 2.8% |
| Self-Employed (Not Incorporated) | 340 | 4.0% |
| Not-for-profit Organizations | 315 | 3.7% |
| Local Government Employees | 295 | 3.5% |
| State Government Employees | 825 | 9.8% |
| Federal Government Employees | 614 | 7.3% |
| Unpaid Family Workers | 0 | 0.0% |
| Total | 8,421 | 100.0% |
Employment Status by Age in Durant
According to the labor force statistics for Durant, out of the total population over 16 years of age (14,970), 60.7% or 9,087 individuals are in the labor force, with 5.5% or 500 of them unemployed. The age group with the highest labor force participation rate is 30 to 34 years, with 89.7% or 1,251 individuals in the labor force. Within the labor force, the 25 to 29 years age range has the highest percentage of unemployed individuals, with 12.1% or 149 of them being unemployed.
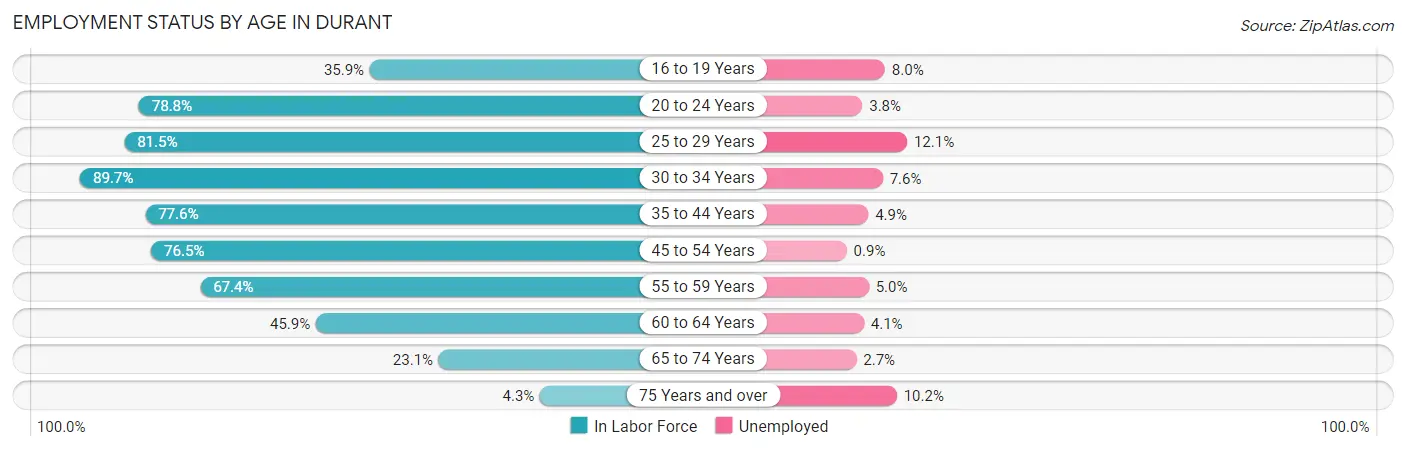
| Age Bracket | In Labor Force | Unemployed |
| 16 to 19 Years | 436 (35.9%) | 35 (8.0%) |
| 20 to 24 Years | 1,418 (78.8%) | 54 (3.8%) |
| 25 to 29 Years | 1,231 (81.5%) | 149 (12.1%) |
| 30 to 34 Years | 1,251 (89.7%) | 95 (7.6%) |
| 35 to 44 Years | 1,805 (77.6%) | 88 (4.9%) |
| 45 to 54 Years | 1,538 (76.5%) | 14 (0.9%) |
| 55 to 59 Years | 561 (67.4%) | 28 (5.0%) |
| 60 to 64 Years | 413 (45.9%) | 17 (4.1%) |
| 65 to 74 Years | 370 (23.1%) | 10 (2.7%) |
| 75 Years and over | 59 (4.3%) | 6 (10.2%) |
| Total | 9,087 (60.7%) | 500 (5.5%) |
Employment Status by Educational Attainment in Durant
According to labor force statistics for Durant, 75.8% of individuals (6,802) out of the total population between 25 and 64 years of age (8,973) are in the labor force, with 5.8% or 395 of them being unemployed. The group with the highest labor force participation rate are those with the educational attainment of bachelor's degree or higher, with 89.8% or 2,073 individuals in the labor force. Within the labor force, individuals with less than high school education have the highest percentage of unemployment, with 12.6% or 82 of them being unemployed.
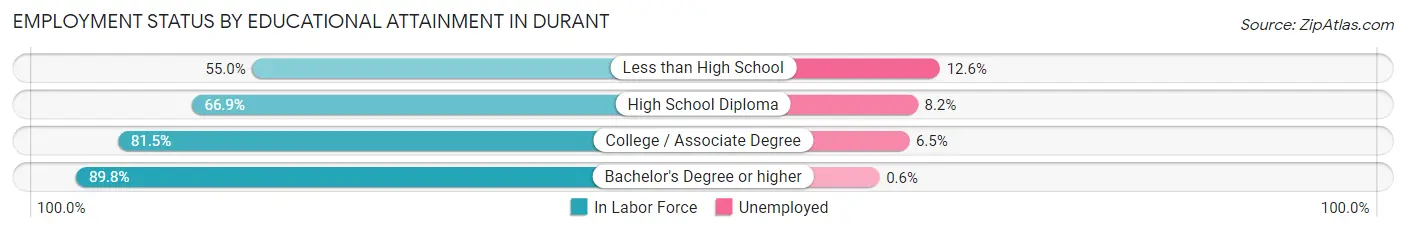
| Educational Attainment | In Labor Force | Unemployed |
| Less than High School | 653 (55.0%) | 150 (12.6%) |
| High School Diploma | 1,784 (66.9%) | 219 (8.2%) |
| College / Associate Degree | 2,292 (81.5%) | 183 (6.5%) |
| Bachelor's Degree or higher | 2,073 (89.8%) | 14 (0.6%) |
| Total | 6,802 (75.8%) | 520 (5.8%) |
Employment Occupations by Sex in Durant
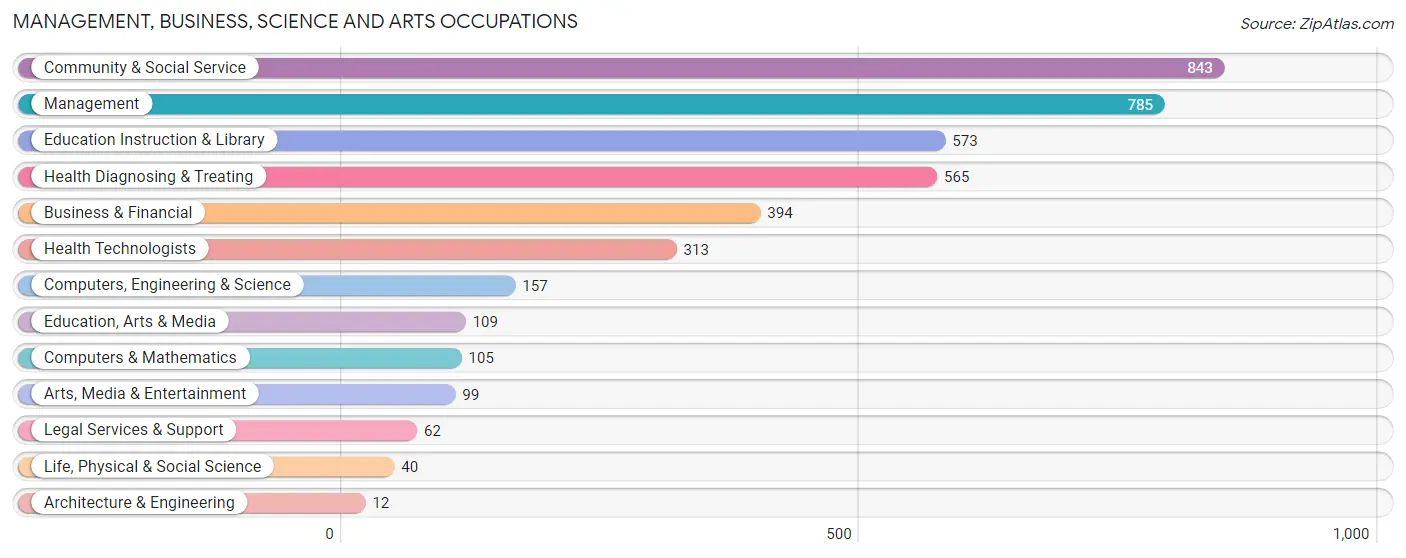
Management, Business, Science and Arts Occupations
The most common Management, Business, Science and Arts occupations in Durant are Community & Social Service (843 | 9.8%), Management (785 | 9.2%), Education Instruction & Library (573 | 6.7%), Health Diagnosing & Treating (565 | 6.6%), and Business & Financial (394 | 4.6%).
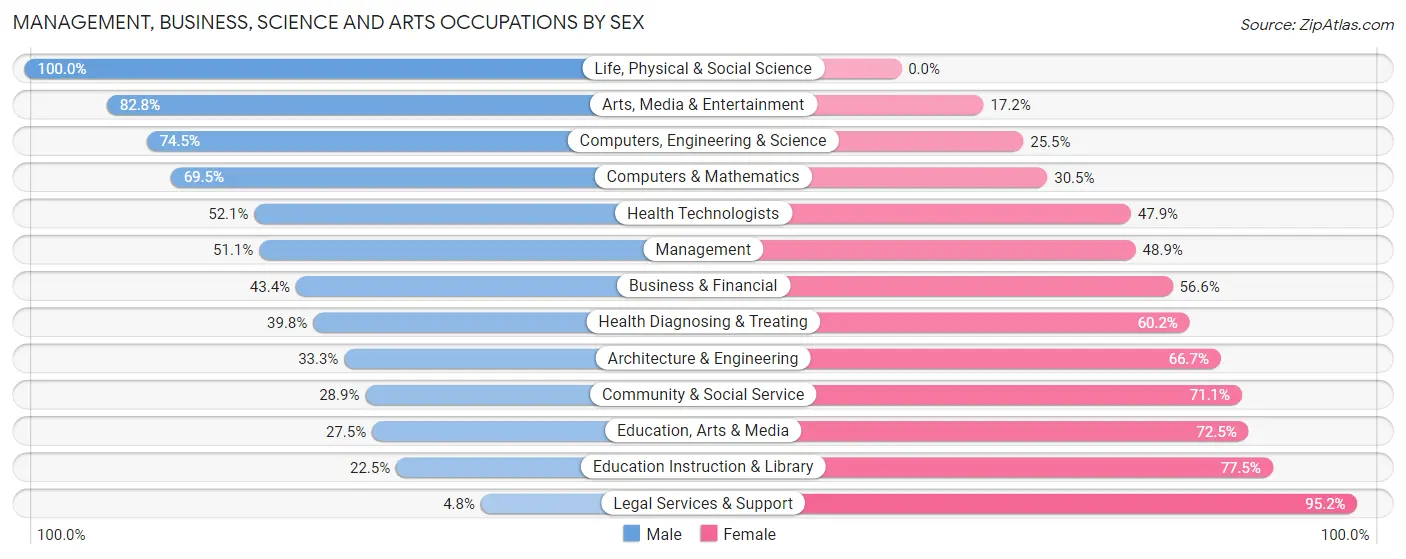
Management, Business, Science and Arts Occupations by Sex
Within the Management, Business, Science and Arts occupations in Durant, the most male-oriented occupations are Life, Physical & Social Science (100.0%), Arts, Media & Entertainment (82.8%), and Computers, Engineering & Science (74.5%), while the most female-oriented occupations are Legal Services & Support (95.2%), Education Instruction & Library (77.5%), and Education, Arts & Media (72.5%).
| Occupation | Male | Female |
| Management | 401 (51.1%) | 384 (48.9%) |
| Business & Financial | 171 (43.4%) | 223 (56.6%) |
| Computers, Engineering & Science | 117 (74.5%) | 40 (25.5%) |
| Computers & Mathematics | 73 (69.5%) | 32 (30.5%) |
| Architecture & Engineering | 4 (33.3%) | 8 (66.7%) |
| Life, Physical & Social Science | 40 (100.0%) | 0 (0.0%) |
| Community & Social Service | 244 (28.9%) | 599 (71.1%) |
| Education, Arts & Media | 30 (27.5%) | 79 (72.5%) |
| Legal Services & Support | 3 (4.8%) | 59 (95.2%) |
| Education Instruction & Library | 129 (22.5%) | 444 (77.5%) |
| Arts, Media & Entertainment | 82 (82.8%) | 17 (17.2%) |
| Health Diagnosing & Treating | 225 (39.8%) | 340 (60.2%) |
| Health Technologists | 163 (52.1%) | 150 (47.9%) |
| Total (Category) | 1,158 (42.2%) | 1,586 (57.8%) |
| Total (Overall) | 4,586 (53.5%) | 3,983 (46.5%) |
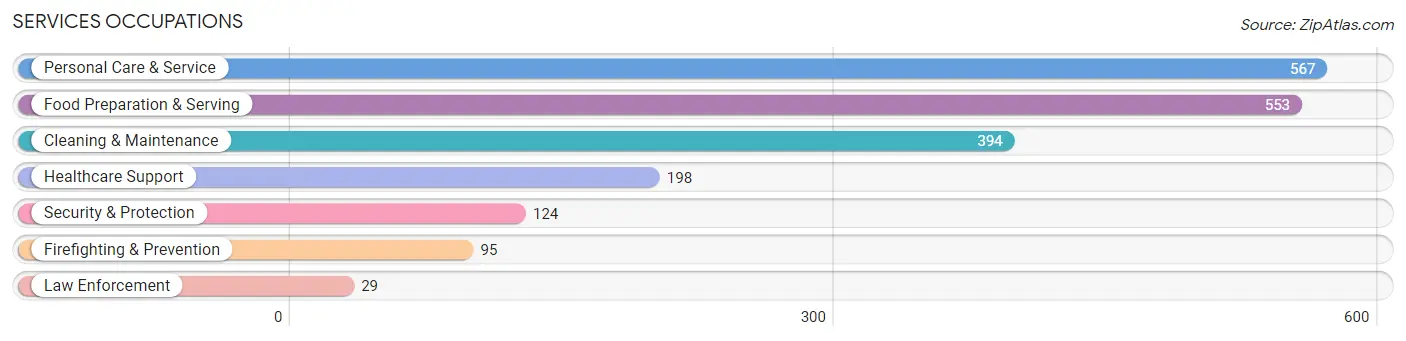
Services Occupations
The most common Services occupations in Durant are Personal Care & Service (567 | 6.6%), Food Preparation & Serving (553 | 6.5%), Cleaning & Maintenance (394 | 4.6%), Healthcare Support (198 | 2.3%), and Security & Protection (124 | 1.5%).
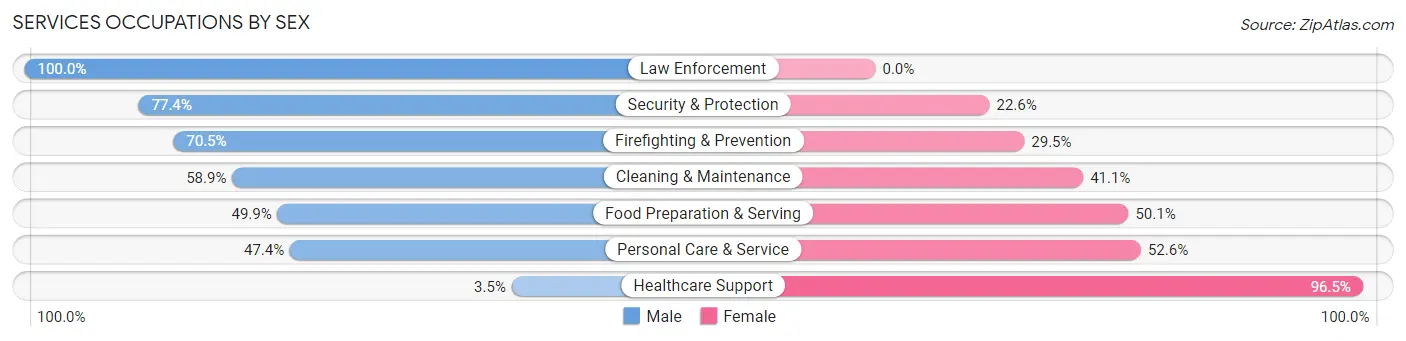
Services Occupations by Sex
Within the Services occupations in Durant, the most male-oriented occupations are Law Enforcement (100.0%), Security & Protection (77.4%), and Firefighting & Prevention (70.5%), while the most female-oriented occupations are Healthcare Support (96.5%), Personal Care & Service (52.6%), and Food Preparation & Serving (50.1%).
| Occupation | Male | Female |
| Healthcare Support | 7 (3.5%) | 191 (96.5%) |
| Security & Protection | 96 (77.4%) | 28 (22.6%) |
| Firefighting & Prevention | 67 (70.5%) | 28 (29.5%) |
| Law Enforcement | 29 (100.0%) | 0 (0.0%) |
| Food Preparation & Serving | 276 (49.9%) | 277 (50.1%) |
| Cleaning & Maintenance | 232 (58.9%) | 162 (41.1%) |
| Personal Care & Service | 269 (47.4%) | 298 (52.6%) |
| Total (Category) | 880 (47.9%) | 956 (52.1%) |
| Total (Overall) | 4,586 (53.5%) | 3,983 (46.5%) |
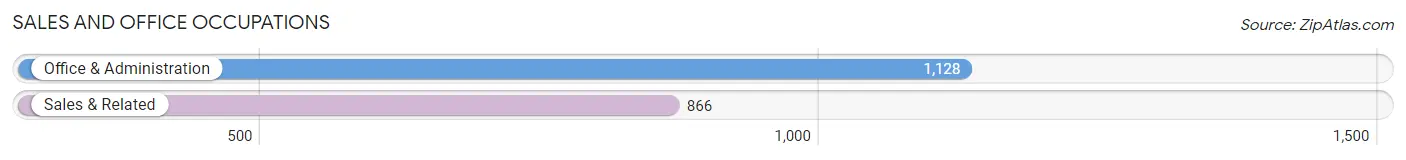
Sales and Office Occupations
The most common Sales and Office occupations in Durant are Office & Administration (1,128 | 13.2%), and Sales & Related (866 | 10.1%).
Sales and Office Occupations by Sex
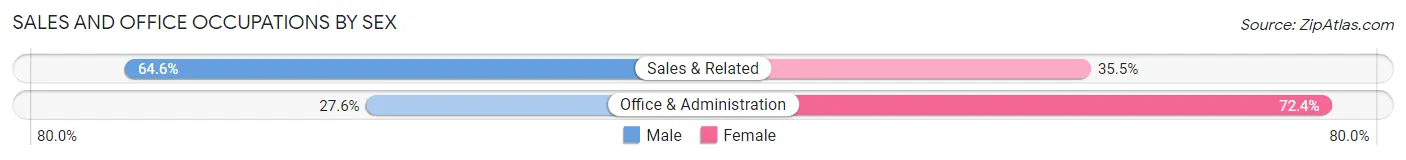
| Occupation | Male | Female |
| Sales & Related | 559 (64.5%) | 307 (35.4%) |
| Office & Administration | 311 (27.6%) | 817 (72.4%) |
| Total (Category) | 870 (43.6%) | 1,124 (56.4%) |
| Total (Overall) | 4,586 (53.5%) | 3,983 (46.5%) |
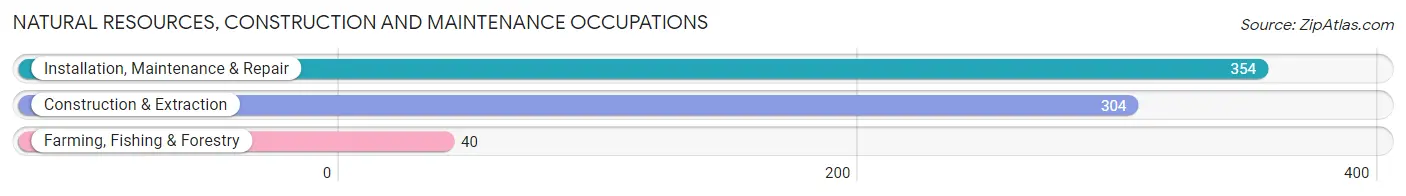
Natural Resources, Construction and Maintenance Occupations
The most common Natural Resources, Construction and Maintenance occupations in Durant are Installation, Maintenance & Repair (354 | 4.1%), Construction & Extraction (304 | 3.5%), and Farming, Fishing & Forestry (40 | 0.5%).
Natural Resources, Construction and Maintenance Occupations by Sex
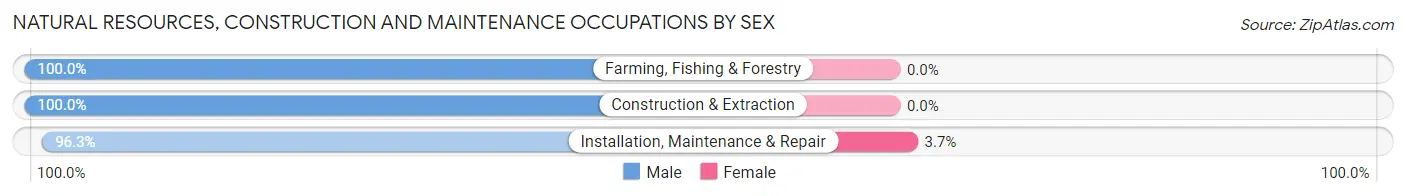
| Occupation | Male | Female |
| Farming, Fishing & Forestry | 40 (100.0%) | 0 (0.0%) |
| Construction & Extraction | 304 (100.0%) | 0 (0.0%) |
| Installation, Maintenance & Repair | 341 (96.3%) | 13 (3.7%) |
| Total (Category) | 685 (98.1%) | 13 (1.9%) |
| Total (Overall) | 4,586 (53.5%) | 3,983 (46.5%) |
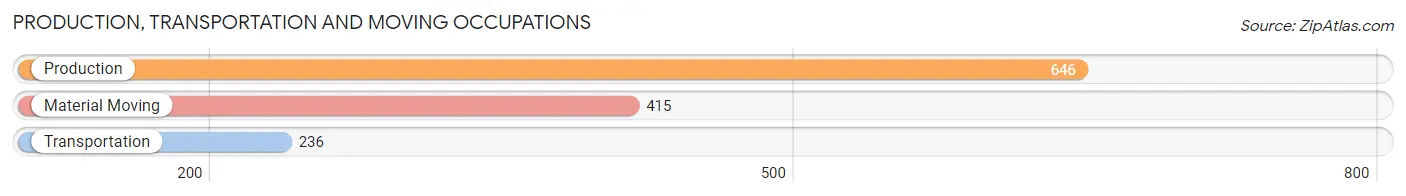
Production, Transportation and Moving Occupations
The most common Production, Transportation and Moving occupations in Durant are Production (646 | 7.5%), Material Moving (415 | 4.8%), and Transportation (236 | 2.8%).
Production, Transportation and Moving Occupations by Sex
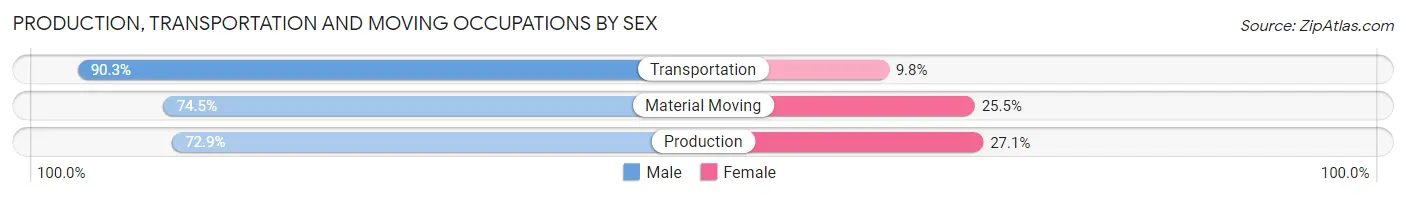
| Occupation | Male | Female |
| Production | 471 (72.9%) | 175 (27.1%) |
| Transportation | 213 (90.2%) | 23 (9.8%) |
| Material Moving | 309 (74.5%) | 106 (25.5%) |
| Total (Category) | 993 (76.6%) | 304 (23.4%) |
| Total (Overall) | 4,586 (53.5%) | 3,983 (46.5%) |
Employment Industries by Sex in Durant
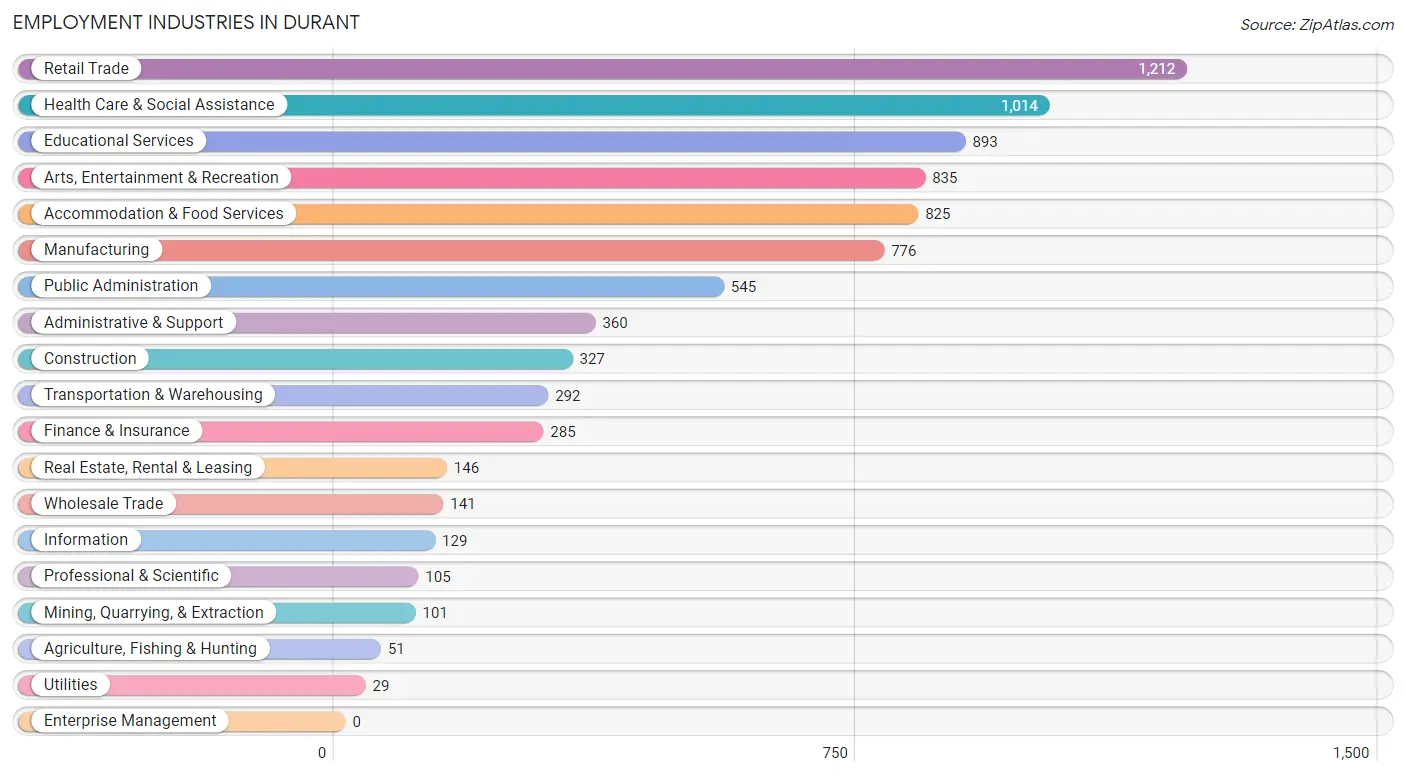
Employment Industries in Durant
The major employment industries in Durant include Retail Trade (1,212 | 14.1%), Health Care & Social Assistance (1,014 | 11.8%), Educational Services (893 | 10.4%), Arts, Entertainment & Recreation (835 | 9.7%), and Accommodation & Food Services (825 | 9.6%).
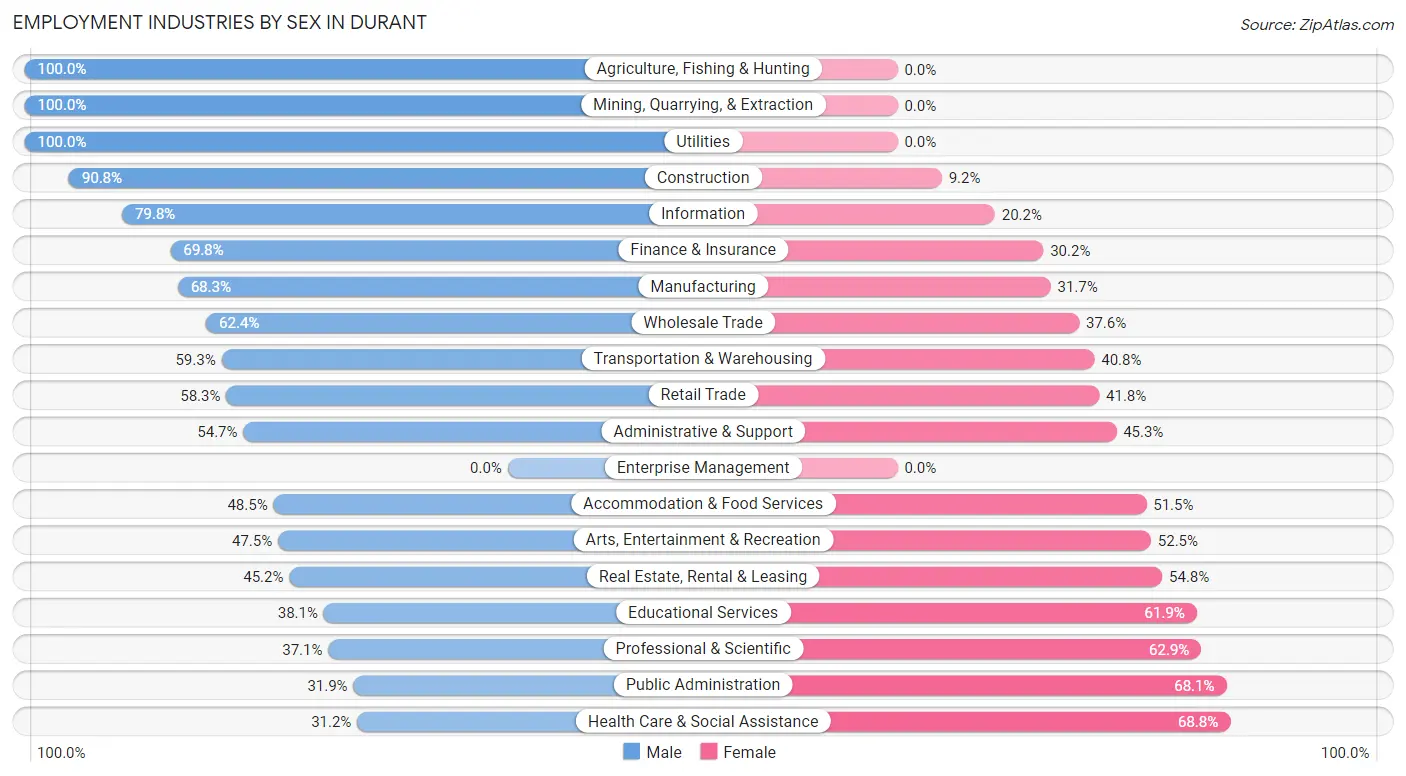
Employment Industries by Sex in Durant
The Durant industries that see more men than women are Agriculture, Fishing & Hunting (100.0%), Mining, Quarrying, & Extraction (100.0%), and Utilities (100.0%), whereas the industries that tend to have a higher number of women are Health Care & Social Assistance (68.8%), Public Administration (68.1%), and Professional & Scientific (62.9%).
| Industry | Male | Female |
| Agriculture, Fishing & Hunting | 51 (100.0%) | 0 (0.0%) |
| Mining, Quarrying, & Extraction | 101 (100.0%) | 0 (0.0%) |
| Construction | 297 (90.8%) | 30 (9.2%) |
| Manufacturing | 530 (68.3%) | 246 (31.7%) |
| Wholesale Trade | 88 (62.4%) | 53 (37.6%) |
| Retail Trade | 706 (58.3%) | 506 (41.7%) |
| Transportation & Warehousing | 173 (59.3%) | 119 (40.7%) |
| Utilities | 29 (100.0%) | 0 (0.0%) |
| Information | 103 (79.8%) | 26 (20.2%) |
| Finance & Insurance | 199 (69.8%) | 86 (30.2%) |
| Real Estate, Rental & Leasing | 66 (45.2%) | 80 (54.8%) |
| Professional & Scientific | 39 (37.1%) | 66 (62.9%) |
| Enterprise Management | 0 (0.0%) | 0 (0.0%) |
| Administrative & Support | 197 (54.7%) | 163 (45.3%) |
| Educational Services | 340 (38.1%) | 553 (61.9%) |
| Health Care & Social Assistance | 316 (31.2%) | 698 (68.8%) |
| Arts, Entertainment & Recreation | 397 (47.5%) | 438 (52.5%) |
| Accommodation & Food Services | 400 (48.5%) | 425 (51.5%) |
| Public Administration | 174 (31.9%) | 371 (68.1%) |
| Total | 4,586 (53.5%) | 3,983 (46.5%) |
Education in Durant
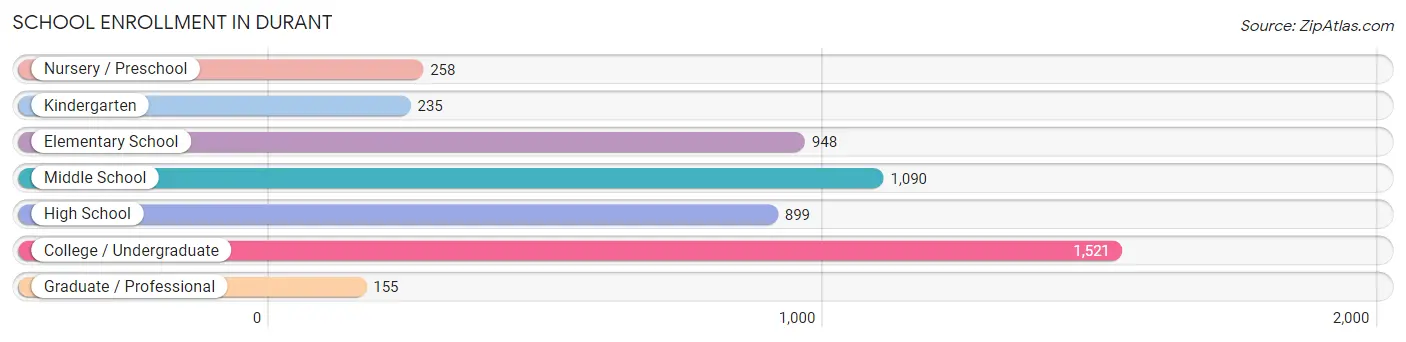
School Enrollment in Durant
The most common levels of schooling among the 5,106 students in Durant are college / undergraduate (1,521 | 29.8%), middle school (1,090 | 21.3%), and elementary school (948 | 18.6%).
| School Level | # Students | % Students |
| Nursery / Preschool | 258 | 5.1% |
| Kindergarten | 235 | 4.6% |
| Elementary School | 948 | 18.6% |
| Middle School | 1,090 | 21.3% |
| High School | 899 | 17.6% |
| College / Undergraduate | 1,521 | 29.8% |
| Graduate / Professional | 155 | 3.0% |
| Total | 5,106 | 100.0% |
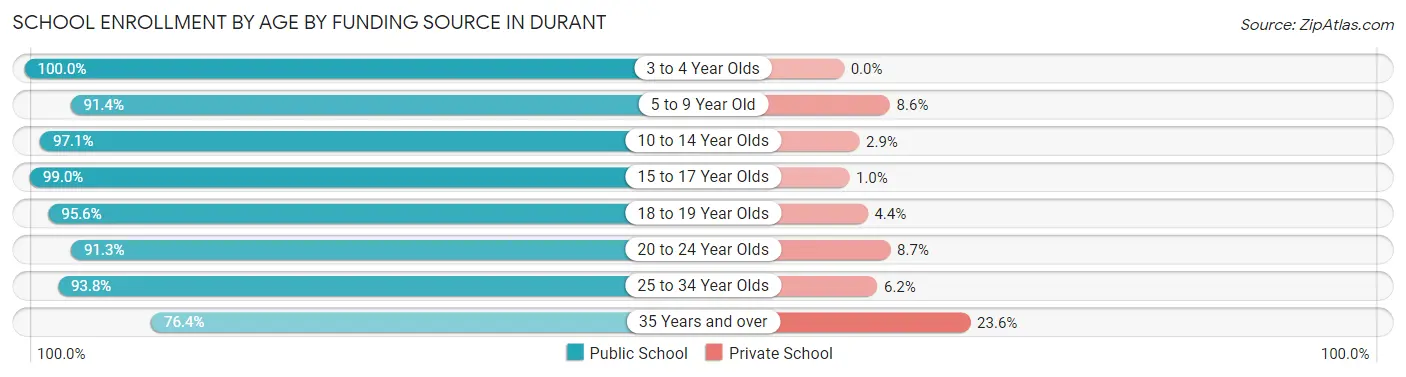
School Enrollment by Age by Funding Source in Durant
Out of a total of 5,106 students who are enrolled in schools in Durant, 296 (5.8%) attend a private institution, while the remaining 4,810 (94.2%) are enrolled in public schools. The age group of 35 years and over has the highest likelihood of being enrolled in private schools, with 49 (23.6% in the age bracket) enrolled. Conversely, the age group of 3 to 4 year olds has the lowest likelihood of being enrolled in a private school, with 187 (100.0% in the age bracket) attending a public institution.
| Age Bracket | Public School | Private School |
| 3 to 4 Year Olds | 187 (100.0%) | 0 (0.0%) |
| 5 to 9 Year Old | 982 (91.4%) | 92 (8.6%) |
| 10 to 14 Year Olds | 1,249 (97.1%) | 37 (2.9%) |
| 15 to 17 Year Olds | 695 (99.0%) | 7 (1.0%) |
| 18 to 19 Year Olds | 582 (95.6%) | 27 (4.4%) |
| 20 to 24 Year Olds | 759 (91.3%) | 72 (8.7%) |
| 25 to 34 Year Olds | 196 (93.8%) | 13 (6.2%) |
| 35 Years and over | 159 (76.4%) | 49 (23.6%) |
| Total | 4,810 (94.2%) | 296 (5.8%) |
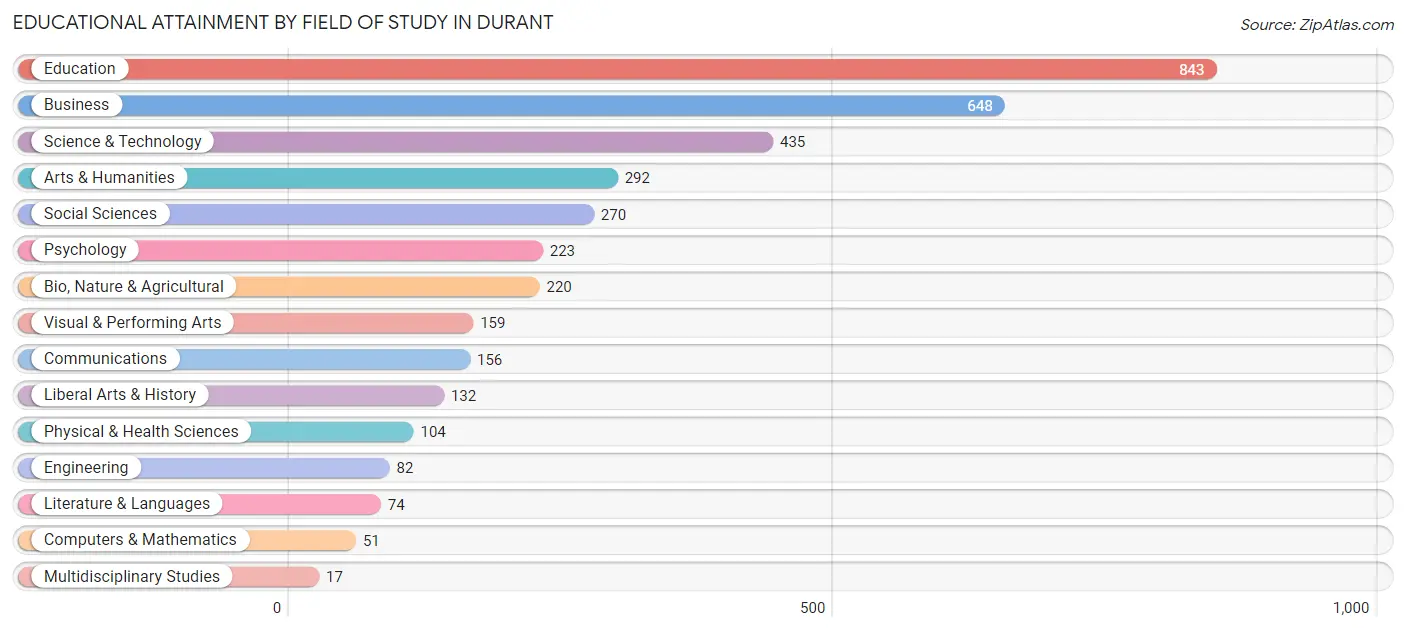
Educational Attainment by Field of Study in Durant
Education (843 | 22.8%), business (648 | 17.5%), science & technology (435 | 11.7%), arts & humanities (292 | 7.9%), and social sciences (270 | 7.3%) are the most common fields of study among 3,706 individuals in Durant who have obtained a bachelor's degree or higher.
| Field of Study | # Graduates | % Graduates |
| Computers & Mathematics | 51 | 1.4% |
| Bio, Nature & Agricultural | 220 | 5.9% |
| Physical & Health Sciences | 104 | 2.8% |
| Psychology | 223 | 6.0% |
| Social Sciences | 270 | 7.3% |
| Engineering | 82 | 2.2% |
| Multidisciplinary Studies | 17 | 0.5% |
| Science & Technology | 435 | 11.7% |
| Business | 648 | 17.5% |
| Education | 843 | 22.8% |
| Literature & Languages | 74 | 2.0% |
| Liberal Arts & History | 132 | 3.6% |
| Visual & Performing Arts | 159 | 4.3% |
| Communications | 156 | 4.2% |
| Arts & Humanities | 292 | 7.9% |
| Total | 3,706 | 100.0% |
Transportation & Commute in Durant
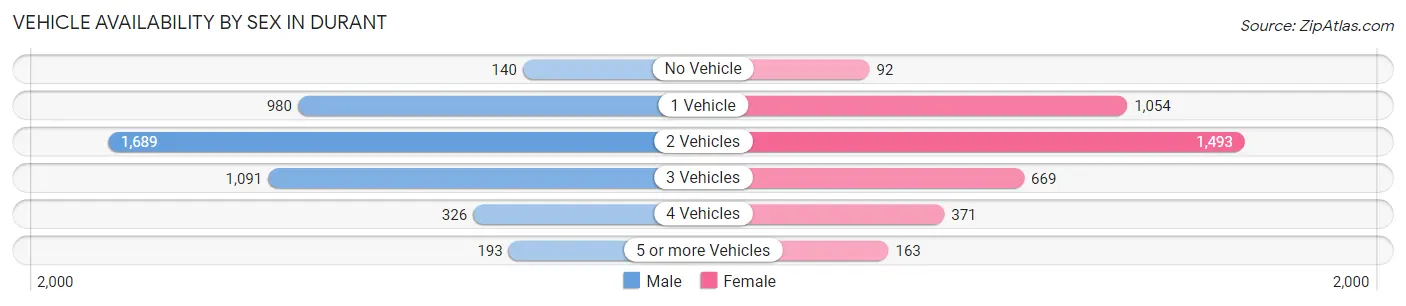
Vehicle Availability by Sex in Durant
The most prevalent vehicle ownership categories in Durant are males with 2 vehicles (1,689, accounting for 38.2%) and females with 2 vehicles (1,493, making up 44.0%).
| Vehicles Available | Male | Female |
| No Vehicle | 140 (3.2%) | 92 (2.4%) |
| 1 Vehicle | 980 (22.2%) | 1,054 (27.4%) |
| 2 Vehicles | 1,689 (38.2%) | 1,493 (38.9%) |
| 3 Vehicles | 1,091 (24.7%) | 669 (17.4%) |
| 4 Vehicles | 326 (7.4%) | 371 (9.7%) |
| 5 or more Vehicles | 193 (4.4%) | 163 (4.2%) |
| Total | 4,419 (100.0%) | 3,842 (100.0%) |
Commute Time in Durant
The most frequently occuring commute durations in Durant are 10 to 14 minutes (2,382 commuters, 29.4%), 5 to 9 minutes (2,175 commuters, 26.8%), and 15 to 19 minutes (1,026 commuters, 12.7%).
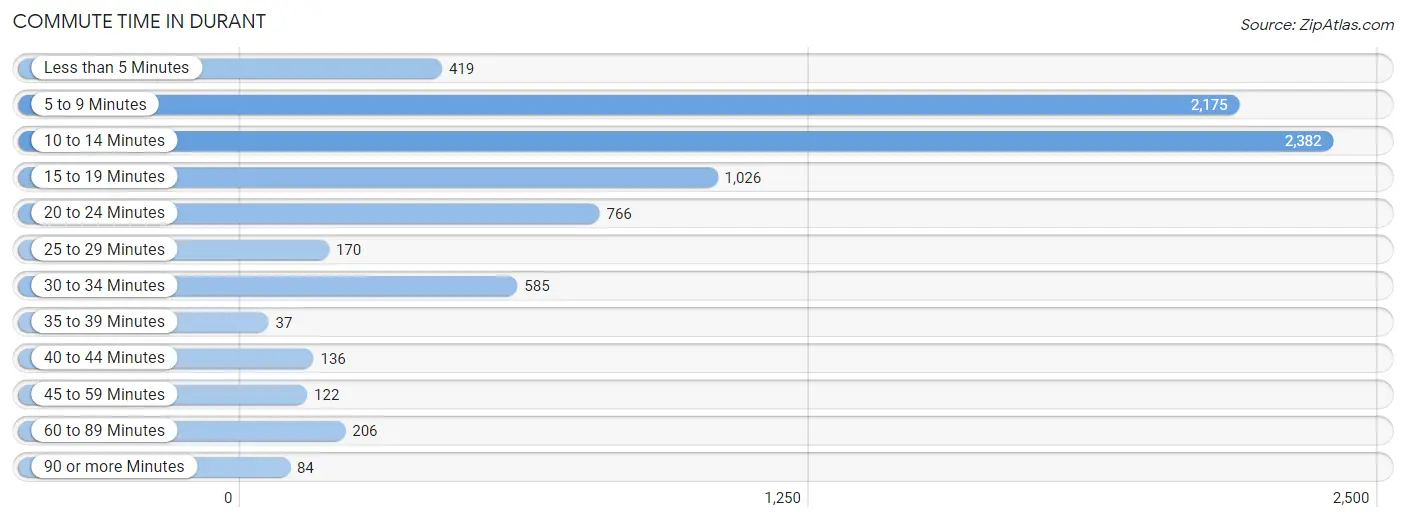
| Commute Time | # Commuters | % Commuters |
| Less than 5 Minutes | 419 | 5.2% |
| 5 to 9 Minutes | 2,175 | 26.8% |
| 10 to 14 Minutes | 2,382 | 29.4% |
| 15 to 19 Minutes | 1,026 | 12.7% |
| 20 to 24 Minutes | 766 | 9.5% |
| 25 to 29 Minutes | 170 | 2.1% |
| 30 to 34 Minutes | 585 | 7.2% |
| 35 to 39 Minutes | 37 | 0.5% |
| 40 to 44 Minutes | 136 | 1.7% |
| 45 to 59 Minutes | 122 | 1.5% |
| 60 to 89 Minutes | 206 | 2.5% |
| 90 or more Minutes | 84 | 1.0% |
Commute Time by Sex in Durant
The most common commute times in Durant are 10 to 14 minutes (1,455 commuters, 33.3%) for males and 5 to 9 minutes (1,249 commuters, 33.4%) for females.
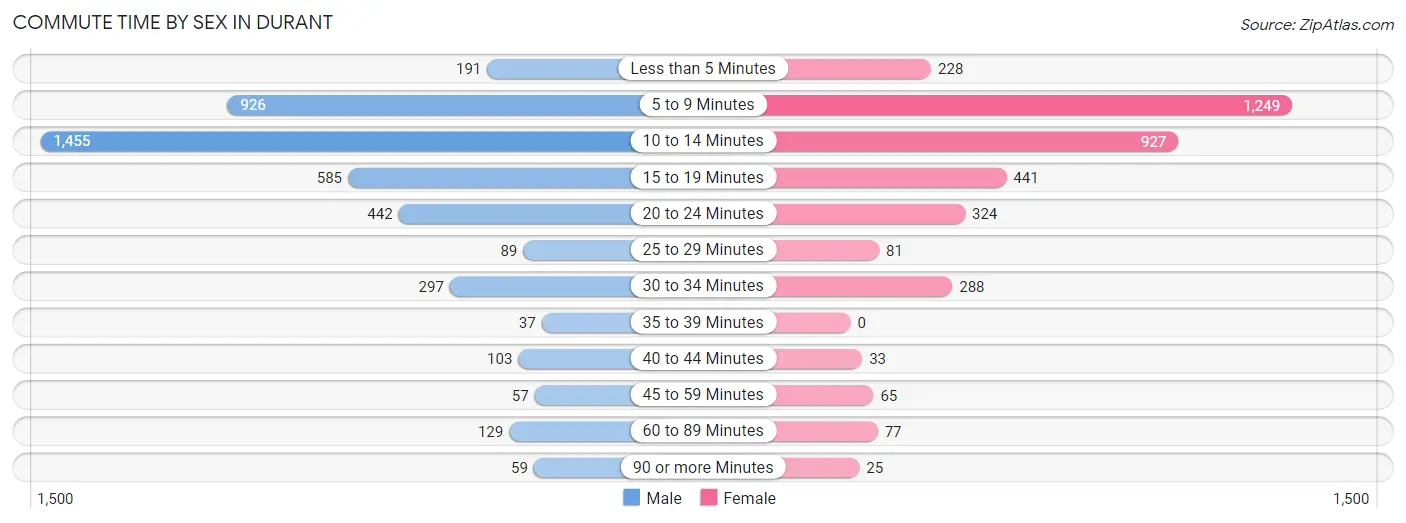
| Commute Time | Male | Female |
| Less than 5 Minutes | 191 (4.4%) | 228 (6.1%) |
| 5 to 9 Minutes | 926 (21.2%) | 1,249 (33.4%) |
| 10 to 14 Minutes | 1,455 (33.3%) | 927 (24.8%) |
| 15 to 19 Minutes | 585 (13.4%) | 441 (11.8%) |
| 20 to 24 Minutes | 442 (10.1%) | 324 (8.7%) |
| 25 to 29 Minutes | 89 (2.0%) | 81 (2.2%) |
| 30 to 34 Minutes | 297 (6.8%) | 288 (7.7%) |
| 35 to 39 Minutes | 37 (0.9%) | 0 (0.0%) |
| 40 to 44 Minutes | 103 (2.4%) | 33 (0.9%) |
| 45 to 59 Minutes | 57 (1.3%) | 65 (1.7%) |
| 60 to 89 Minutes | 129 (2.9%) | 77 (2.1%) |
| 90 or more Minutes | 59 (1.3%) | 25 (0.7%) |
Time of Departure to Work by Sex in Durant
The most frequent times of departure to work in Durant are 7:30 AM to 7:59 AM (772, 17.7%) for males and 7:30 AM to 7:59 AM (821, 22.0%) for females.
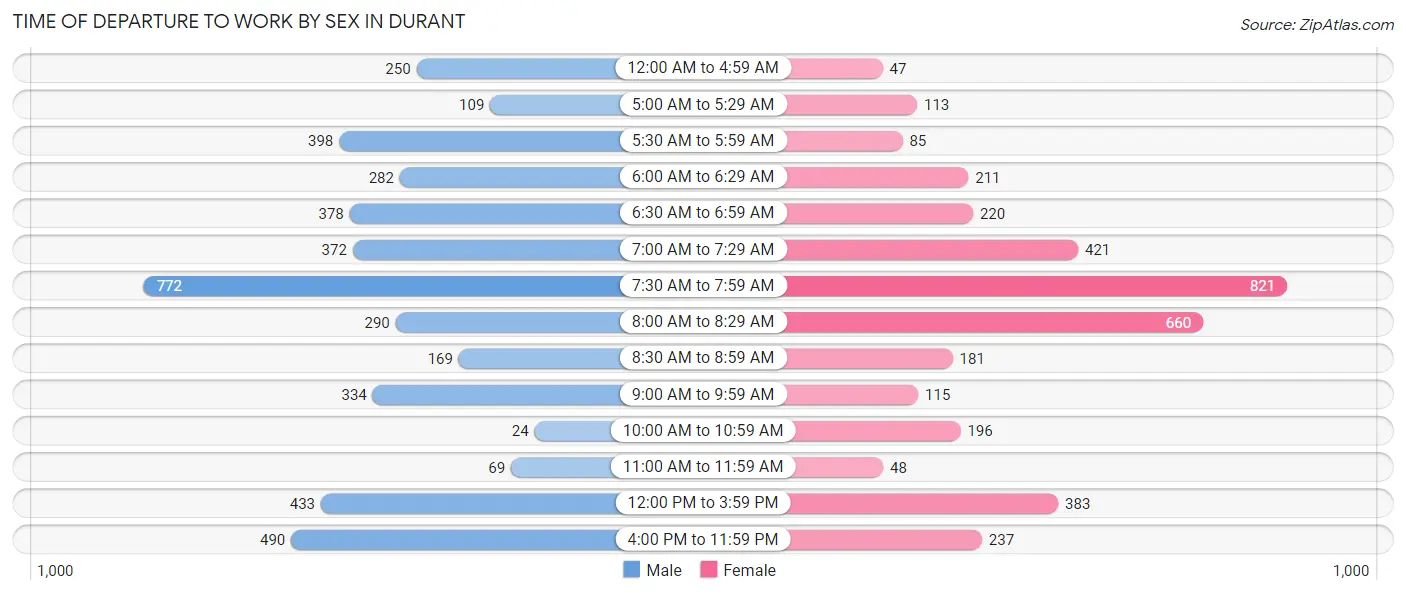
| Time of Departure | Male | Female |
| 12:00 AM to 4:59 AM | 250 (5.7%) | 47 (1.3%) |
| 5:00 AM to 5:29 AM | 109 (2.5%) | 113 (3.0%) |
| 5:30 AM to 5:59 AM | 398 (9.1%) | 85 (2.3%) |
| 6:00 AM to 6:29 AM | 282 (6.5%) | 211 (5.6%) |
| 6:30 AM to 6:59 AM | 378 (8.6%) | 220 (5.9%) |
| 7:00 AM to 7:29 AM | 372 (8.5%) | 421 (11.3%) |
| 7:30 AM to 7:59 AM | 772 (17.7%) | 821 (22.0%) |
| 8:00 AM to 8:29 AM | 290 (6.6%) | 660 (17.7%) |
| 8:30 AM to 8:59 AM | 169 (3.9%) | 181 (4.8%) |
| 9:00 AM to 9:59 AM | 334 (7.6%) | 115 (3.1%) |
| 10:00 AM to 10:59 AM | 24 (0.5%) | 196 (5.2%) |
| 11:00 AM to 11:59 AM | 69 (1.6%) | 48 (1.3%) |
| 12:00 PM to 3:59 PM | 433 (9.9%) | 383 (10.2%) |
| 4:00 PM to 11:59 PM | 490 (11.2%) | 237 (6.3%) |
| Total | 4,370 (100.0%) | 3,738 (100.0%) |
Housing Occupancy in Durant
Occupancy by Ownership in Durant
Of the total 7,316 dwellings in Durant, owner-occupied units account for 3,354 (45.8%), while renter-occupied units make up 3,962 (54.2%).
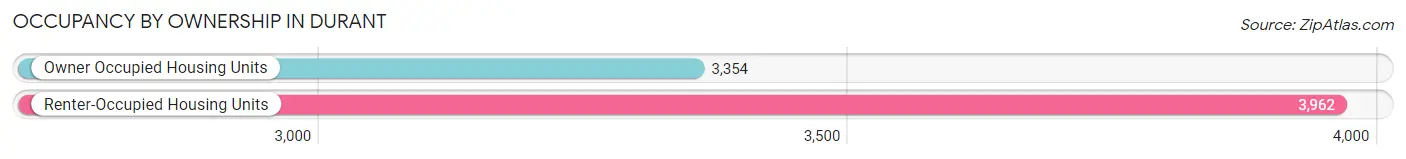
| Occupancy | # Housing Units | % Housing Units |
| Owner Occupied Housing Units | 3,354 | 45.8% |
| Renter-Occupied Housing Units | 3,962 | 54.2% |
| Total Occupied Housing Units | 7,316 | 100.0% |
Occupancy by Household Size in Durant
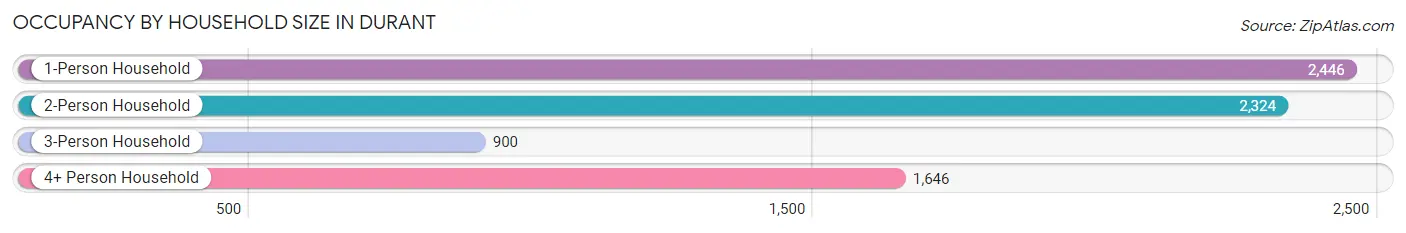
| Household Size | # Housing Units | % Housing Units |
| 1-Person Household | 2,446 | 33.4% |
| 2-Person Household | 2,324 | 31.8% |
| 3-Person Household | 900 | 12.3% |
| 4+ Person Household | 1,646 | 22.5% |
| Total Housing Units | 7,316 | 100.0% |
Occupancy by Ownership by Household Size in Durant
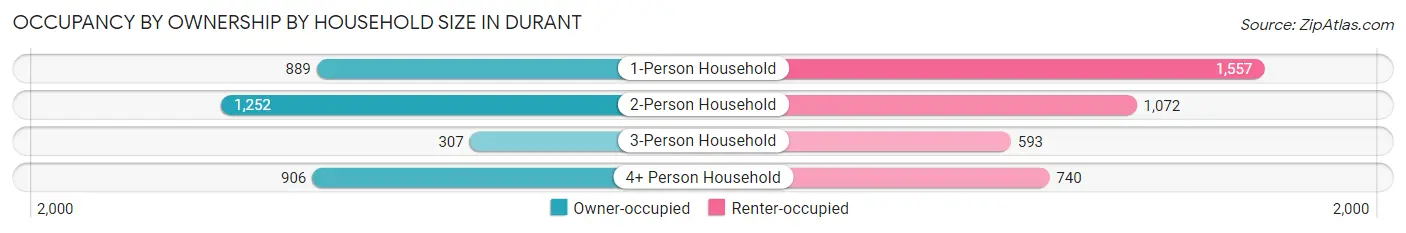
| Household Size | Owner-occupied | Renter-occupied |
| 1-Person Household | 889 (36.3%) | 1,557 (63.6%) |
| 2-Person Household | 1,252 (53.9%) | 1,072 (46.1%) |
| 3-Person Household | 307 (34.1%) | 593 (65.9%) |
| 4+ Person Household | 906 (55.0%) | 740 (45.0%) |
| Total Housing Units | 3,354 (45.8%) | 3,962 (54.2%) |
Occupancy by Educational Attainment in Durant
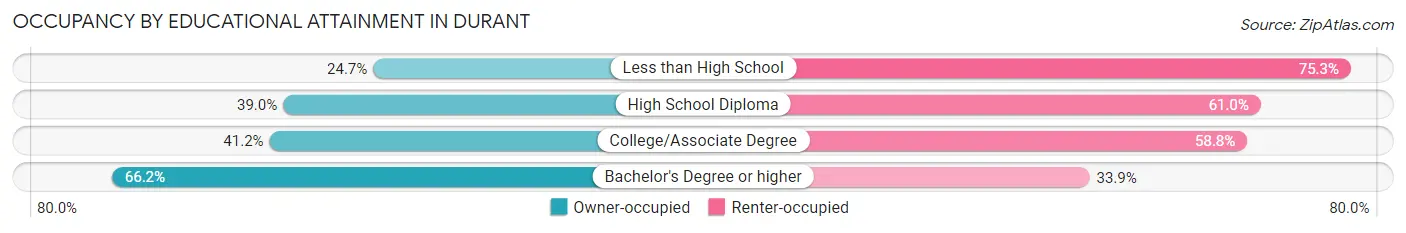
| Household Size | Owner-occupied | Renter-occupied |
| Less than High School | 198 (24.7%) | 603 (75.3%) |
| High School Diploma | 786 (39.0%) | 1,229 (61.0%) |
| College/Associate Degree | 1,000 (41.2%) | 1,429 (58.8%) |
| Bachelor's Degree or higher | 1,370 (66.1%) | 701 (33.9%) |
Occupancy by Age of Householder in Durant
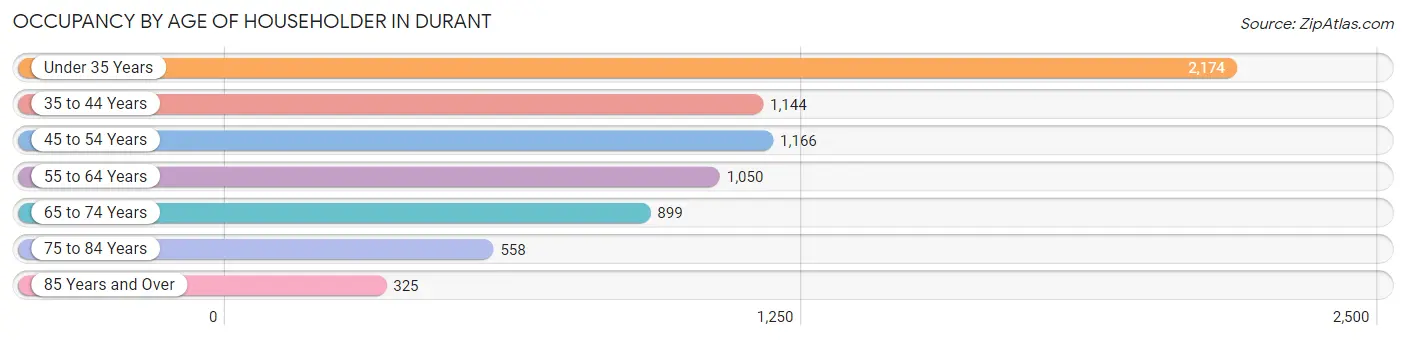
| Age Bracket | # Households | % Households |
| Under 35 Years | 2,174 | 29.7% |
| 35 to 44 Years | 1,144 | 15.6% |
| 45 to 54 Years | 1,166 | 15.9% |
| 55 to 64 Years | 1,050 | 14.3% |
| 65 to 74 Years | 899 | 12.3% |
| 75 to 84 Years | 558 | 7.6% |
| 85 Years and Over | 325 | 4.4% |
| Total | 7,316 | 100.0% |
Housing Finances in Durant
Median Income by Occupancy in Durant
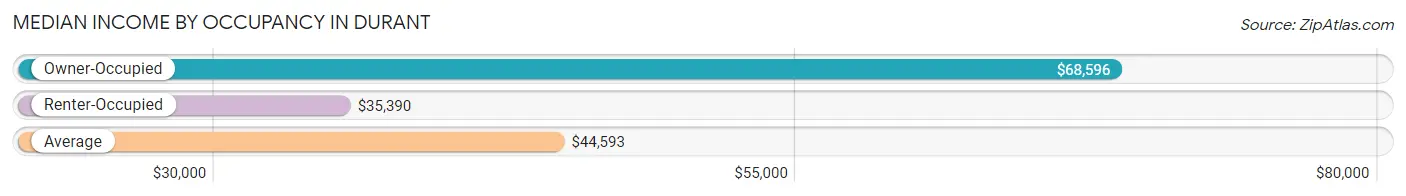
| Occupancy Type | # Households | Median Income |
| Owner-Occupied | 3,354 (45.8%) | $68,596 |
| Renter-Occupied | 3,962 (54.2%) | $35,390 |
| Average | 7,316 (100.0%) | $44,593 |
Occupancy by Householder Income Bracket in Durant
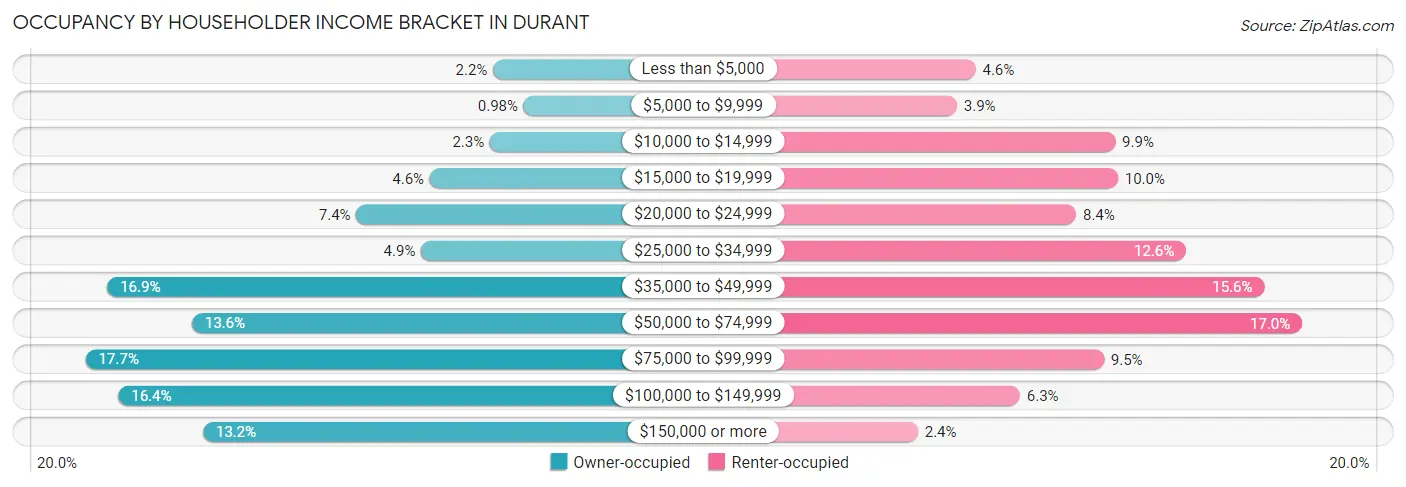
| Income Bracket | Owner-occupied | Renter-occupied |
| Less than $5,000 | 72 (2.1%) | 181 (4.6%) |
| $5,000 to $9,999 | 33 (1.0%) | 153 (3.9%) |
| $10,000 to $14,999 | 76 (2.3%) | 392 (9.9%) |
| $15,000 to $19,999 | 153 (4.6%) | 396 (10.0%) |
| $20,000 to $24,999 | 247 (7.4%) | 333 (8.4%) |
| $25,000 to $34,999 | 164 (4.9%) | 499 (12.6%) |
| $35,000 to $49,999 | 565 (16.9%) | 617 (15.6%) |
| $50,000 to $74,999 | 457 (13.6%) | 674 (17.0%) |
| $75,000 to $99,999 | 593 (17.7%) | 375 (9.5%) |
| $100,000 to $149,999 | 551 (16.4%) | 248 (6.3%) |
| $150,000 or more | 443 (13.2%) | 94 (2.4%) |
| Total | 3,354 (100.0%) | 3,962 (100.0%) |
Monthly Housing Cost Tiers in Durant
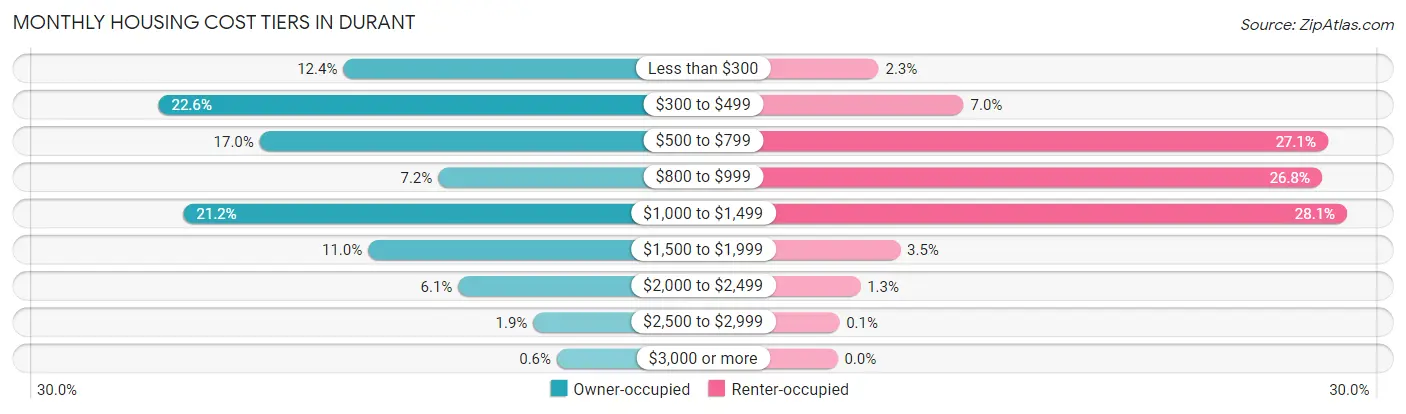
| Monthly Cost | Owner-occupied | Renter-occupied |
| Less than $300 | 416 (12.4%) | 90 (2.3%) |
| $300 to $499 | 758 (22.6%) | 276 (7.0%) |
| $500 to $799 | 571 (17.0%) | 1,073 (27.1%) |
| $800 to $999 | 240 (7.2%) | 1,060 (26.8%) |
| $1,000 to $1,499 | 712 (21.2%) | 1,115 (28.1%) |
| $1,500 to $1,999 | 370 (11.0%) | 137 (3.5%) |
| $2,000 to $2,499 | 203 (6.0%) | 50 (1.3%) |
| $2,500 to $2,999 | 64 (1.9%) | 4 (0.1%) |
| $3,000 or more | 20 (0.6%) | 0 (0.0%) |
| Total | 3,354 (100.0%) | 3,962 (100.0%) |
Physical Housing Characteristics in Durant
Housing Structures in Durant
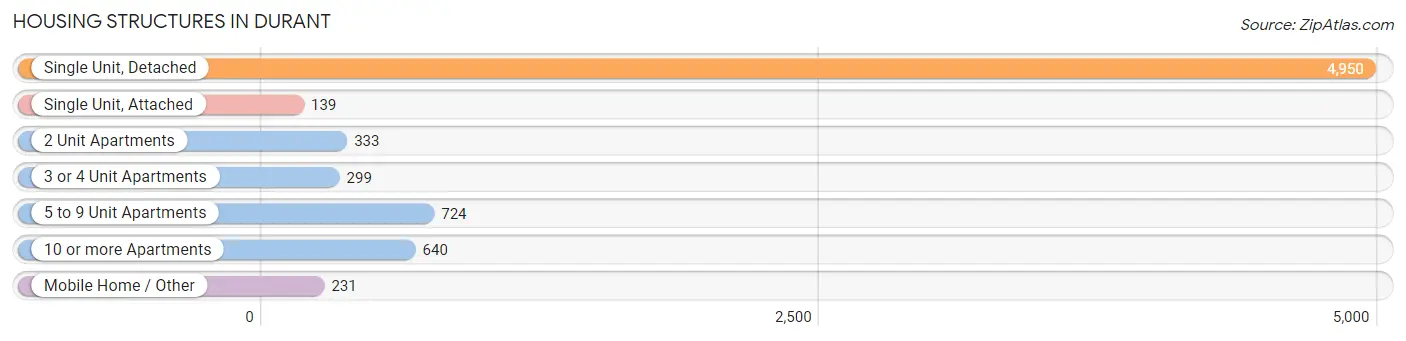
| Structure Type | # Housing Units | % Housing Units |
| Single Unit, Detached | 4,950 | 67.7% |
| Single Unit, Attached | 139 | 1.9% |
| 2 Unit Apartments | 333 | 4.5% |
| 3 or 4 Unit Apartments | 299 | 4.1% |
| 5 to 9 Unit Apartments | 724 | 9.9% |
| 10 or more Apartments | 640 | 8.7% |
| Mobile Home / Other | 231 | 3.2% |
| Total | 7,316 | 100.0% |
Housing Structures by Occupancy in Durant
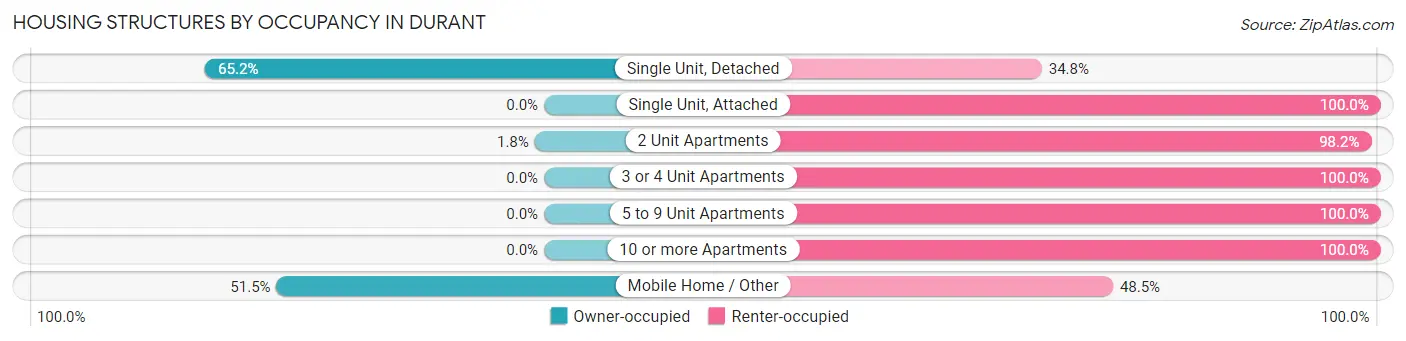
| Structure Type | Owner-occupied | Renter-occupied |
| Single Unit, Detached | 3,229 (65.2%) | 1,721 (34.8%) |
| Single Unit, Attached | 0 (0.0%) | 139 (100.0%) |
| 2 Unit Apartments | 6 (1.8%) | 327 (98.2%) |
| 3 or 4 Unit Apartments | 0 (0.0%) | 299 (100.0%) |
| 5 to 9 Unit Apartments | 0 (0.0%) | 724 (100.0%) |
| 10 or more Apartments | 0 (0.0%) | 640 (100.0%) |
| Mobile Home / Other | 119 (51.5%) | 112 (48.5%) |
| Total | 3,354 (45.8%) | 3,962 (54.2%) |
Housing Structures by Number of Rooms in Durant
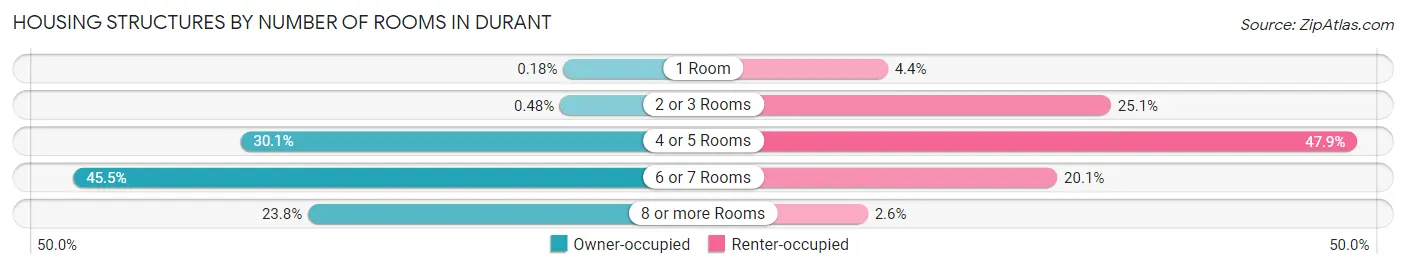
| Number of Rooms | Owner-occupied | Renter-occupied |
| 1 Room | 6 (0.2%) | 175 (4.4%) |
| 2 or 3 Rooms | 16 (0.5%) | 993 (25.1%) |
| 4 or 5 Rooms | 1,008 (30.0%) | 1,896 (47.8%) |
| 6 or 7 Rooms | 1,526 (45.5%) | 796 (20.1%) |
| 8 or more Rooms | 798 (23.8%) | 102 (2.6%) |
| Total | 3,354 (100.0%) | 3,962 (100.0%) |
Housing Structure by Heating Type in Durant
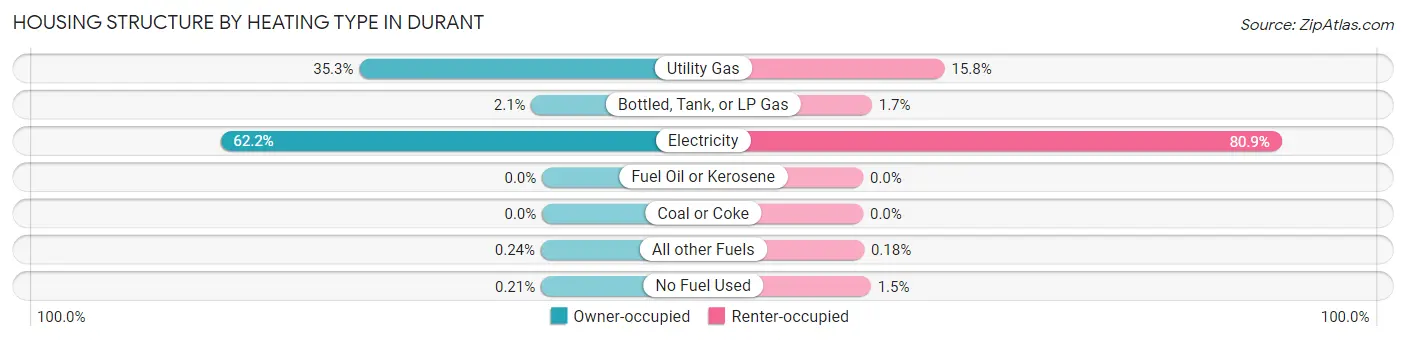
| Heating Type | Owner-occupied | Renter-occupied |
| Utility Gas | 1,185 (35.3%) | 624 (15.8%) |
| Bottled, Tank, or LP Gas | 69 (2.1%) | 67 (1.7%) |
| Electricity | 2,085 (62.2%) | 3,205 (80.9%) |
| Fuel Oil or Kerosene | 0 (0.0%) | 0 (0.0%) |
| Coal or Coke | 0 (0.0%) | 0 (0.0%) |
| All other Fuels | 8 (0.2%) | 7 (0.2%) |
| No Fuel Used | 7 (0.2%) | 59 (1.5%) |
| Total | 3,354 (100.0%) | 3,962 (100.0%) |
Household Vehicle Usage in Durant
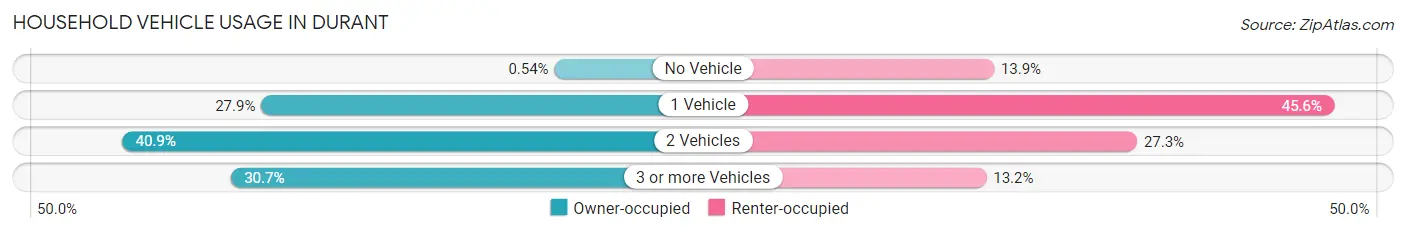
| Vehicles per Household | Owner-occupied | Renter-occupied |
| No Vehicle | 18 (0.5%) | 551 (13.9%) |
| 1 Vehicle | 936 (27.9%) | 1,808 (45.6%) |
| 2 Vehicles | 1,370 (40.8%) | 1,080 (27.3%) |
| 3 or more Vehicles | 1,030 (30.7%) | 523 (13.2%) |
| Total | 3,354 (100.0%) | 3,962 (100.0%) |
Real Estate & Mortgages in Durant
Real Estate and Mortgage Overview in Durant
| Characteristic | Without Mortgage | With Mortgage |
| Housing Units | 1,658 | 1,696 |
| Median Property Value | $124,200 | $181,500 |
| Median Household Income | $44,024 | $294 |
| Monthly Housing Costs | $394 | $20 |
| Real Estate Taxes | $752 | $25 |
Property Value by Mortgage Status in Durant
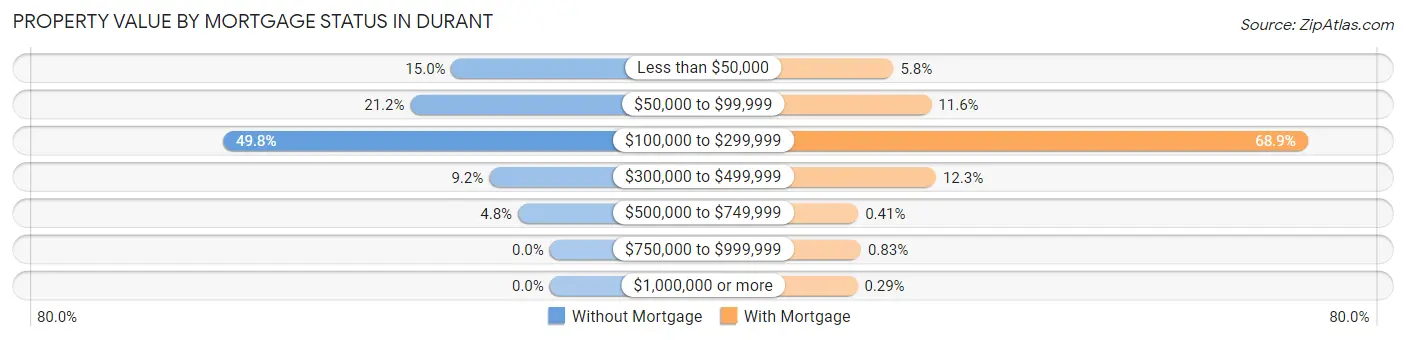
| Property Value | Without Mortgage | With Mortgage |
| Less than $50,000 | 248 (15.0%) | 98 (5.8%) |
| $50,000 to $99,999 | 352 (21.2%) | 196 (11.6%) |
| $100,000 to $299,999 | 825 (49.8%) | 1,168 (68.9%) |
| $300,000 to $499,999 | 153 (9.2%) | 208 (12.3%) |
| $500,000 to $749,999 | 80 (4.8%) | 7 (0.4%) |
| $750,000 to $999,999 | 0 (0.0%) | 14 (0.8%) |
| $1,000,000 or more | 0 (0.0%) | 5 (0.3%) |
| Total | 1,658 (100.0%) | 1,696 (100.0%) |
Household Income by Mortgage Status in Durant
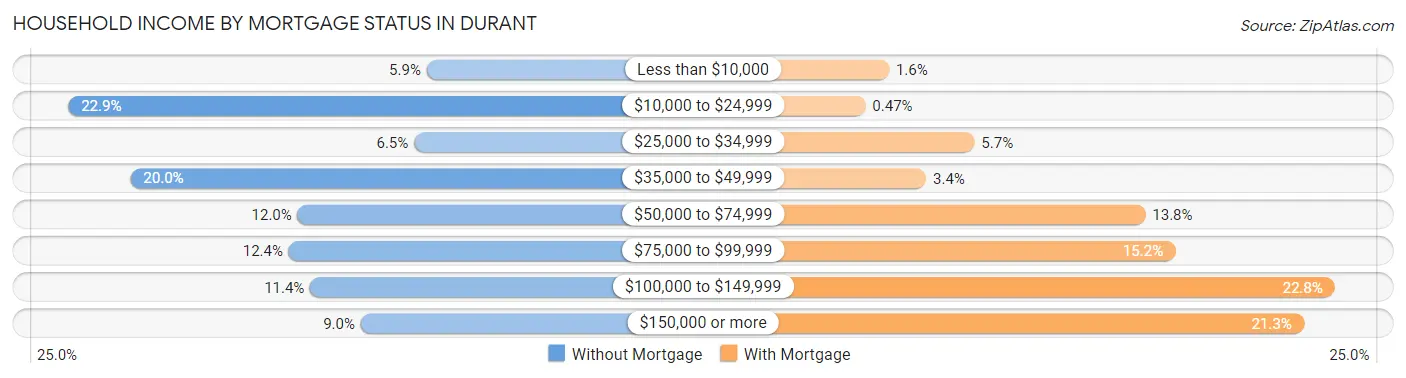
| Household Income | Without Mortgage | With Mortgage |
| Less than $10,000 | 97 (5.9%) | 27 (1.6%) |
| $10,000 to $24,999 | 380 (22.9%) | 8 (0.5%) |
| $25,000 to $34,999 | 107 (6.5%) | 96 (5.7%) |
| $35,000 to $49,999 | 331 (20.0%) | 57 (3.4%) |
| $50,000 to $74,999 | 199 (12.0%) | 234 (13.8%) |
| $75,000 to $99,999 | 206 (12.4%) | 258 (15.2%) |
| $100,000 to $149,999 | 189 (11.4%) | 387 (22.8%) |
| $150,000 or more | 149 (9.0%) | 362 (21.3%) |
| Total | 1,658 (100.0%) | 1,696 (100.0%) |
Property Value to Household Income Ratio in Durant
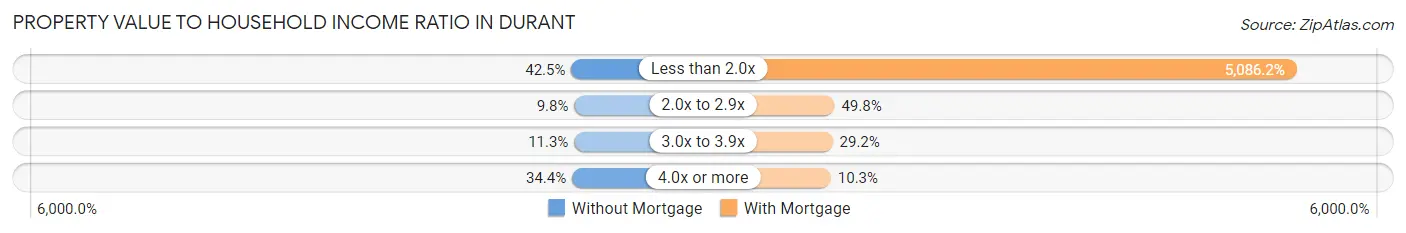
| Value-to-Income Ratio | Without Mortgage | With Mortgage |
| Less than 2.0x | 705 (42.5%) | 86,262 (5,086.2%) |
| 2.0x to 2.9x | 163 (9.8%) | 844 (49.8%) |
| 3.0x to 3.9x | 187 (11.3%) | 495 (29.2%) |
| 4.0x or more | 570 (34.4%) | 175 (10.3%) |
| Total | 1,658 (100.0%) | 1,696 (100.0%) |
Real Estate Taxes by Mortgage Status in Durant
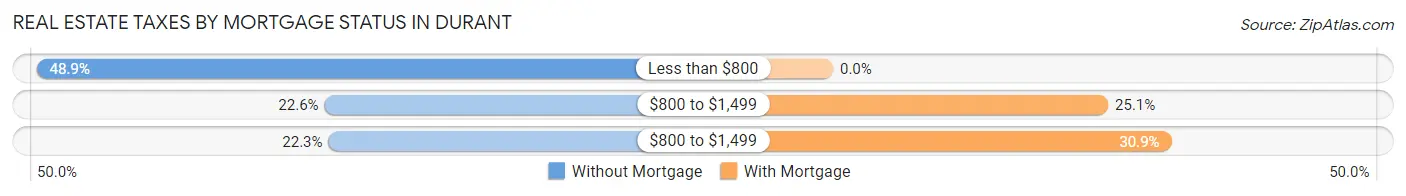
| Property Taxes | Without Mortgage | With Mortgage |
| Less than $800 | 811 (48.9%) | 0 (0.0%) |
| $800 to $1,499 | 375 (22.6%) | 426 (25.1%) |
| $800 to $1,499 | 369 (22.3%) | 524 (30.9%) |
| Total | 1,658 (100.0%) | 1,696 (100.0%) |
Health & Disability in Durant
Health Insurance Coverage by Age in Durant
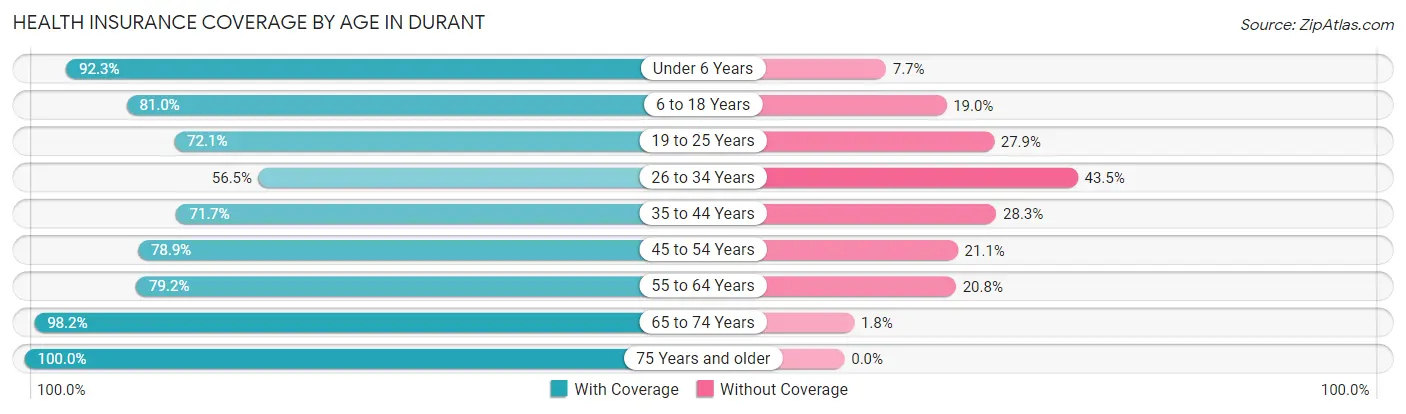
| Age Bracket | With Coverage | Without Coverage |
| Under 6 Years | 1,084 (92.3%) | 91 (7.7%) |
| 6 to 18 Years | 2,758 (81.0%) | 647 (19.0%) |
| 19 to 25 Years | 1,731 (72.1%) | 669 (27.9%) |
| 26 to 34 Years | 1,464 (56.5%) | 1,127 (43.5%) |
| 35 to 44 Years | 1,628 (71.7%) | 643 (28.3%) |
| 45 to 54 Years | 1,567 (78.9%) | 420 (21.1%) |
| 55 to 64 Years | 1,338 (79.2%) | 351 (20.8%) |
| 65 to 74 Years | 1,526 (98.2%) | 28 (1.8%) |
| 75 Years and older | 1,227 (100.0%) | 0 (0.0%) |
| Total | 14,323 (78.3%) | 3,976 (21.7%) |
Health Insurance Coverage by Citizenship Status in Durant
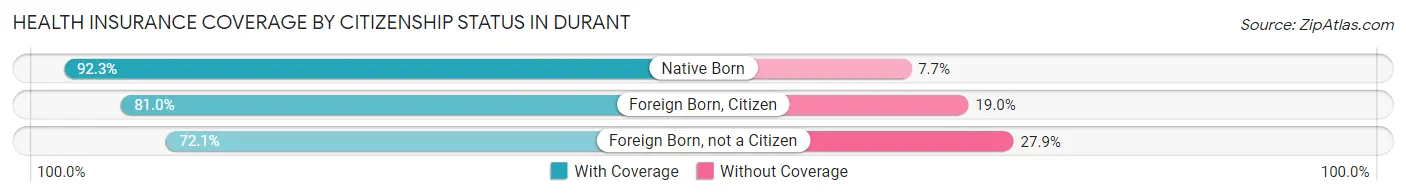
| Citizenship Status | With Coverage | Without Coverage |
| Native Born | 1,084 (92.3%) | 91 (7.7%) |
| Foreign Born, Citizen | 2,758 (81.0%) | 647 (19.0%) |
| Foreign Born, not a Citizen | 1,731 (72.1%) | 669 (27.9%) |
Health Insurance Coverage by Household Income in Durant
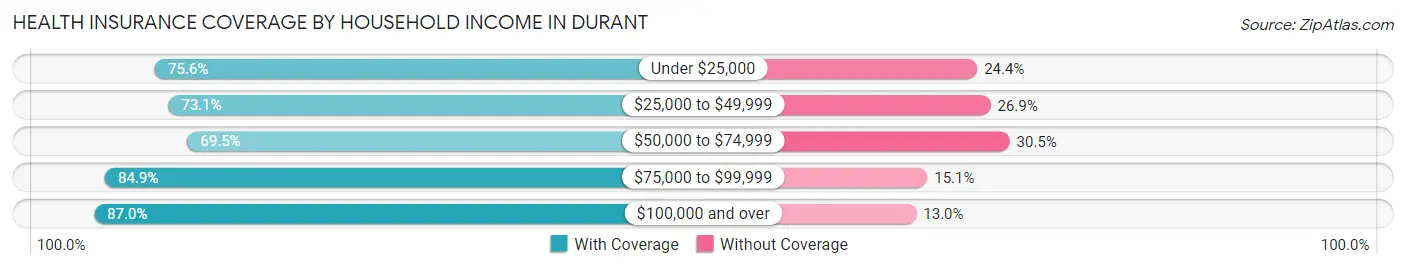
| Household Income | With Coverage | Without Coverage |
| Under $25,000 | 2,546 (75.6%) | 823 (24.4%) |
| $25,000 to $49,999 | 3,126 (73.1%) | 1,152 (26.9%) |
| $50,000 to $74,999 | 2,177 (69.5%) | 956 (30.5%) |
| $75,000 to $99,999 | 2,444 (84.9%) | 434 (15.1%) |
| $100,000 and over | 3,665 (87.0%) | 549 (13.0%) |
Public vs Private Health Insurance Coverage by Age in Durant
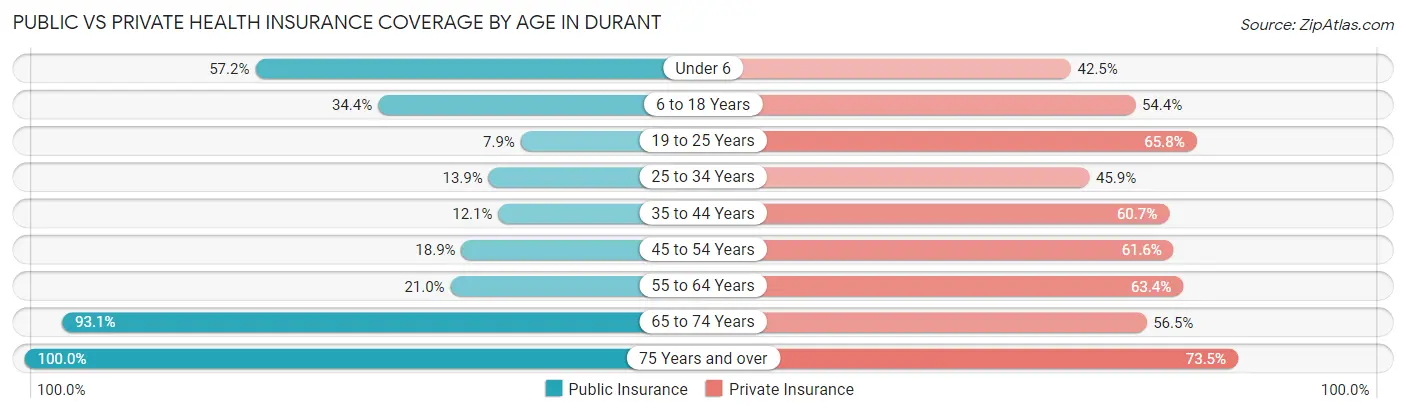
| Age Bracket | Public Insurance | Private Insurance |
| Under 6 | 672 (57.2%) | 499 (42.5%) |
| 6 to 18 Years | 1,171 (34.4%) | 1,853 (54.4%) |
| 19 to 25 Years | 190 (7.9%) | 1,580 (65.8%) |
| 25 to 34 Years | 360 (13.9%) | 1,189 (45.9%) |
| 35 to 44 Years | 274 (12.1%) | 1,379 (60.7%) |
| 45 to 54 Years | 376 (18.9%) | 1,224 (61.6%) |
| 55 to 64 Years | 354 (21.0%) | 1,070 (63.3%) |
| 65 to 74 Years | 1,446 (93.0%) | 878 (56.5%) |
| 75 Years and over | 1,227 (100.0%) | 902 (73.5%) |
| Total | 6,070 (33.2%) | 10,574 (57.8%) |
Disability Status by Sex by Age in Durant
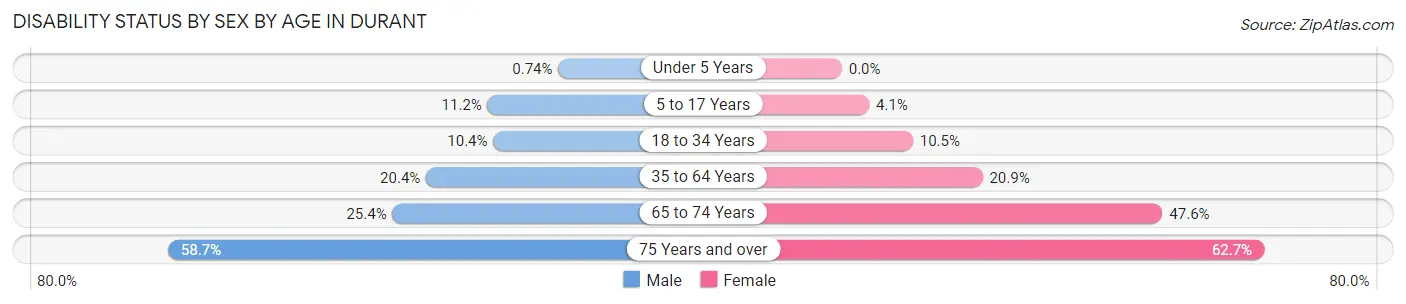
| Age Bracket | Male | Female |
| Under 5 Years | 4 (0.7%) | 0 (0.0%) |
| 5 to 17 Years | 171 (11.2%) | 71 (4.1%) |
| 18 to 34 Years | 294 (10.4%) | 264 (10.5%) |
| 35 to 64 Years | 598 (20.4%) | 629 (20.9%) |
| 65 to 74 Years | 155 (25.4%) | 449 (47.6%) |
| 75 Years and over | 239 (58.7%) | 514 (62.7%) |
Disability Class by Sex by Age in Durant
Disability Class: Hearing Difficulty
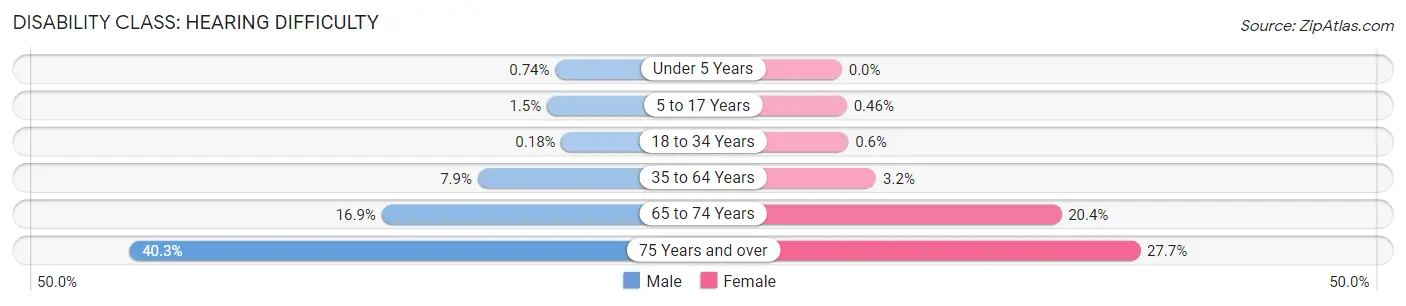
| Age Bracket | Male | Female |
| Under 5 Years | 4 (0.7%) | 0 (0.0%) |
| 5 to 17 Years | 23 (1.5%) | 8 (0.5%) |
| 18 to 34 Years | 5 (0.2%) | 15 (0.6%) |
| 35 to 64 Years | 233 (7.9%) | 96 (3.2%) |
| 65 to 74 Years | 103 (16.9%) | 192 (20.4%) |
| 75 Years and over | 164 (40.3%) | 227 (27.7%) |
Disability Class: Vision Difficulty
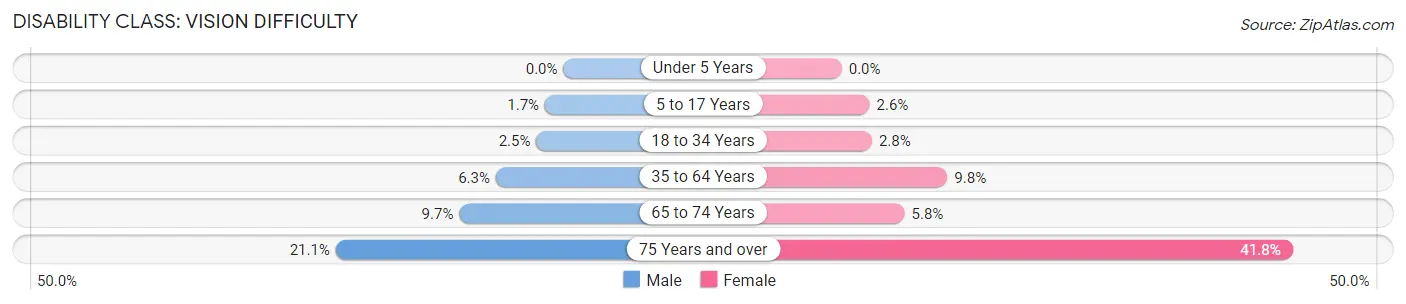
| Age Bracket | Male | Female |
| Under 5 Years | 0 (0.0%) | 0 (0.0%) |
| 5 to 17 Years | 26 (1.7%) | 45 (2.6%) |
| 18 to 34 Years | 71 (2.5%) | 70 (2.8%) |
| 35 to 64 Years | 184 (6.3%) | 295 (9.8%) |
| 65 to 74 Years | 59 (9.7%) | 55 (5.8%) |
| 75 Years and over | 86 (21.1%) | 343 (41.8%) |
Disability Class: Cognitive Difficulty
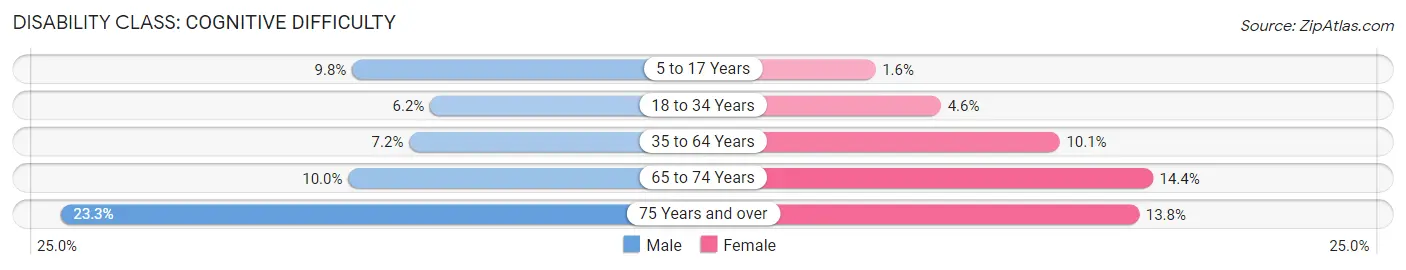
| Age Bracket | Male | Female |
| 5 to 17 Years | 149 (9.8%) | 27 (1.5%) |
| 18 to 34 Years | 175 (6.2%) | 115 (4.6%) |
| 35 to 64 Years | 210 (7.1%) | 304 (10.1%) |
| 65 to 74 Years | 61 (10.0%) | 136 (14.4%) |
| 75 Years and over | 95 (23.3%) | 113 (13.8%) |
Disability Class: Ambulatory Difficulty
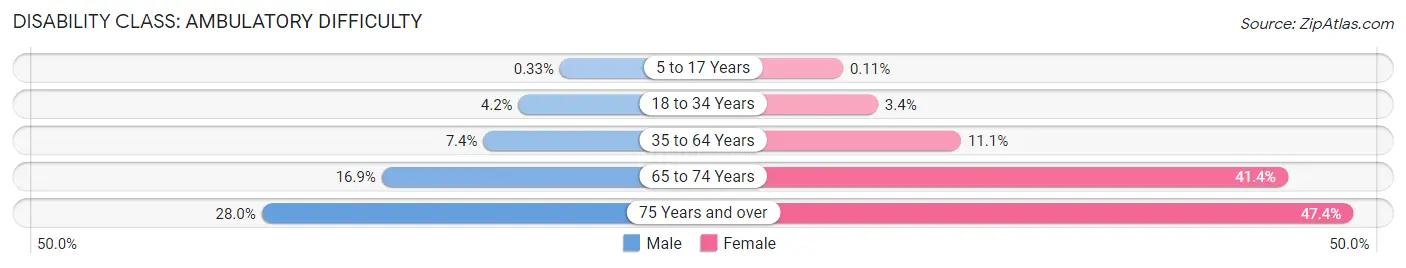
| Age Bracket | Male | Female |
| 5 to 17 Years | 5 (0.3%) | 2 (0.1%) |
| 18 to 34 Years | 118 (4.2%) | 84 (3.4%) |
| 35 to 64 Years | 218 (7.4%) | 333 (11.1%) |
| 65 to 74 Years | 103 (16.9%) | 390 (41.4%) |
| 75 Years and over | 114 (28.0%) | 389 (47.4%) |
Disability Class: Self-Care Difficulty
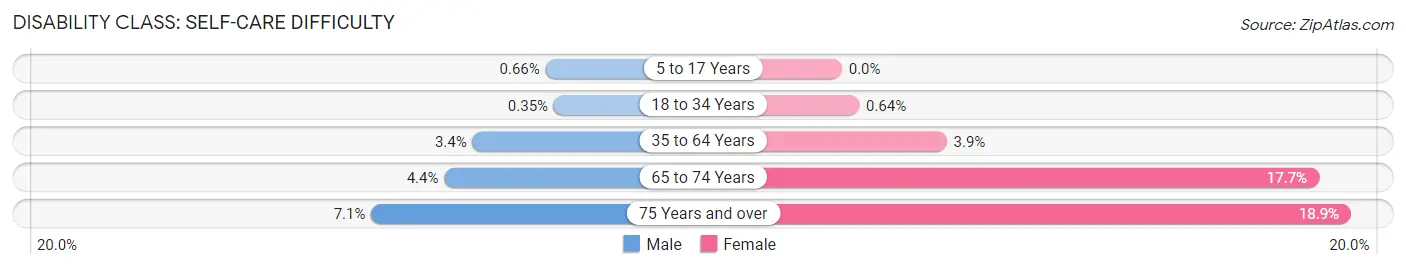
| Age Bracket | Male | Female |
| 5 to 17 Years | 10 (0.7%) | 0 (0.0%) |
| 18 to 34 Years | 10 (0.4%) | 16 (0.6%) |
| 35 to 64 Years | 99 (3.4%) | 117 (3.9%) |
| 65 to 74 Years | 27 (4.4%) | 167 (17.7%) |
| 75 Years and over | 29 (7.1%) | 155 (18.9%) |
Technology Access in Durant
Computing Device Access in Durant
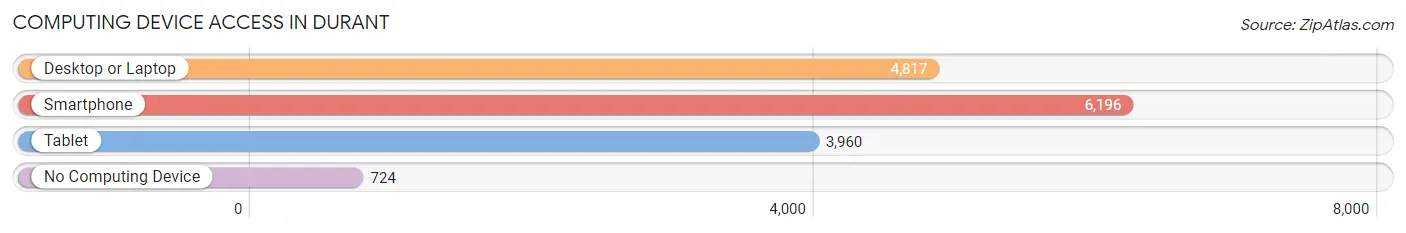
| Device Type | # Households | % Households |
| Desktop or Laptop | 4,817 | 65.8% |
| Smartphone | 6,196 | 84.7% |
| Tablet | 3,960 | 54.1% |
| No Computing Device | 724 | 9.9% |
| Total | 7,316 | 100.0% |
Internet Access in Durant
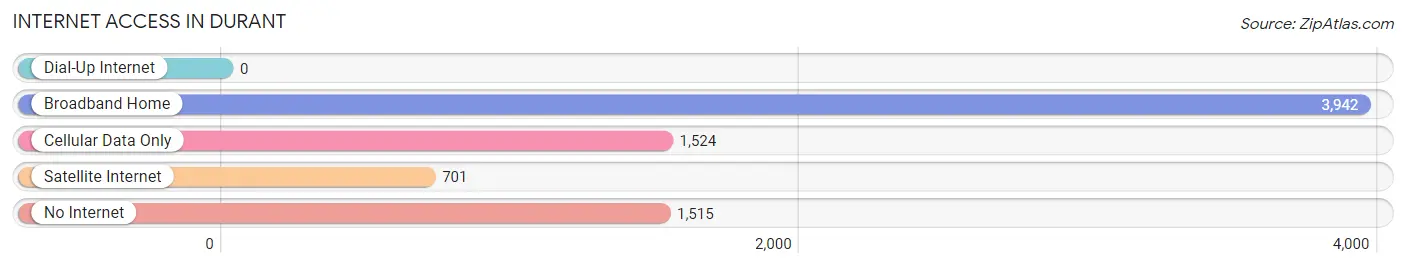
| Internet Type | # Households | % Households |
| Dial-Up Internet | 0 | 0.0% |
| Broadband Home | 3,942 | 53.9% |
| Cellular Data Only | 1,524 | 20.8% |
| Satellite Internet | 701 | 9.6% |
| No Internet | 1,515 | 20.7% |
| Total | 7,316 | 100.0% |
Durant Summary
Durant, Oklahoma is a city located in Bryan County, Oklahoma. It is the county seat of Bryan County and is the largest city in the county. The city is located in the southeastern part of the state, about 100 miles north of Dallas, Texas. As of the 2010 census, the population of Durant was 15,856.
History
Durant was founded in 1872 by William Durant, a railroad contractor. The city was named after him. The city was incorporated in 1901 and was the first city in Bryan County. The city was a major stop on the Missouri, Oklahoma and Gulf Railway. The city was also a major stop on the St. Louis-San Francisco Railway.
In the early 1900s, Durant was a major center for cotton production and processing. The city was also a major center for the timber industry. The city was also home to several large manufacturing plants, including a cotton mill, a lumber mill, and a brick plant.
Geography
Durant is located in southeastern Oklahoma, about 100 miles north of Dallas, Texas. The city is situated in the Red River Valley, which is part of the Great Plains region. The city is located at the intersection of U.S. Highway 69 and U.S. Highway 70. The city is surrounded by several small towns and rural areas.
The climate in Durant is humid subtropical, with hot summers and mild winters. The average annual temperature is around 64°F. The average annual precipitation is around 40 inches.
Economy
Durant’s economy is largely based on agriculture, manufacturing, and tourism. The city is home to several large manufacturing plants, including a cotton mill, a lumber mill, and a brick plant. The city is also home to several large retail stores, including Walmart, Lowe’s, and Home Depot.
The city is also home to several large tourist attractions, including the Choctaw Casino Resort, the Three Valley Museum, and the Fort Washita Historic Site. The city is also home to several large festivals, including the Red River Valley Fair and the Choctaw Nation Pow Wow.
Demographics
As of the 2010 census, the population of Durant was 15,856. The racial makeup of the city was 75.3% White, 15.2% African American, 0.7% Native American, 0.7% Asian, 0.1% Pacific Islander, and 6.9% from other races. The median household income was $35,945. The per capita income was $19,945.
Conclusion
Durant, Oklahoma is a city located in Bryan County, Oklahoma. It is the county seat of Bryan County and is the largest city in the county. The city is located in the southeastern part of the state, about 100 miles north of Dallas, Texas. As of the 2010 census, the population of Durant was 15,856. The city’s economy is largely based on agriculture, manufacturing, and tourism. The city is home to several large tourist attractions, including the Choctaw Casino Resort, the Three Valley Museum, and the Fort Washita Historic Site. The racial makeup of the city was 75.3% White, 15.2% African American, 0.7% Native American, 0.7% Asian, 0.1% Pacific Islander, and 6.9% from other races. The median household income was $35,945. The per capita income was $19,945.
Common Questions
What is Per Capita Income in Durant?
Per Capita income in Durant is $28,129.
What is the Median Family Income in Durant?
Median Family Income in Durant is $58,837.
What is the Median Household income in Durant?
Median Household Income in Durant is $44,593.
What is Income or Wage Gap in Durant?
Income or Wage Gap in Durant is 17.8%.
Women in Durant earn 82.2 cents for every dollar earned by a man.
What is Family Income Deficit in Durant?
Family Income Deficit in Durant is $9,242.
Families that are below poverty line in Durant earn $9,242 less on average than the poverty threshold level.
What is Inequality or Gini Index in Durant?
Inequality or Gini Index in Durant is 0.48.
What is the Total Population of Durant?
Total Population of Durant is 18,759.
What is the Total Male Population of Durant?
Total Male Population of Durant is 9,133.
What is the Total Female Population of Durant?
Total Female Population of Durant is 9,626.
What is the Ratio of Males per 100 Females in Durant?
There are 94.88 Males per 100 Females in Durant.
What is the Ratio of Females per 100 Males in Durant?
There are 105.40 Females per 100 Males in Durant.
What is the Median Population Age in Durant?
Median Population Age in Durant is 34.0 Years.
What is the Average Family Size in Durant
Average Family Size in Durant is 3.0 People.
What is the Average Household Size in Durant
Average Household Size in Durant is 2.5 People.
How Large is the Labor Force in Durant?
There are 9,087 People in the Labor Forcein in Durant.
What is the Percentage of People in the Labor Force in Durant?
60.7% of People are in the Labor Force in Durant.
What is the Unemployment Rate in Durant?
Unemployment Rate in Durant is 5.5%.