Owasso, OK Map & Demographics
Owasso Map
Owasso Overview
$35,275
PER CAPITA INCOME
$95,998
AVG FAMILY INCOME
$79,183
AVG HOUSEHOLD INCOME
32.2%
WAGE / INCOME GAP [ % ]
67.8¢/ $1
WAGE / INCOME GAP [ $ ]
$8,487
FAMILY INCOME DEFICIT
0.38
INEQUALITY / GINI INDEX
38,134
TOTAL POPULATION
19,212
MALE POPULATION
18,922
FEMALE POPULATION
101.53
MALES / 100 FEMALES
98.49
FEMALES / 100 MALES
33.5
MEDIAN AGE
3.2
AVG FAMILY SIZE
2.7
AVG HOUSEHOLD SIZE
20,325
LABOR FORCE [ PEOPLE ]
70.1%
PERCENT IN LABOR FORCE
4.6%
UNEMPLOYMENT RATE
Owasso Zip Codes
Owasso Area Codes
Income in Owasso
Income Overview in Owasso
Per Capita Income in Owasso is $35,275, while median incomes of families and households are $95,998 and $79,183 respectively.
| Characteristic | Number | Measure |
| Per Capita Income | 38,134 | $35,275 |
| Median Family Income | 9,714 | $95,998 |
| Mean Family Income | 9,714 | $107,505 |
| Median Household Income | 14,230 | $79,183 |
| Mean Household Income | 14,230 | $92,421 |
| Income Deficit | 9,714 | $8,487 |
| Wage / Income Gap (%) | 38,134 | 32.16% |
| Wage / Income Gap ($) | 38,134 | 67.84¢ per $1 |
| Gini / Inequality Index | 38,134 | 0.38 |
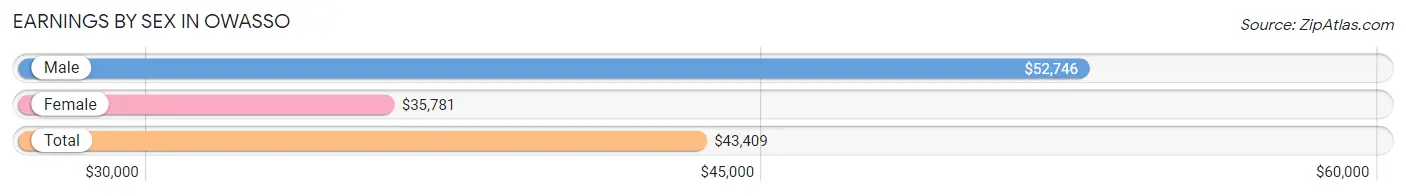
Earnings by Sex in Owasso
Average Earnings in Owasso are $43,409, $52,746 for men and $35,781 for women, a difference of 32.2%.
| Sex | Number | Average Earnings |
| Male | 11,258 (53.6%) | $52,746 |
| Female | 9,738 (46.4%) | $35,781 |
| Total | 20,996 (100.0%) | $43,409 |
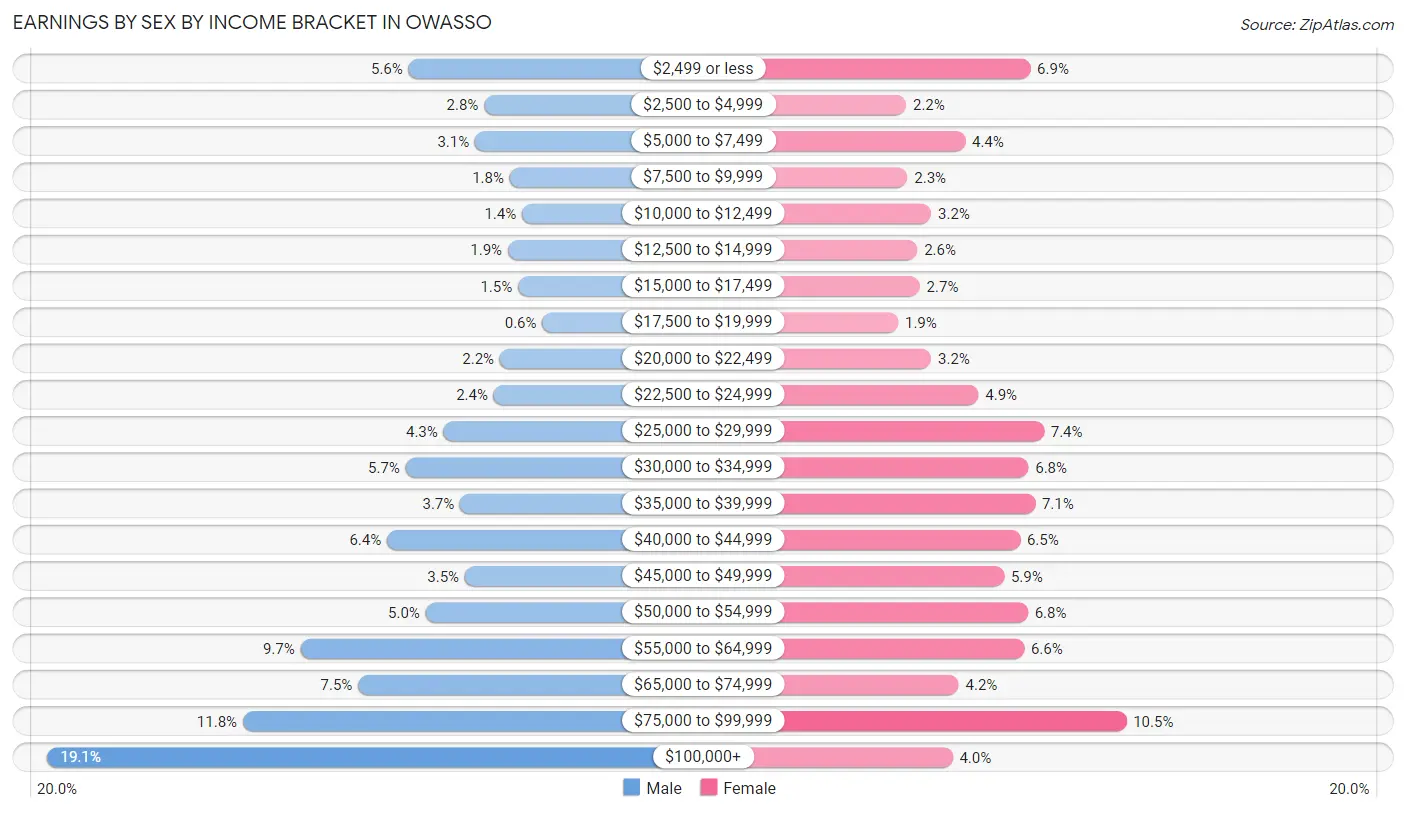
Earnings by Sex by Income Bracket in Owasso
The most common earnings brackets in Owasso are $100,000+ for men (2,155 | 19.1%) and $75,000 to $99,999 for women (1,020 | 10.5%).
| Income | Male | Female |
| $2,499 or less | 632 (5.6%) | 669 (6.9%) |
| $2,500 to $4,999 | 313 (2.8%) | 216 (2.2%) |
| $5,000 to $7,499 | 351 (3.1%) | 431 (4.4%) |
| $7,500 to $9,999 | 205 (1.8%) | 221 (2.3%) |
| $10,000 to $12,499 | 153 (1.4%) | 308 (3.2%) |
| $12,500 to $14,999 | 213 (1.9%) | 257 (2.6%) |
| $15,000 to $17,499 | 170 (1.5%) | 266 (2.7%) |
| $17,500 to $19,999 | 67 (0.6%) | 187 (1.9%) |
| $20,000 to $22,499 | 246 (2.2%) | 308 (3.2%) |
| $22,500 to $24,999 | 272 (2.4%) | 480 (4.9%) |
| $25,000 to $29,999 | 484 (4.3%) | 719 (7.4%) |
| $30,000 to $34,999 | 644 (5.7%) | 662 (6.8%) |
| $35,000 to $39,999 | 414 (3.7%) | 687 (7.0%) |
| $40,000 to $44,999 | 723 (6.4%) | 632 (6.5%) |
| $45,000 to $49,999 | 394 (3.5%) | 574 (5.9%) |
| $50,000 to $54,999 | 559 (5.0%) | 660 (6.8%) |
| $55,000 to $64,999 | 1,088 (9.7%) | 647 (6.6%) |
| $65,000 to $74,999 | 844 (7.5%) | 408 (4.2%) |
| $75,000 to $99,999 | 1,331 (11.8%) | 1,020 (10.5%) |
| $100,000+ | 2,155 (19.1%) | 386 (4.0%) |
| Total | 11,258 (100.0%) | 9,738 (100.0%) |
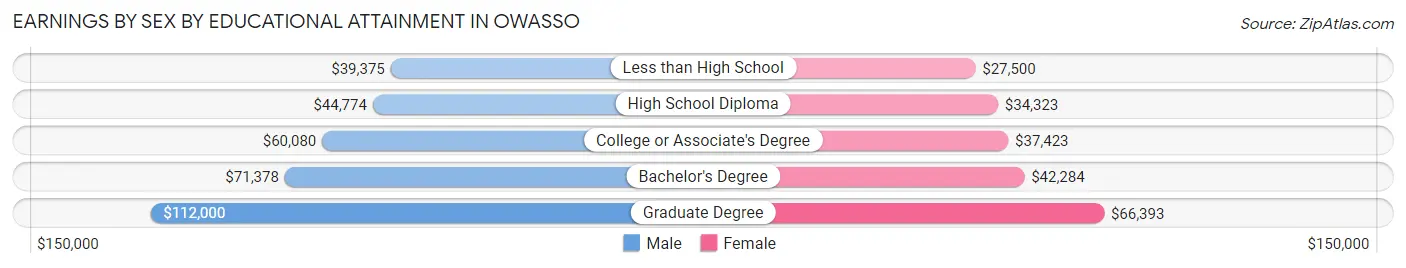
Earnings by Sex by Educational Attainment in Owasso
Average earnings in Owasso are $61,325 for men and $40,708 for women, a difference of 33.6%. Men with an educational attainment of graduate degree enjoy the highest average annual earnings of $112,000, while those with less than high school education earn the least with $39,375. Women with an educational attainment of graduate degree earn the most with the average annual earnings of $66,393, while those with less than high school education have the smallest earnings of $27,500.
| Educational Attainment | Male Income | Female Income |
| Less than High School | $39,375 | $27,500 |
| High School Diploma | $44,774 | $34,323 |
| College or Associate's Degree | $60,080 | $37,423 |
| Bachelor's Degree | $71,378 | $42,284 |
| Graduate Degree | $112,000 | $66,393 |
| Total | $61,325 | $40,708 |
Family Income in Owasso
Family Income Brackets in Owasso
According to the Owasso family income data, there are 2,545 families falling into the $100,000 to $149,999 income range, which is the most common income bracket and makes up 26.2% of all families. Conversely, the $10,000 to $14,999 income bracket is the least frequent group with only 107 families (1.1%) belonging to this category.
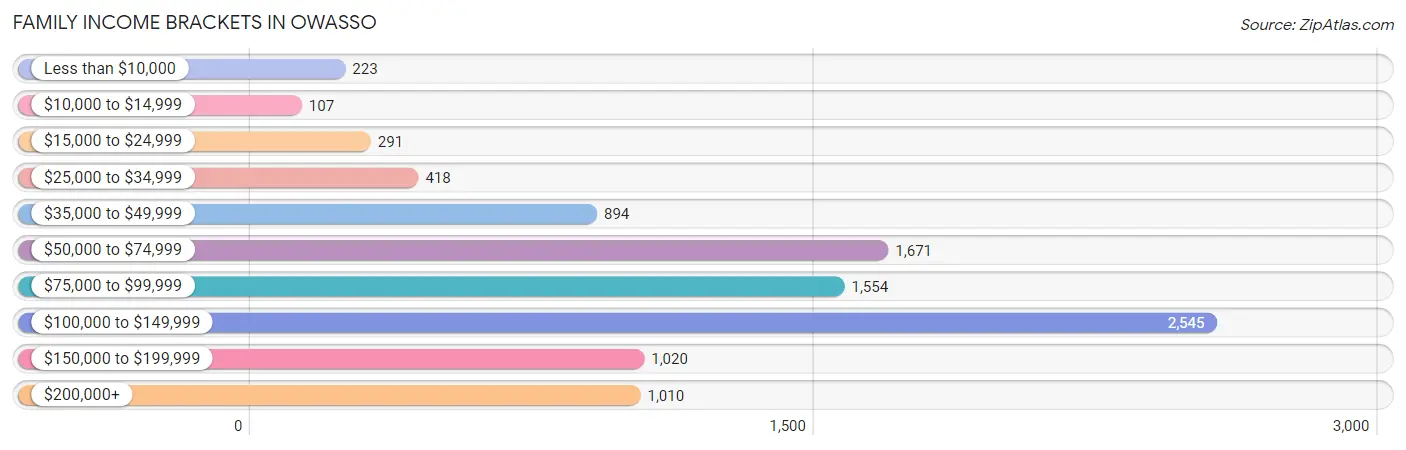
| Income Bracket | # Families | % Families |
| Less than $10,000 | 223 | 2.3% |
| $10,000 to $14,999 | 107 | 1.1% |
| $15,000 to $24,999 | 291 | 3.0% |
| $25,000 to $34,999 | 418 | 4.3% |
| $35,000 to $49,999 | 894 | 9.2% |
| $50,000 to $74,999 | 1,671 | 17.2% |
| $75,000 to $99,999 | 1,554 | 16.0% |
| $100,000 to $149,999 | 2,545 | 26.2% |
| $150,000 to $199,999 | 1,020 | 10.5% |
| $200,000+ | 1,010 | 10.4% |
Family Income by Famaliy Size in Owasso
7+ person families (250 | 2.6%) account for the highest median family income in Owasso with $118,036 per family, while 2-person families (4,034 | 41.5%) have the highest median income of $41,884 per family member.
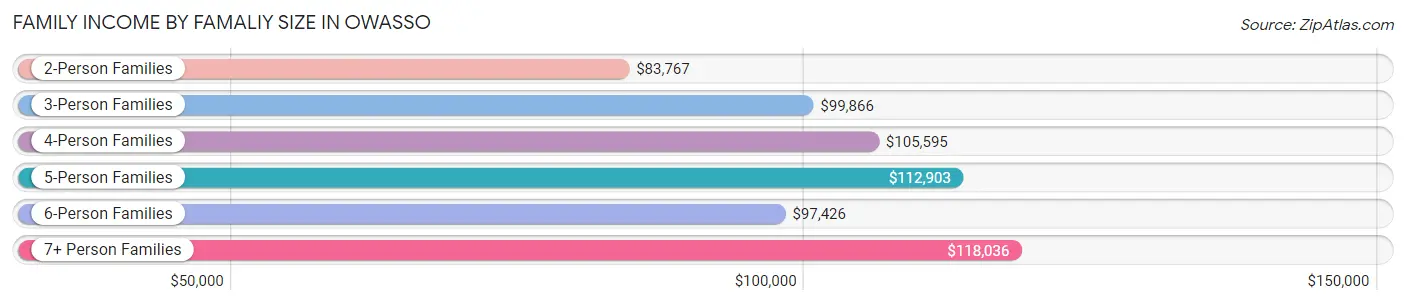
| Income Bracket | # Families | Median Income |
| 2-Person Families | 4,034 (41.5%) | $83,767 |
| 3-Person Families | 2,623 (27.0%) | $99,866 |
| 4-Person Families | 1,890 (19.5%) | $105,595 |
| 5-Person Families | 584 (6.0%) | $112,903 |
| 6-Person Families | 333 (3.4%) | $97,426 |
| 7+ Person Families | 250 (2.6%) | $118,036 |
| Total | 9,714 (100.0%) | $95,998 |
Family Income by Number of Earners in Owasso
The median family income in Owasso is $95,998, with families comprising 3+ earners (1,020) having the highest median family income of $139,911, while families with no earners (970) have the lowest median family income of $51,574, accounting for 10.5% and 10.0% of families, respectively.
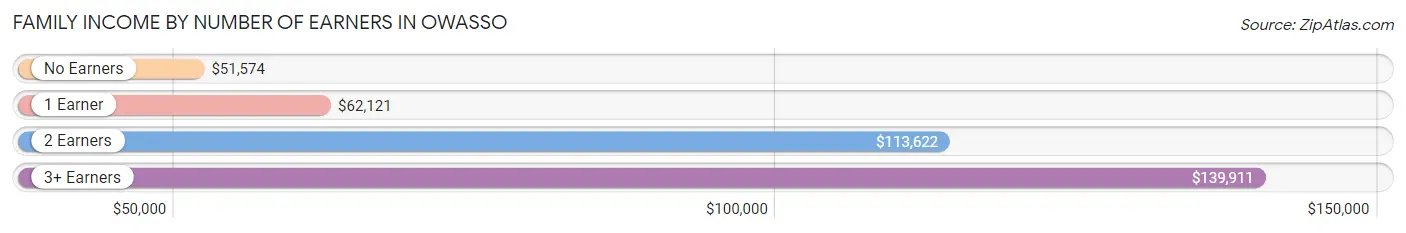
| Number of Earners | # Families | Median Income |
| No Earners | 970 (10.0%) | $51,574 |
| 1 Earner | 2,859 (29.4%) | $62,121 |
| 2 Earners | 4,865 (50.1%) | $113,622 |
| 3+ Earners | 1,020 (10.5%) | $139,911 |
| Total | 9,714 (100.0%) | $95,998 |
Household Income in Owasso
Household Income Brackets in Owasso
With 2,903 households falling in the category, the $100,000 to $149,999 income range is the most frequent in Owasso, accounting for 20.4% of all households. In contrast, only 242 households (1.7%) fall into the $10,000 to $14,999 income bracket, making it the least populous group.
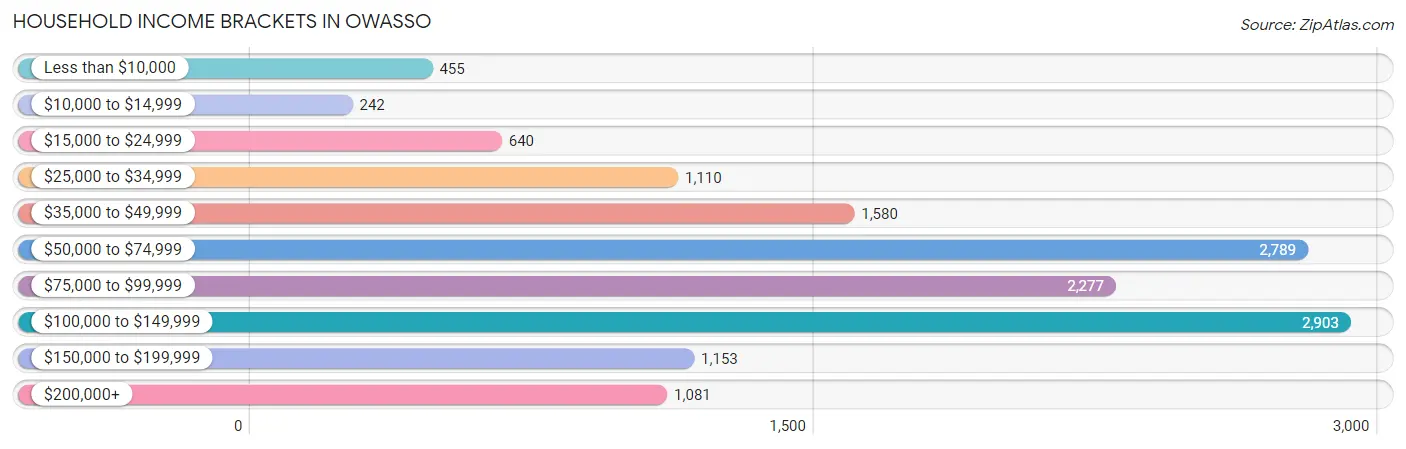
| Income Bracket | # Households | % Households |
| Less than $10,000 | 455 | 3.2% |
| $10,000 to $14,999 | 242 | 1.7% |
| $15,000 to $24,999 | 640 | 4.5% |
| $25,000 to $34,999 | 1,110 | 7.8% |
| $35,000 to $49,999 | 1,580 | 11.1% |
| $50,000 to $74,999 | 2,789 | 19.6% |
| $75,000 to $99,999 | 2,277 | 16.0% |
| $100,000 to $149,999 | 2,903 | 20.4% |
| $150,000 to $199,999 | 1,153 | 8.1% |
| $200,000+ | 1,081 | 7.6% |
Household Income by Householder Age in Owasso
The median household income in Owasso is $79,183, with the highest median household income of $94,985 found in the 45 to 64 years age bracket for the primary householder. A total of 4,594 households (32.3%) fall into this category. Meanwhile, the 65+ years age bracket for the primary householder has the lowest median household income of $47,165, with 3,127 households (22.0%) in this group.
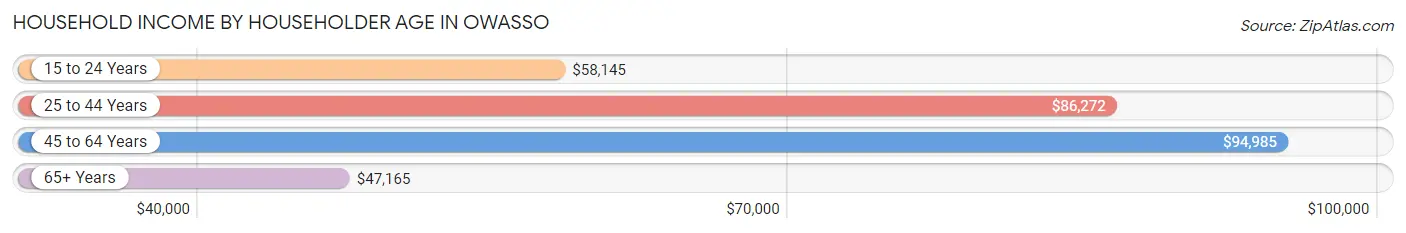
| Income Bracket | # Households | Median Income |
| 15 to 24 Years | 780 (5.5%) | $58,145 |
| 25 to 44 Years | 5,729 (40.3%) | $86,272 |
| 45 to 64 Years | 4,594 (32.3%) | $94,985 |
| 65+ Years | 3,127 (22.0%) | $47,165 |
| Total | 14,230 (100.0%) | $79,183 |
Poverty in Owasso
Income Below Poverty by Sex and Age in Owasso
With 6.3% poverty level for males and 7.8% for females among the residents of Owasso, 18 to 24 year old males and 65 to 74 year old females are the most vulnerable to poverty, with 333 males (15.6%) and 224 females (16.3%) in their respective age groups living below the poverty level.
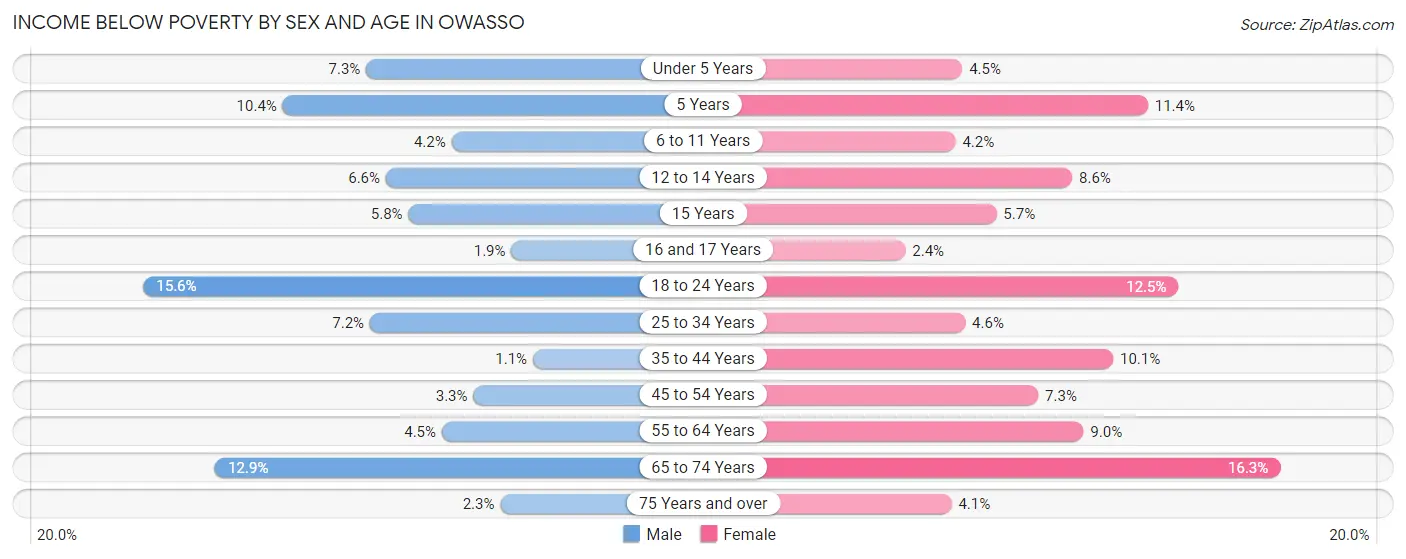
| Age Bracket | Male | Female |
| Under 5 Years | 88 (7.3%) | 56 (4.5%) |
| 5 Years | 32 (10.4%) | 31 (11.4%) |
| 6 to 11 Years | 72 (4.2%) | 59 (4.2%) |
| 12 to 14 Years | 72 (6.6%) | 55 (8.6%) |
| 15 Years | 23 (5.8%) | 22 (5.7%) |
| 16 and 17 Years | 18 (1.9%) | 10 (2.4%) |
| 18 to 24 Years | 333 (15.6%) | 198 (12.5%) |
| 25 to 34 Years | 213 (7.2%) | 133 (4.6%) |
| 35 to 44 Years | 28 (1.1%) | 263 (10.1%) |
| 45 to 54 Years | 77 (3.3%) | 158 (7.3%) |
| 55 to 64 Years | 76 (4.5%) | 187 (9.0%) |
| 65 to 74 Years | 144 (12.9%) | 224 (16.3%) |
| 75 Years and over | 12 (2.3%) | 62 (4.1%) |
| Total | 1,188 (6.3%) | 1,458 (7.8%) |
Income Above Poverty by Sex and Age in Owasso
According to the poverty statistics in Owasso, males aged 35 to 44 years and females aged 16 and 17 years are the age groups that are most secure financially, with 98.9% of males and 97.6% of females in these age groups living above the poverty line.
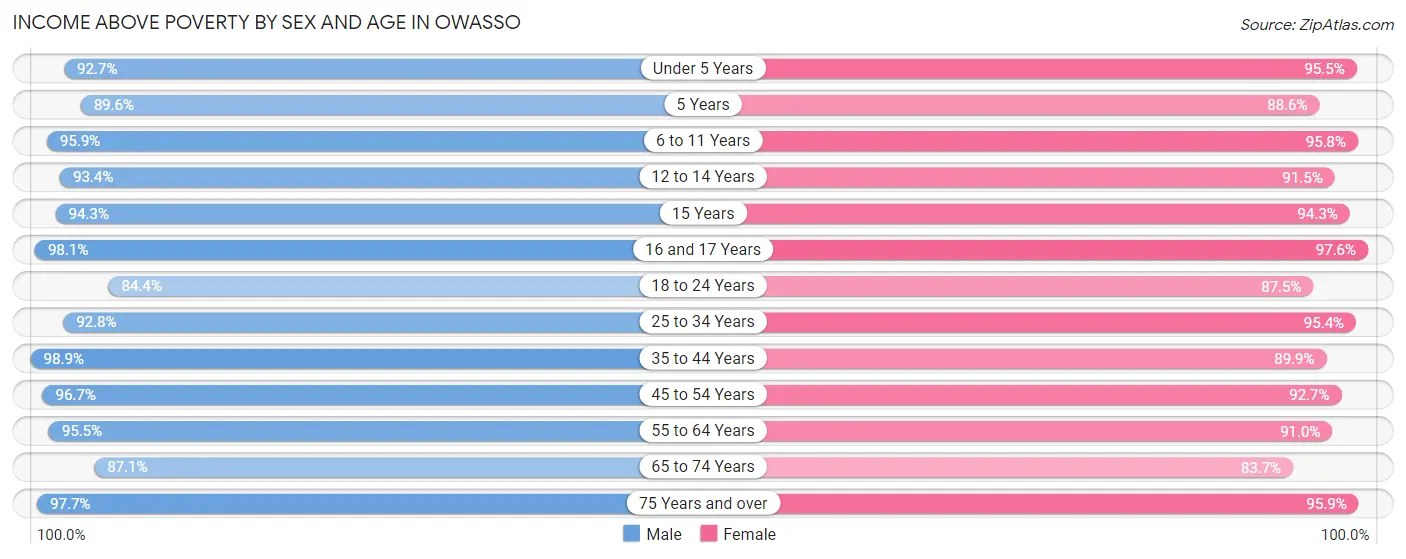
| Age Bracket | Male | Female |
| Under 5 Years | 1,115 (92.7%) | 1,198 (95.5%) |
| 5 Years | 275 (89.6%) | 242 (88.6%) |
| 6 to 11 Years | 1,664 (95.9%) | 1,339 (95.8%) |
| 12 to 14 Years | 1,020 (93.4%) | 588 (91.4%) |
| 15 Years | 377 (94.3%) | 361 (94.3%) |
| 16 and 17 Years | 913 (98.1%) | 414 (97.6%) |
| 18 to 24 Years | 1,803 (84.4%) | 1,387 (87.5%) |
| 25 to 34 Years | 2,754 (92.8%) | 2,768 (95.4%) |
| 35 to 44 Years | 2,457 (98.9%) | 2,350 (89.9%) |
| 45 to 54 Years | 2,225 (96.7%) | 2,008 (92.7%) |
| 55 to 64 Years | 1,609 (95.5%) | 1,898 (91.0%) |
| 65 to 74 Years | 970 (87.1%) | 1,153 (83.7%) |
| 75 Years and over | 500 (97.7%) | 1,460 (95.9%) |
| Total | 17,682 (93.7%) | 17,166 (92.2%) |
Income Below Poverty Among Married-Couple Families in Owasso
The poverty statistics for married-couple families in Owasso show that 3.8% or 280 of the total 7,335 families live below the poverty line. Families with no children have the highest poverty rate of 4.7%, comprising of 176 families. On the other hand, families with 5 or more children have the lowest poverty rate of 0.0%, which includes 0 families.
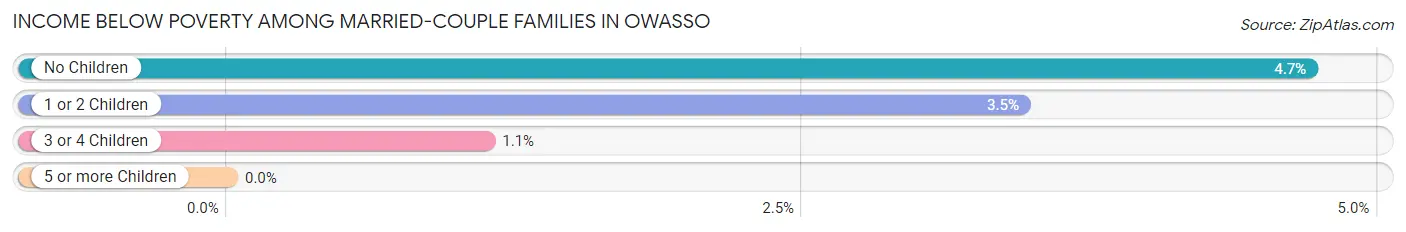
| Children | Above Poverty | Below Poverty |
| No Children | 3,571 (95.3%) | 176 (4.7%) |
| 1 or 2 Children | 2,689 (96.6%) | 96 (3.5%) |
| 3 or 4 Children | 707 (98.9%) | 8 (1.1%) |
| 5 or more Children | 88 (100.0%) | 0 (0.0%) |
| Total | 7,055 (96.2%) | 280 (3.8%) |
Income Below Poverty Among Single-Parent Households in Owasso
According to the poverty data in Owasso, 7.7% or 65 single-father households and 13.8% or 212 single-mother households are living below the poverty line. Among single-father households, those with no children have the highest poverty rate, with 36 households (14.2%) experiencing poverty. Likewise, among single-mother households, those with 3 or 4 children have the highest poverty rate, with 28 households (14.7%) falling below the poverty line.
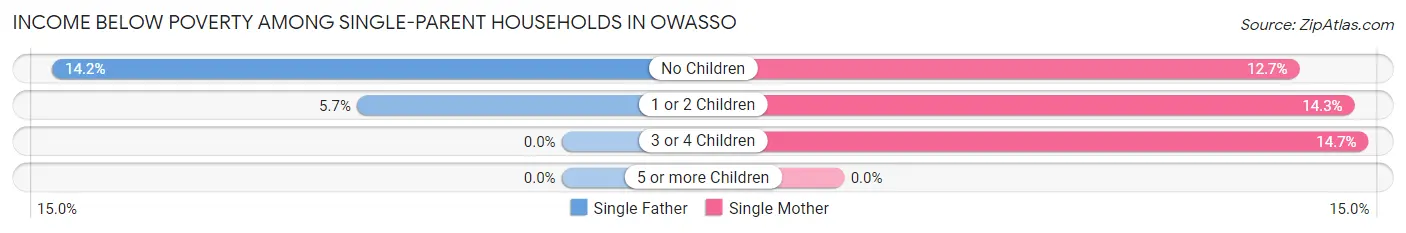
| Children | Single Father | Single Mother |
| No Children | 36 (14.2%) | 61 (12.7%) |
| 1 or 2 Children | 29 (5.7%) | 123 (14.3%) |
| 3 or 4 Children | 0 (0.0%) | 28 (14.7%) |
| 5 or more Children | 0 (0.0%) | 0 (0.0%) |
| Total | 65 (7.7%) | 212 (13.8%) |
Income Below Poverty Among Married-Couple vs Single-Parent Households in Owasso
The poverty data for Owasso shows that 280 of the married-couple family households (3.8%) and 277 of the single-parent households (11.6%) are living below the poverty level. Within the married-couple family households, those with no children have the highest poverty rate, with 176 households (4.7%) falling below the poverty line. Among the single-parent households, those with no children have the highest poverty rate, with 97 household (13.3%) living below poverty.
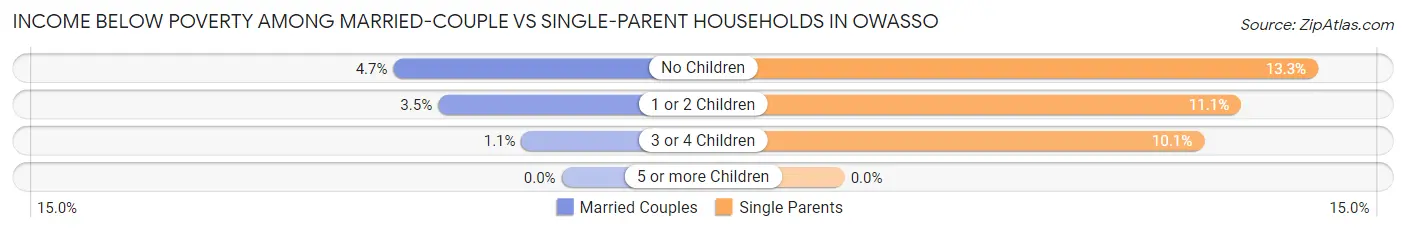
| Children | Married-Couple Families | Single-Parent Households |
| No Children | 176 (4.7%) | 97 (13.3%) |
| 1 or 2 Children | 96 (3.5%) | 152 (11.1%) |
| 3 or 4 Children | 8 (1.1%) | 28 (10.1%) |
| 5 or more Children | 0 (0.0%) | 0 (0.0%) |
| Total | 280 (3.8%) | 277 (11.6%) |
Race in Owasso
The most populous races in Owasso are White / Caucasian (27,374 | 71.8%), Two or more Races (4,062 | 10.6%), and Native / Alaskan (2,953 | 7.7%).
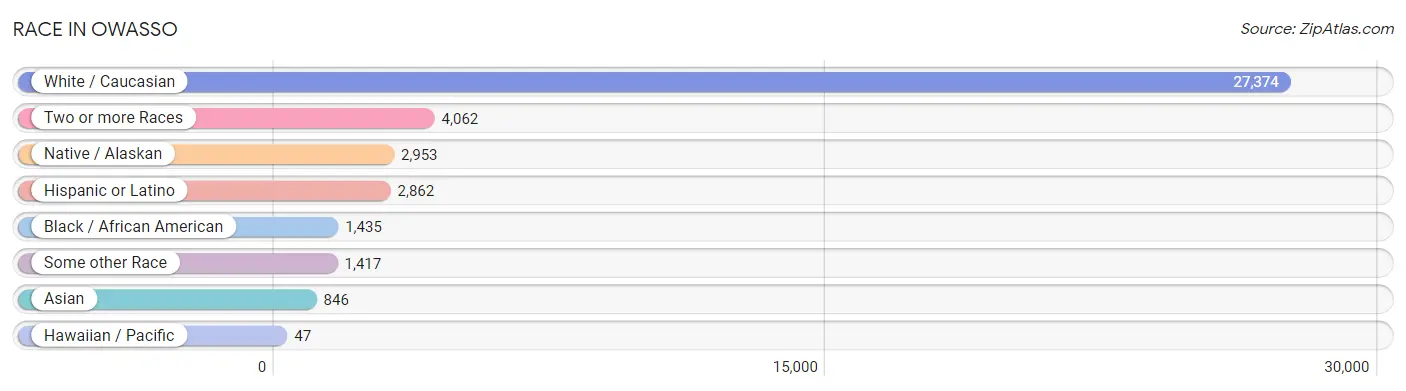
| Race | # Population | % Population |
| Asian | 846 | 2.2% |
| Black / African American | 1,435 | 3.8% |
| Hawaiian / Pacific | 47 | 0.1% |
| Hispanic or Latino | 2,862 | 7.5% |
| Native / Alaskan | 2,953 | 7.7% |
| White / Caucasian | 27,374 | 71.8% |
| Two or more Races | 4,062 | 10.6% |
| Some other Race | 1,417 | 3.7% |
| Total | 38,134 | 100.0% |
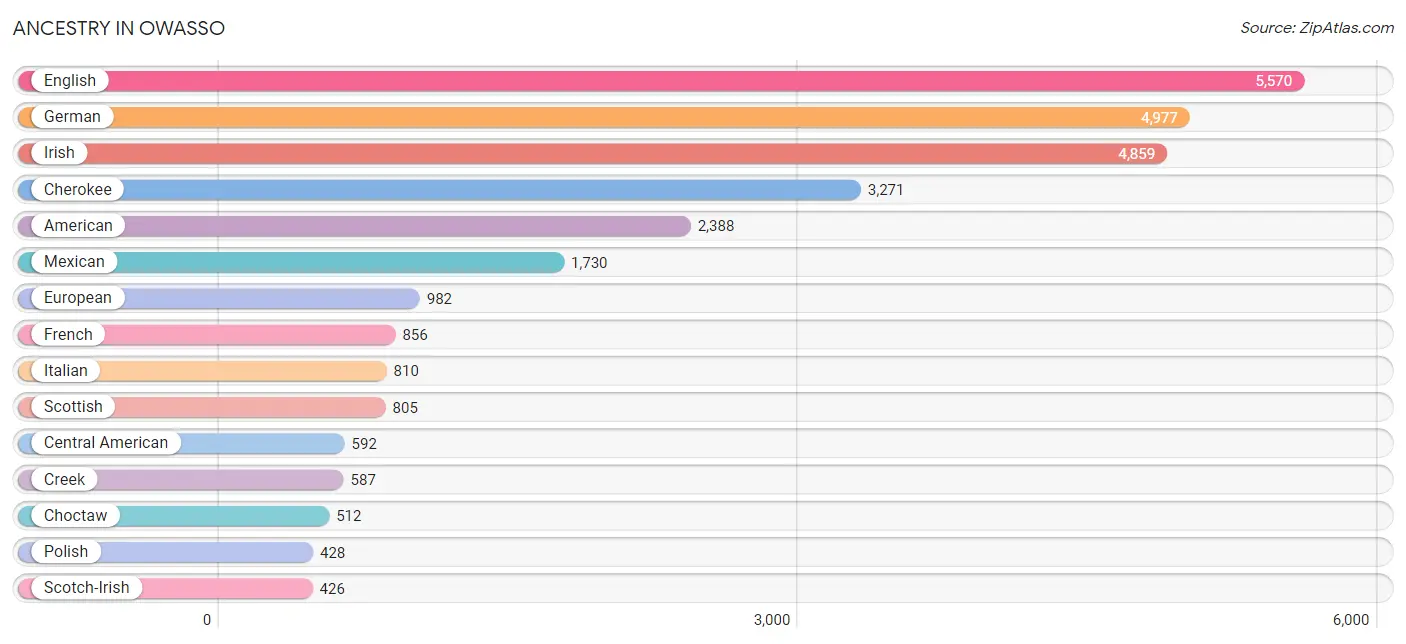
Ancestry in Owasso
The most populous ancestries reported in Owasso are English (5,570 | 14.6%), German (4,977 | 13.1%), Irish (4,859 | 12.7%), Cherokee (3,271 | 8.6%), and American (2,388 | 6.3%), together accounting for 55.2% of all Owasso residents.
| Ancestry | # Population | % Population |
| American | 2,388 | 6.3% |
| Apache | 43 | 0.1% |
| Arab | 185 | 0.5% |
| Armenian | 20 | 0.1% |
| Austrian | 17 | 0.0% |
| Bangladeshi | 314 | 0.8% |
| Belizean | 47 | 0.1% |
| Bhutanese | 135 | 0.4% |
| Brazilian | 22 | 0.1% |
| British | 232 | 0.6% |
| Burmese | 107 | 0.3% |
| Canadian | 12 | 0.0% |
| Central American | 592 | 1.5% |
| Cherokee | 3,271 | 8.6% |
| Chickasaw | 330 | 0.9% |
| Chippewa | 7 | 0.0% |
| Choctaw | 512 | 1.3% |
| Colombian | 70 | 0.2% |
| Creek | 587 | 1.5% |
| Cuban | 38 | 0.1% |
| Czech | 122 | 0.3% |
| Czechoslovakian | 8 | 0.0% |
| Danish | 99 | 0.3% |
| Delaware | 249 | 0.6% |
| Dominican | 149 | 0.4% |
| Dutch | 290 | 0.8% |
| Dutch West Indian | 89 | 0.2% |
| Eastern European | 36 | 0.1% |
| English | 5,570 | 14.6% |
| European | 982 | 2.6% |
| Fijian | 47 | 0.1% |
| Finnish | 30 | 0.1% |
| French | 856 | 2.2% |
| French Canadian | 147 | 0.4% |
| German | 4,977 | 13.1% |
| German Russian | 19 | 0.1% |
| Greek | 114 | 0.3% |
| Guatemalan | 327 | 0.9% |
| Honduran | 58 | 0.2% |
| Hungarian | 60 | 0.2% |
| Indian (Asian) | 18 | 0.1% |
| Inupiat | 42 | 0.1% |
| Iranian | 34 | 0.1% |
| Irish | 4,859 | 12.7% |
| Iroquois | 54 | 0.1% |
| Italian | 810 | 2.1% |
| Korean | 83 | 0.2% |
| Latvian | 9 | 0.0% |
| Lebanese | 54 | 0.1% |
| Lithuanian | 14 | 0.0% |
| Mexican | 1,730 | 4.5% |
| Mexican American Indian | 4 | 0.0% |
| Native Hawaiian | 9 | 0.0% |
| Navajo | 24 | 0.1% |
| Northern European | 31 | 0.1% |
| Norwegian | 107 | 0.3% |
| Osage | 114 | 0.3% |
| Ottawa | 12 | 0.0% |
| Pakistani | 47 | 0.1% |
| Polish | 428 | 1.1% |
| Portuguese | 138 | 0.4% |
| Potawatomi | 61 | 0.2% |
| Puerto Rican | 112 | 0.3% |
| Romanian | 37 | 0.1% |
| Russian | 86 | 0.2% |
| Salvadoran | 207 | 0.5% |
| Scandinavian | 106 | 0.3% |
| Scotch-Irish | 426 | 1.1% |
| Scottish | 805 | 2.1% |
| Seminole | 86 | 0.2% |
| Sioux | 21 | 0.1% |
| Slavic | 25 | 0.1% |
| Slovak | 15 | 0.0% |
| South American | 171 | 0.4% |
| Spaniard | 12 | 0.0% |
| Spanish | 22 | 0.1% |
| Sri Lankan | 312 | 0.8% |
| Swedish | 240 | 0.6% |
| Swiss | 51 | 0.1% |
| Syrian | 16 | 0.0% |
| Thai | 109 | 0.3% |
| Ukrainian | 157 | 0.4% |
| Venezuelan | 101 | 0.3% |
| Welsh | 245 | 0.6% | View All 84 Rows |
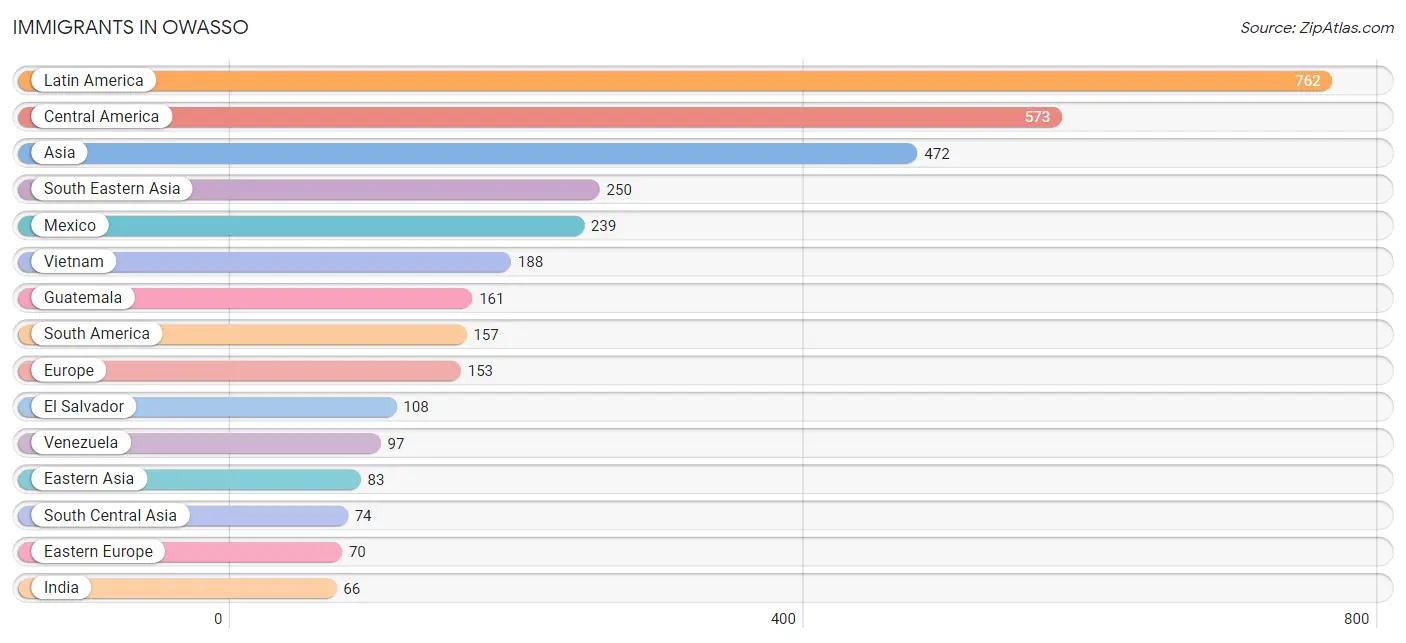
Immigrants in Owasso
The most numerous immigrant groups reported in Owasso came from Latin America (762 | 2.0%), Central America (573 | 1.5%), Asia (472 | 1.2%), South Eastern Asia (250 | 0.7%), and Mexico (239 | 0.6%), together accounting for 6.0% of all Owasso residents.
| Immigration Origin | # Population | % Population |
| Africa | 36 | 0.1% |
| Asia | 472 | 1.2% |
| Belize | 21 | 0.1% |
| Brazil | 16 | 0.0% |
| Canada | 61 | 0.2% |
| Caribbean | 32 | 0.1% |
| Central America | 573 | 1.5% |
| China | 18 | 0.1% |
| Colombia | 29 | 0.1% |
| Cuba | 9 | 0.0% |
| Czechoslovakia | 18 | 0.1% |
| Dominican Republic | 1 | 0.0% |
| Eastern Africa | 19 | 0.1% |
| Eastern Asia | 83 | 0.2% |
| Eastern Europe | 70 | 0.2% |
| El Salvador | 108 | 0.3% |
| England | 6 | 0.0% |
| Europe | 153 | 0.4% |
| France | 18 | 0.1% |
| Germany | 25 | 0.1% |
| Greece | 7 | 0.0% |
| Guatemala | 161 | 0.4% |
| Guyana | 15 | 0.0% |
| Honduras | 44 | 0.1% |
| Hong Kong | 1 | 0.0% |
| India | 66 | 0.2% |
| Iran | 8 | 0.0% |
| Iraq | 32 | 0.1% |
| Italy | 14 | 0.0% |
| Japan | 18 | 0.1% |
| Korea | 47 | 0.1% |
| Laos | 12 | 0.0% |
| Latin America | 762 | 2.0% |
| Mexico | 239 | 0.6% |
| Northern Europe | 19 | 0.1% |
| Oceania | 47 | 0.1% |
| Philippines | 9 | 0.0% |
| Romania | 18 | 0.1% |
| Russia | 34 | 0.1% |
| South America | 157 | 0.4% |
| South Central Asia | 74 | 0.2% |
| South Eastern Asia | 250 | 0.7% |
| Southern Europe | 21 | 0.1% |
| Syria | 16 | 0.0% |
| Thailand | 41 | 0.1% |
| Trinidad and Tobago | 22 | 0.1% |
| Venezuela | 97 | 0.3% |
| Vietnam | 188 | 0.5% |
| Western Africa | 17 | 0.0% |
| Western Asia | 65 | 0.2% |
| Western Europe | 43 | 0.1% | View All 51 Rows |
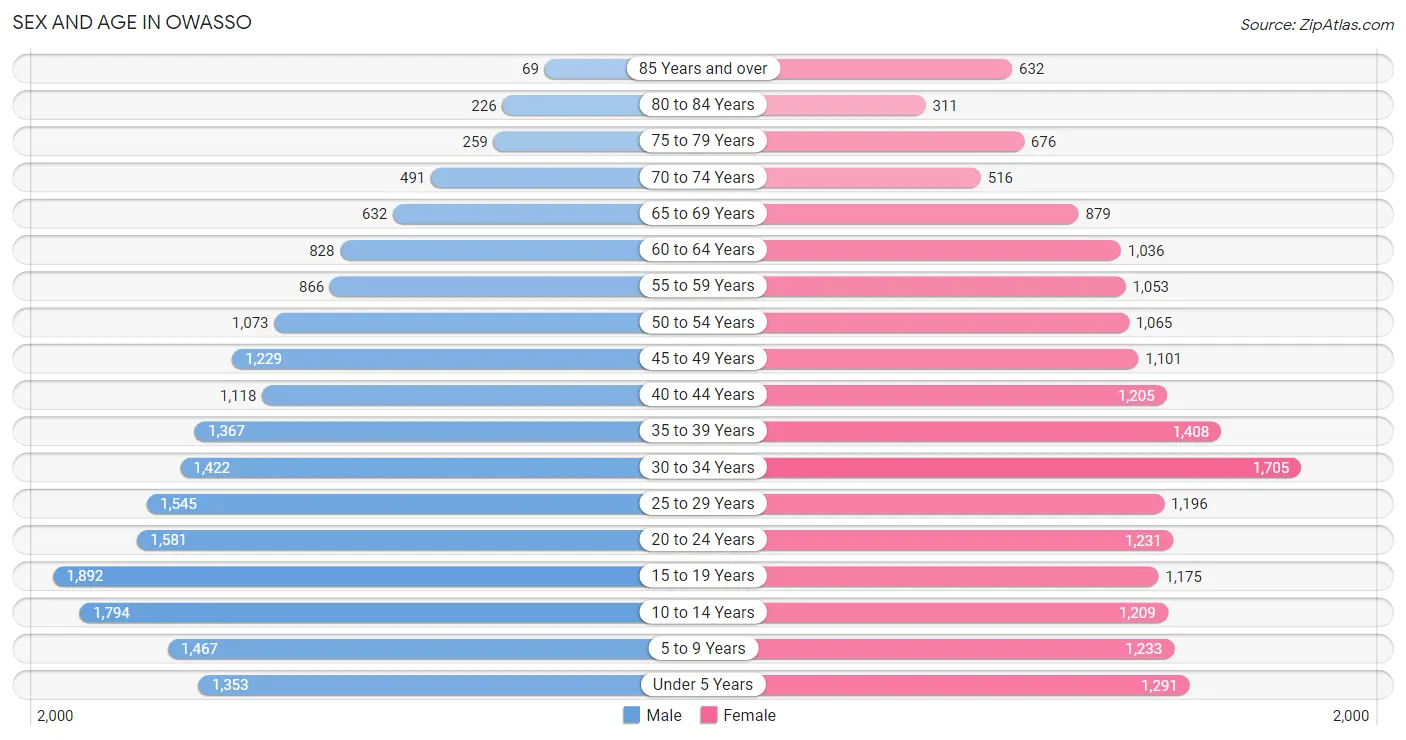
Sex and Age in Owasso
Sex and Age in Owasso
The most populous age groups in Owasso are 15 to 19 Years (1,892 | 9.9%) for men and 30 to 34 Years (1,705 | 9.0%) for women.
| Age Bracket | Male | Female |
| Under 5 Years | 1,353 (7.0%) | 1,291 (6.8%) |
| 5 to 9 Years | 1,467 (7.6%) | 1,233 (6.5%) |
| 10 to 14 Years | 1,794 (9.3%) | 1,209 (6.4%) |
| 15 to 19 Years | 1,892 (9.9%) | 1,175 (6.2%) |
| 20 to 24 Years | 1,581 (8.2%) | 1,231 (6.5%) |
| 25 to 29 Years | 1,545 (8.0%) | 1,196 (6.3%) |
| 30 to 34 Years | 1,422 (7.4%) | 1,705 (9.0%) |
| 35 to 39 Years | 1,367 (7.1%) | 1,408 (7.4%) |
| 40 to 44 Years | 1,118 (5.8%) | 1,205 (6.4%) |
| 45 to 49 Years | 1,229 (6.4%) | 1,101 (5.8%) |
| 50 to 54 Years | 1,073 (5.6%) | 1,065 (5.6%) |
| 55 to 59 Years | 866 (4.5%) | 1,053 (5.6%) |
| 60 to 64 Years | 828 (4.3%) | 1,036 (5.5%) |
| 65 to 69 Years | 632 (3.3%) | 879 (4.6%) |
| 70 to 74 Years | 491 (2.6%) | 516 (2.7%) |
| 75 to 79 Years | 259 (1.3%) | 676 (3.6%) |
| 80 to 84 Years | 226 (1.2%) | 311 (1.6%) |
| 85 Years and over | 69 (0.4%) | 632 (3.3%) |
| Total | 19,212 (100.0%) | 18,922 (100.0%) |
Families and Households in Owasso
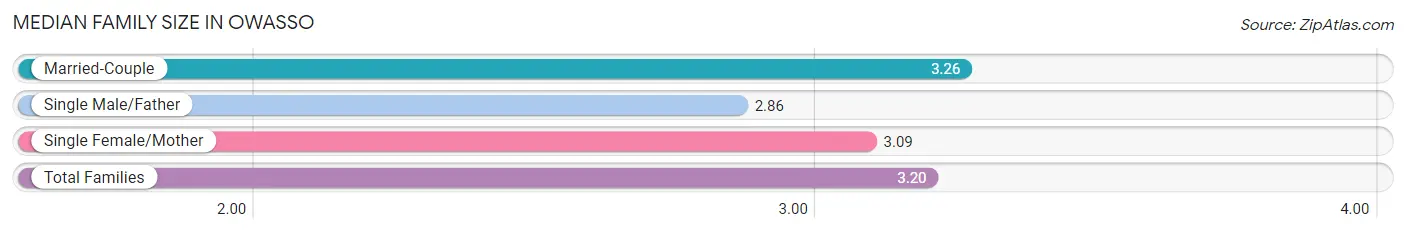
Median Family Size in Owasso
The median family size in Owasso is 3.20 persons per family, with married-couple families (7,335 | 75.5%) accounting for the largest median family size of 3.26 persons per family. On the other hand, single male/father families (847 | 8.7%) represent the smallest median family size with 2.86 persons per family.
| Family Type | # Families | Family Size |
| Married-Couple | 7,335 (75.5%) | 3.26 |
| Single Male/Father | 847 (8.7%) | 2.86 |
| Single Female/Mother | 1,532 (15.8%) | 3.09 |
| Total Families | 9,714 (100.0%) | 3.20 |
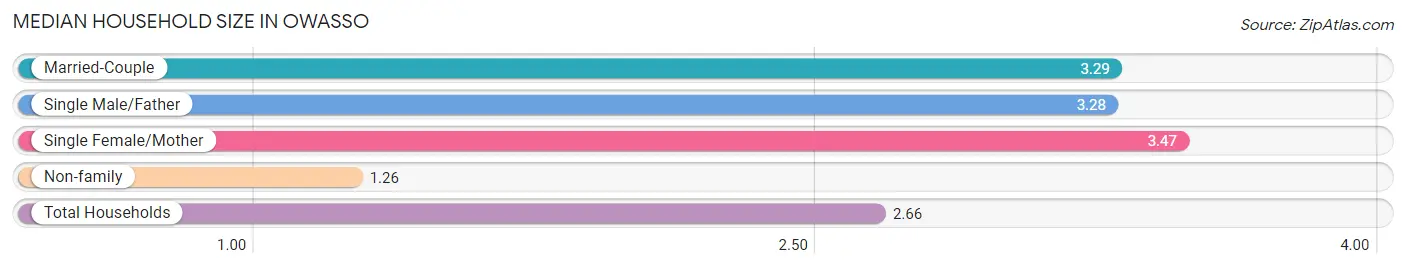
Median Household Size in Owasso
The median household size in Owasso is 2.66 persons per household, with single female/mother households (1,532 | 10.8%) accounting for the largest median household size of 3.47 persons per household. non-family households (4,516 | 31.7%) represent the smallest median household size with 1.26 persons per household.
| Household Type | # Households | Household Size |
| Married-Couple | 7,335 (51.5%) | 3.29 |
| Single Male/Father | 847 (5.9%) | 3.28 |
| Single Female/Mother | 1,532 (10.8%) | 3.47 |
| Non-family | 4,516 (31.7%) | 1.26 |
| Total Households | 14,230 (100.0%) | 2.66 |
Household Size by Marriage Status in Owasso
Out of a total of 14,230 households in Owasso, 9,714 (68.3%) are family households, while 4,516 (31.7%) are nonfamily households. The most numerous type of family households are 2-person households, comprising 3,624, and the most common type of nonfamily households are 1-person households, comprising 3,686.
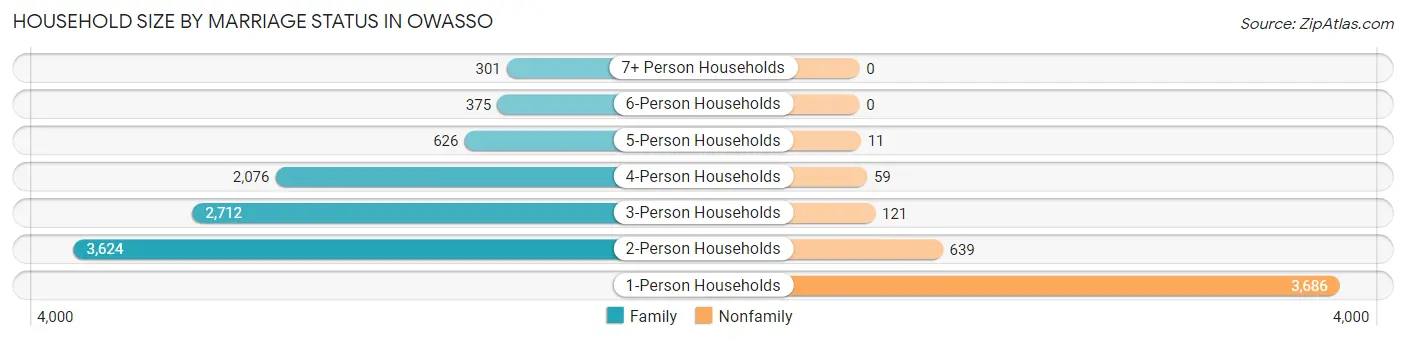
| Household Size | Family Households | Nonfamily Households |
| 1-Person Households | - | 3,686 (25.9%) |
| 2-Person Households | 3,624 (25.5%) | 639 (4.5%) |
| 3-Person Households | 2,712 (19.1%) | 121 (0.9%) |
| 4-Person Households | 2,076 (14.6%) | 59 (0.4%) |
| 5-Person Households | 626 (4.4%) | 11 (0.1%) |
| 6-Person Households | 375 (2.6%) | 0 (0.0%) |
| 7+ Person Households | 301 (2.1%) | 0 (0.0%) |
| Total | 9,714 (68.3%) | 4,516 (31.7%) |
Female Fertility in Owasso
Fertility by Age in Owasso
Average fertility rate in Owasso is 56.0 births per 1,000 women. Women in the age bracket of 20 to 34 years have the highest fertility rate with 102.0 births per 1,000 women. Women in the age bracket of 20 to 34 years acount for 80.6% of all women with births.
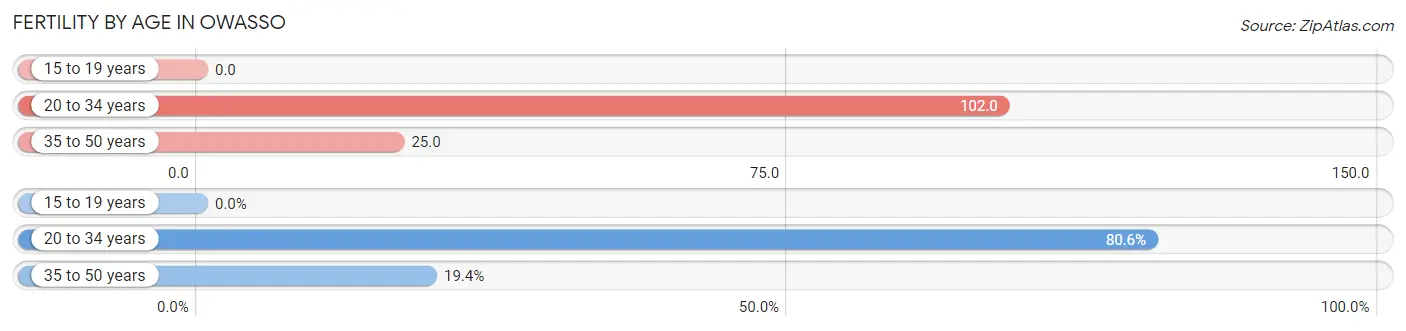
| Age Bracket | Women with Births | Births / 1,000 Women |
| 15 to 19 years | 0 (0.0%) | 0.0 |
| 20 to 34 years | 423 (80.6%) | 102.0 |
| 35 to 50 years | 102 (19.4%) | 25.0 |
| Total | 525 (100.0%) | 56.0 |
Fertility by Age by Marriage Status in Owasso
76.6% of women with births (525) in Owasso are married. The highest percentage of unmarried women with births falls into 20 to 34 years age bracket with 25.5% of them unmarried at the time of birth, while the lowest percentage of unmarried women with births belong to 35 to 50 years age bracket with 14.7% of them unmarried.
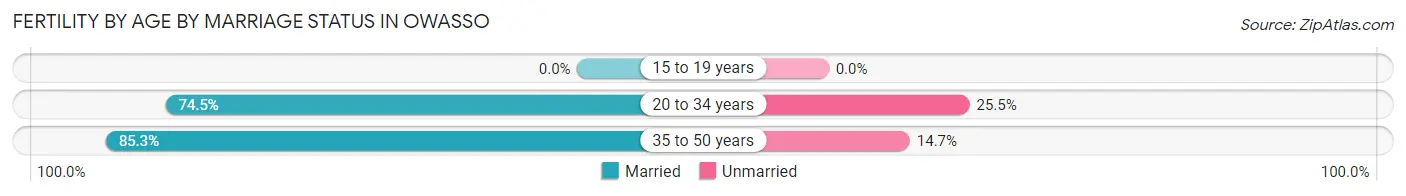
| Age Bracket | Married | Unmarried |
| 15 to 19 years | 0 (0.0%) | 0 (0.0%) |
| 20 to 34 years | 315 (74.5%) | 108 (25.5%) |
| 35 to 50 years | 87 (85.3%) | 15 (14.7%) |
| Total | 402 (76.6%) | 123 (23.4%) |
Fertility by Education in Owasso
Average fertility rate in Owasso is 56.0 births per 1,000 women. Women with the education attainment of graduate degree have the highest fertility rate of 97.0 births per 1,000 women, while women with the education attainment of less than high school have the lowest fertility at 33.0 births per 1,000 women. Women with the education attainment of bachelor's degree represent 34.9% of all women with births.
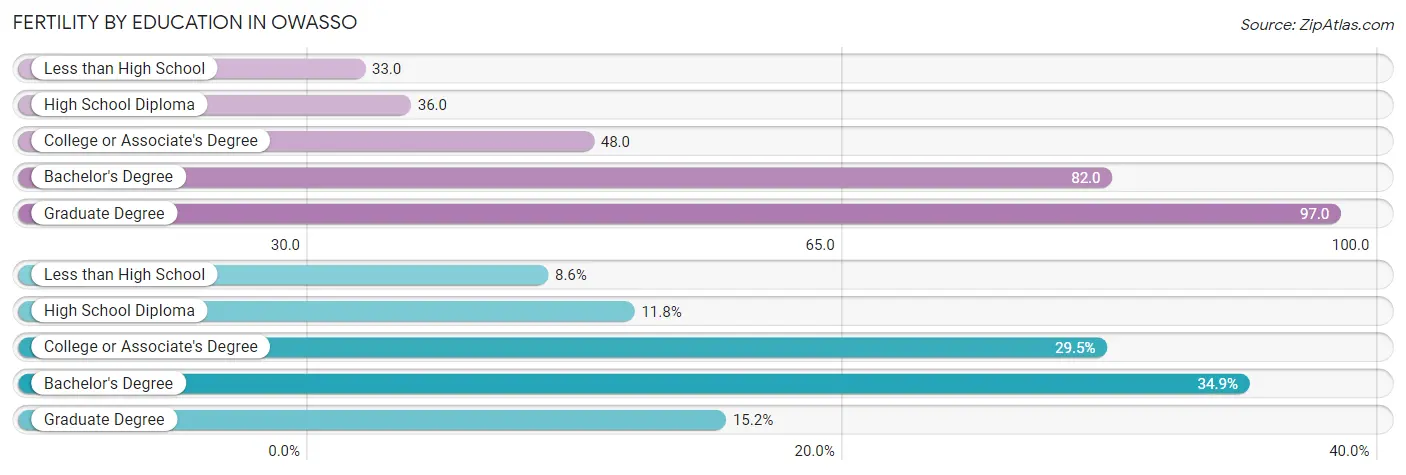
| Educational Attainment | Women with Births | Births / 1,000 Women |
| Less than High School | 45 (8.6%) | 33.0 |
| High School Diploma | 62 (11.8%) | 36.0 |
| College or Associate's Degree | 155 (29.5%) | 48.0 |
| Bachelor's Degree | 183 (34.9%) | 82.0 |
| Graduate Degree | 80 (15.2%) | 97.0 |
| Total | 525 (100.0%) | 56.0 |
Fertility by Education by Marriage Status in Owasso
23.4% of women with births in Owasso are unmarried. Women with the educational attainment of graduate degree are most likely to be married with 100.0% of them married at childbirth, while women with the educational attainment of less than high school are least likely to be married with 91.1% of them unmarried at childbirth.
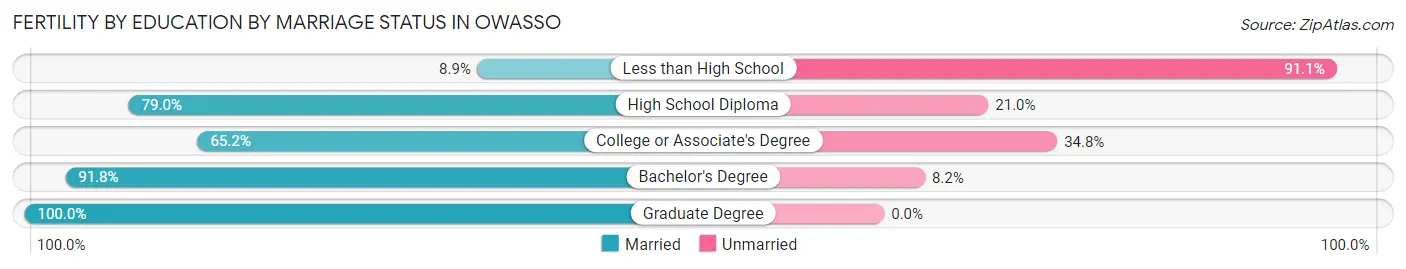
| Educational Attainment | Married | Unmarried |
| Less than High School | 4 (8.9%) | 41 (91.1%) |
| High School Diploma | 49 (79.0%) | 13 (21.0%) |
| College or Associate's Degree | 101 (65.2%) | 54 (34.8%) |
| Bachelor's Degree | 168 (91.8%) | 15 (8.2%) |
| Graduate Degree | 80 (100.0%) | 0 (0.0%) |
| Total | 402 (76.6%) | 123 (23.4%) |
Employment Characteristics in Owasso
Employment by Class of Employer in Owasso
Among the 19,069 employed individuals in Owasso, private company employees (13,940 | 73.1%), not-for-profit organizations (1,435 | 7.5%), and local government employees (1,305 | 6.8%) make up the most common classes of employment.
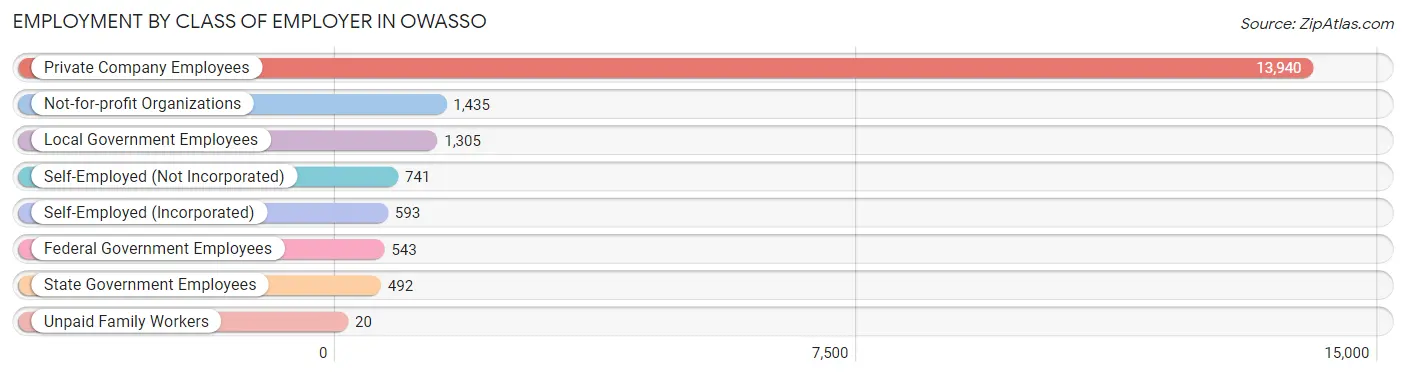
| Employer Class | # Employees | % Employees |
| Private Company Employees | 13,940 | 73.1% |
| Self-Employed (Incorporated) | 593 | 3.1% |
| Self-Employed (Not Incorporated) | 741 | 3.9% |
| Not-for-profit Organizations | 1,435 | 7.5% |
| Local Government Employees | 1,305 | 6.8% |
| State Government Employees | 492 | 2.6% |
| Federal Government Employees | 543 | 2.9% |
| Unpaid Family Workers | 20 | 0.1% |
| Total | 19,069 | 100.0% |
Employment Status by Age in Owasso
According to the labor force statistics for Owasso, out of the total population over 16 years of age (28,995), 70.1% or 20,325 individuals are in the labor force, with 4.6% or 935 of them unemployed. The age group with the highest labor force participation rate is 25 to 29 years, with 94.5% or 2,590 individuals in the labor force. Within the labor force, the 16 to 19 years age range has the highest percentage of unemployed individuals, with 20.0% or 221 of them being unemployed.
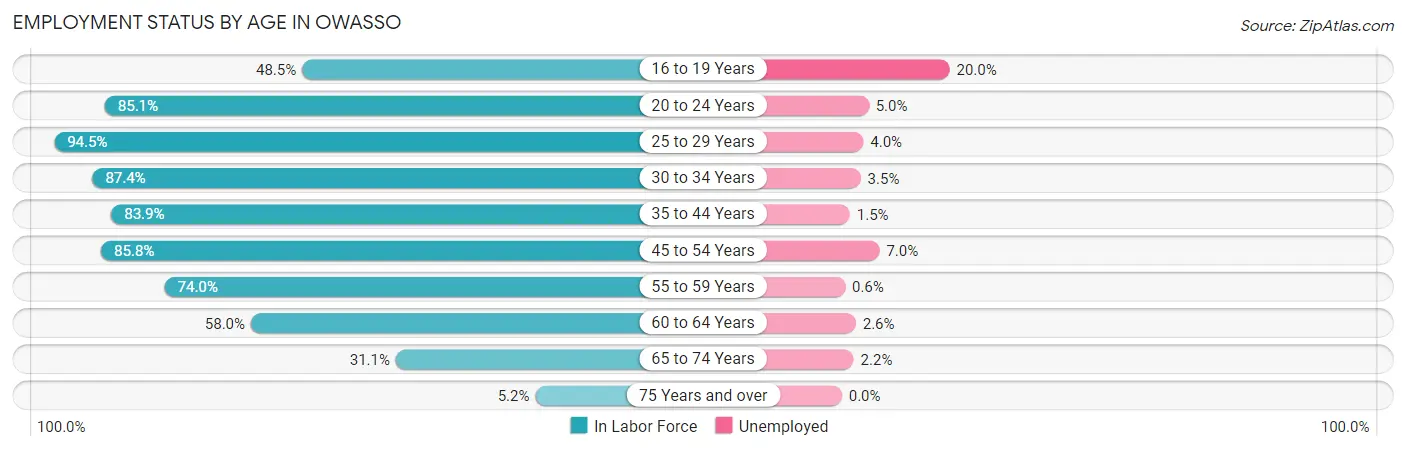
| Age Bracket | In Labor Force | Unemployed |
| 16 to 19 Years | 1,103 (48.5%) | 221 (20.0%) |
| 20 to 24 Years | 2,393 (85.1%) | 120 (5.0%) |
| 25 to 29 Years | 2,590 (94.5%) | 104 (4.0%) |
| 30 to 34 Years | 2,733 (87.4%) | 96 (3.5%) |
| 35 to 44 Years | 4,277 (83.9%) | 64 (1.5%) |
| 45 to 54 Years | 3,834 (85.8%) | 268 (7.0%) |
| 55 to 59 Years | 1,420 (74.0%) | 9 (0.6%) |
| 60 to 64 Years | 1,081 (58.0%) | 28 (2.6%) |
| 65 to 74 Years | 783 (31.1%) | 17 (2.2%) |
| 75 Years and over | 113 (5.2%) | 0 (0.0%) |
| Total | 20,325 (70.1%) | 935 (4.6%) |
Employment Status by Educational Attainment in Owasso
According to labor force statistics for Owasso, 82.9% of individuals (15,931) out of the total population between 25 and 64 years of age (19,217) are in the labor force, with 3.6% or 574 of them being unemployed. The group with the highest labor force participation rate are those with the educational attainment of bachelor's degree or higher, with 88.4% or 6,150 individuals in the labor force. Within the labor force, individuals with high school diploma education have the highest percentage of unemployment, with 4.6% or 147 of them being unemployed.
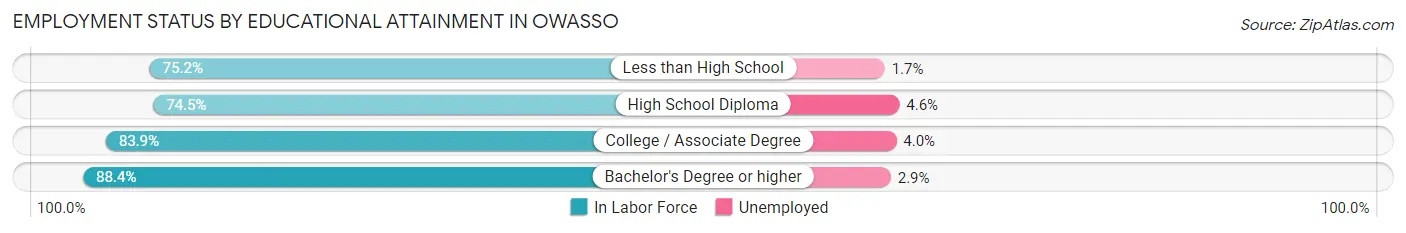
| Educational Attainment | In Labor Force | Unemployed |
| Less than High School | 841 (75.2%) | 19 (1.7%) |
| High School Diploma | 3,185 (74.5%) | 197 (4.6%) |
| College / Associate Degree | 5,761 (83.9%) | 275 (4.0%) |
| Bachelor's Degree or higher | 6,150 (88.4%) | 202 (2.9%) |
| Total | 15,931 (82.9%) | 692 (3.6%) |
Employment Occupations by Sex in Owasso
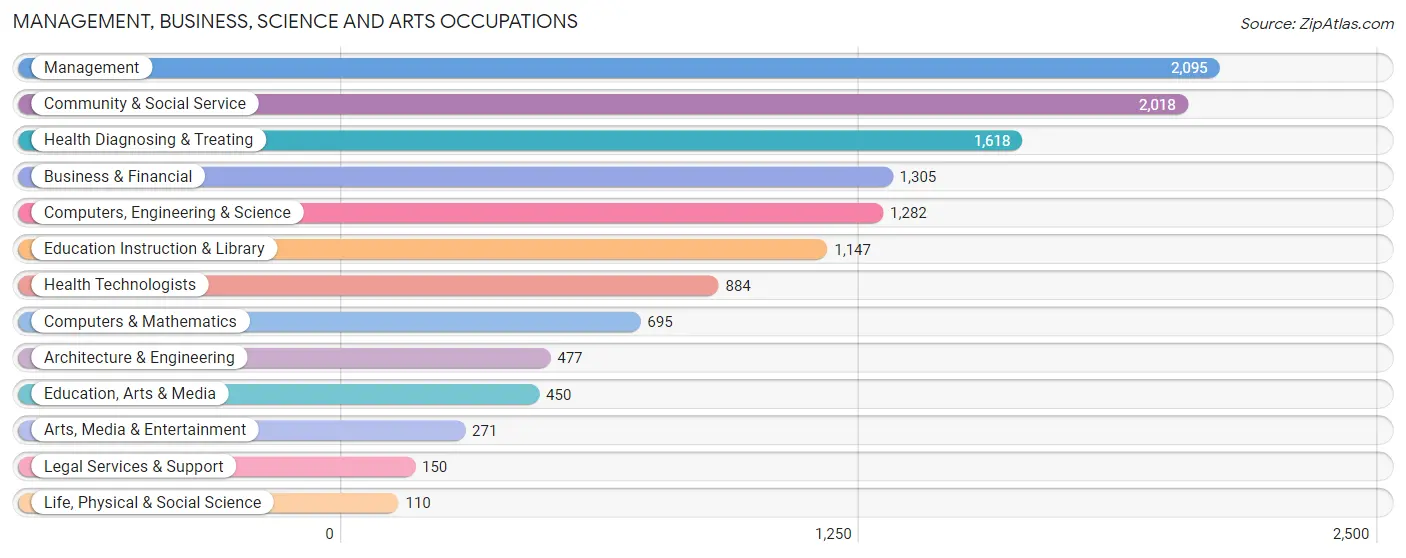
Management, Business, Science and Arts Occupations
The most common Management, Business, Science and Arts occupations in Owasso are Management (2,095 | 10.9%), Community & Social Service (2,018 | 10.5%), Health Diagnosing & Treating (1,618 | 8.4%), Business & Financial (1,305 | 6.8%), and Computers, Engineering & Science (1,282 | 6.7%).
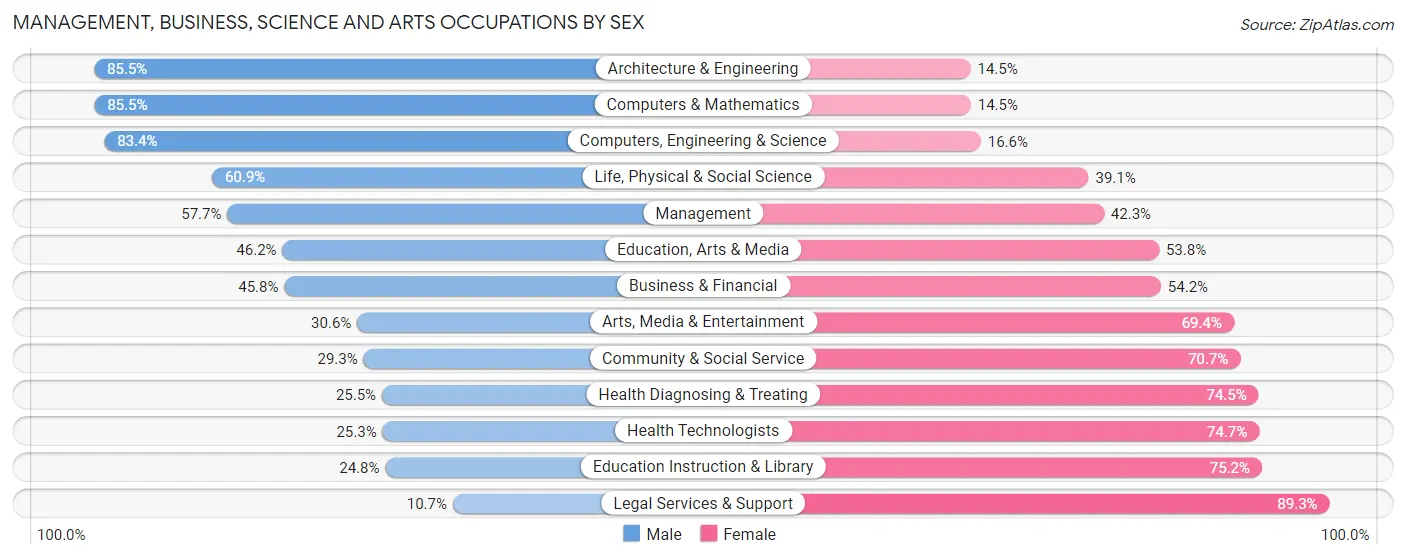
Management, Business, Science and Arts Occupations by Sex
Within the Management, Business, Science and Arts occupations in Owasso, the most male-oriented occupations are Architecture & Engineering (85.5%), Computers & Mathematics (85.5%), and Computers, Engineering & Science (83.4%), while the most female-oriented occupations are Legal Services & Support (89.3%), Education Instruction & Library (75.2%), and Health Technologists (74.7%).
| Occupation | Male | Female |
| Management | 1,209 (57.7%) | 886 (42.3%) |
| Business & Financial | 598 (45.8%) | 707 (54.2%) |
| Computers, Engineering & Science | 1,069 (83.4%) | 213 (16.6%) |
| Computers & Mathematics | 594 (85.5%) | 101 (14.5%) |
| Architecture & Engineering | 408 (85.5%) | 69 (14.5%) |
| Life, Physical & Social Science | 67 (60.9%) | 43 (39.1%) |
| Community & Social Service | 591 (29.3%) | 1,427 (70.7%) |
| Education, Arts & Media | 208 (46.2%) | 242 (53.8%) |
| Legal Services & Support | 16 (10.7%) | 134 (89.3%) |
| Education Instruction & Library | 284 (24.8%) | 863 (75.2%) |
| Arts, Media & Entertainment | 83 (30.6%) | 188 (69.4%) |
| Health Diagnosing & Treating | 412 (25.5%) | 1,206 (74.5%) |
| Health Technologists | 224 (25.3%) | 660 (74.7%) |
| Total (Category) | 3,879 (46.6%) | 4,439 (53.4%) |
| Total (Overall) | 10,304 (53.5%) | 8,951 (46.5%) |
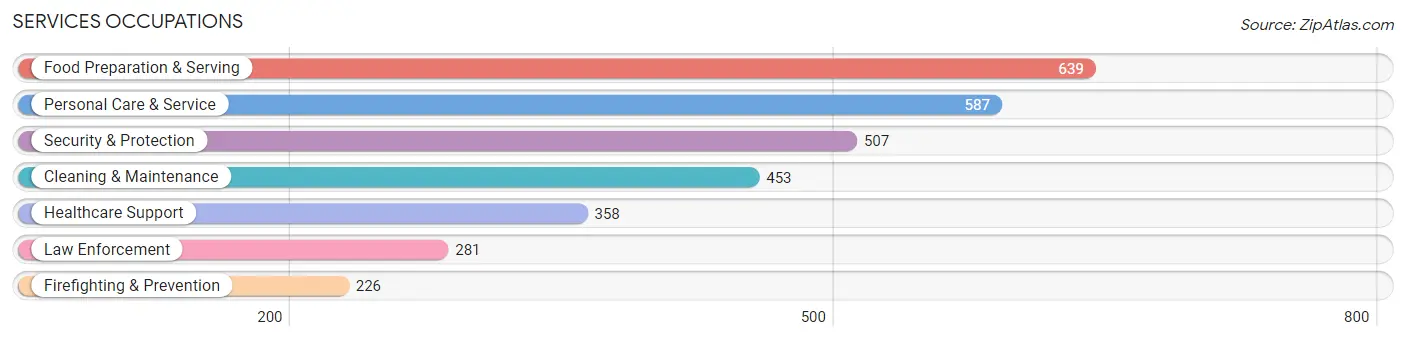
Services Occupations
The most common Services occupations in Owasso are Food Preparation & Serving (639 | 3.3%), Personal Care & Service (587 | 3.0%), Security & Protection (507 | 2.6%), Cleaning & Maintenance (453 | 2.4%), and Healthcare Support (358 | 1.9%).
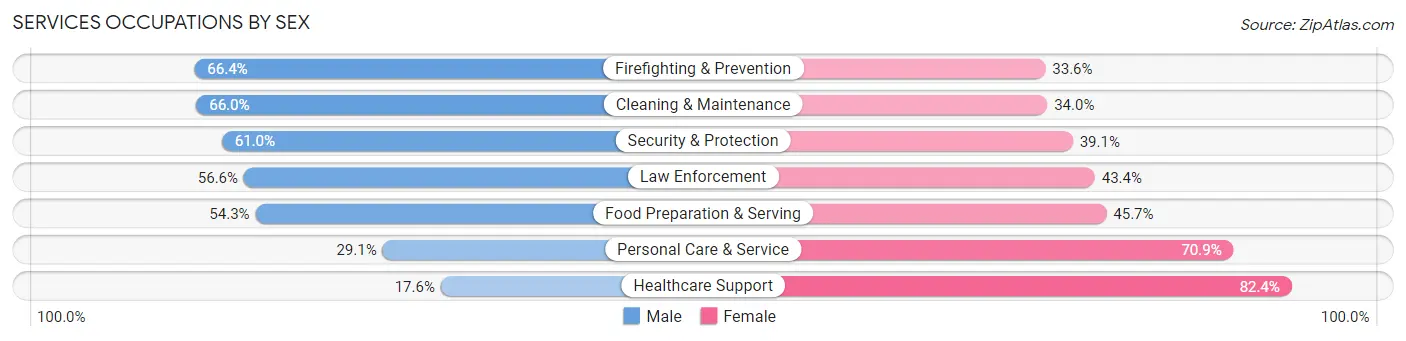
Services Occupations by Sex
Within the Services occupations in Owasso, the most male-oriented occupations are Firefighting & Prevention (66.4%), Cleaning & Maintenance (66.0%), and Security & Protection (61.0%), while the most female-oriented occupations are Healthcare Support (82.4%), Personal Care & Service (70.9%), and Food Preparation & Serving (45.7%).
| Occupation | Male | Female |
| Healthcare Support | 63 (17.6%) | 295 (82.4%) |
| Security & Protection | 309 (61.0%) | 198 (39.1%) |
| Firefighting & Prevention | 150 (66.4%) | 76 (33.6%) |
| Law Enforcement | 159 (56.6%) | 122 (43.4%) |
| Food Preparation & Serving | 347 (54.3%) | 292 (45.7%) |
| Cleaning & Maintenance | 299 (66.0%) | 154 (34.0%) |
| Personal Care & Service | 171 (29.1%) | 416 (70.9%) |
| Total (Category) | 1,189 (46.7%) | 1,355 (53.3%) |
| Total (Overall) | 10,304 (53.5%) | 8,951 (46.5%) |
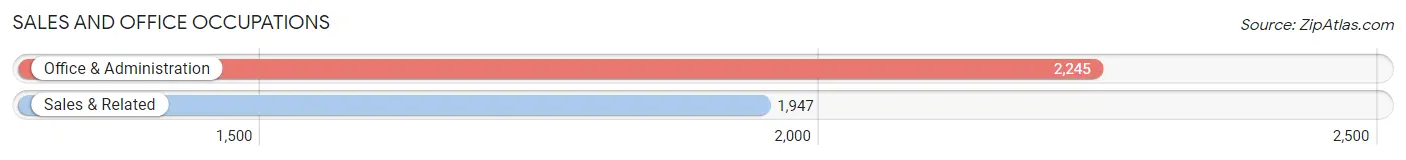
Sales and Office Occupations
The most common Sales and Office occupations in Owasso are Office & Administration (2,245 | 11.7%), and Sales & Related (1,947 | 10.1%).
Sales and Office Occupations by Sex
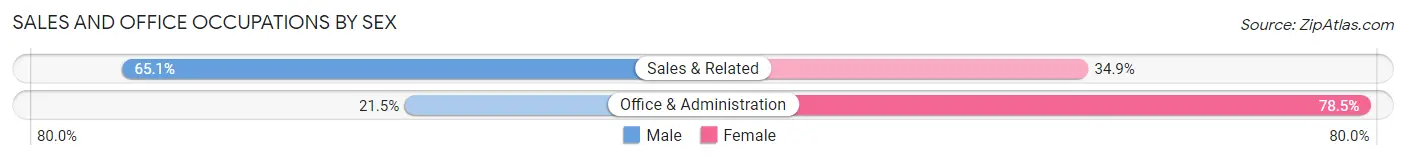
| Occupation | Male | Female |
| Sales & Related | 1,267 (65.1%) | 680 (34.9%) |
| Office & Administration | 482 (21.5%) | 1,763 (78.5%) |
| Total (Category) | 1,749 (41.7%) | 2,443 (58.3%) |
| Total (Overall) | 10,304 (53.5%) | 8,951 (46.5%) |
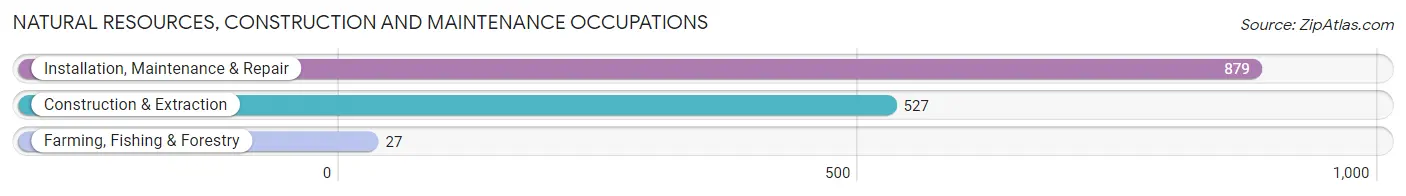
Natural Resources, Construction and Maintenance Occupations
The most common Natural Resources, Construction and Maintenance occupations in Owasso are Installation, Maintenance & Repair (879 | 4.6%), Construction & Extraction (527 | 2.7%), and Farming, Fishing & Forestry (27 | 0.1%).
Natural Resources, Construction and Maintenance Occupations by Sex
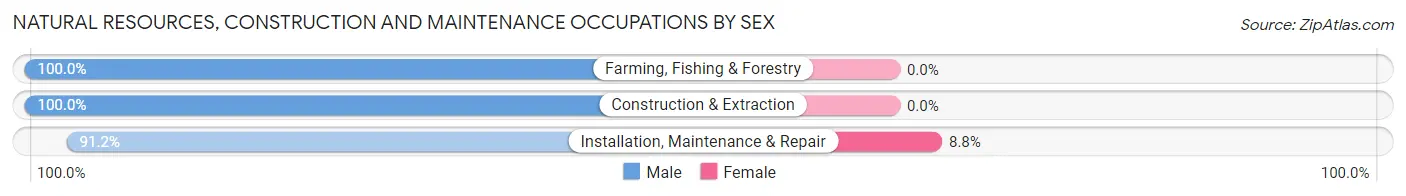
| Occupation | Male | Female |
| Farming, Fishing & Forestry | 27 (100.0%) | 0 (0.0%) |
| Construction & Extraction | 527 (100.0%) | 0 (0.0%) |
| Installation, Maintenance & Repair | 802 (91.2%) | 77 (8.8%) |
| Total (Category) | 1,356 (94.6%) | 77 (5.4%) |
| Total (Overall) | 10,304 (53.5%) | 8,951 (46.5%) |
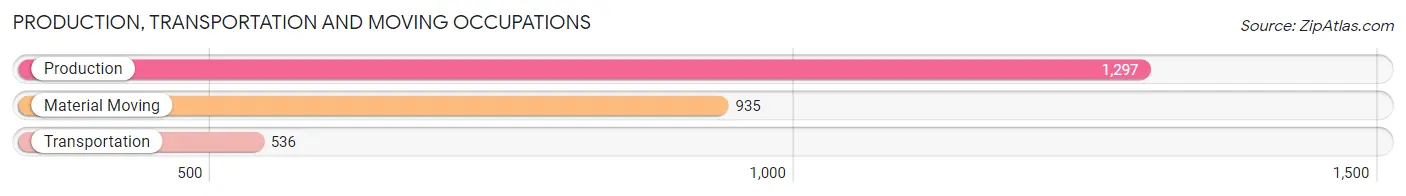
Production, Transportation and Moving Occupations
The most common Production, Transportation and Moving occupations in Owasso are Production (1,297 | 6.7%), Material Moving (935 | 4.9%), and Transportation (536 | 2.8%).
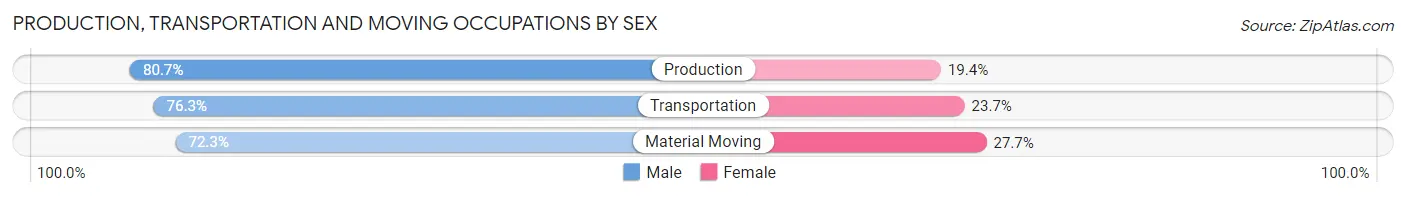
Production, Transportation and Moving Occupations by Sex
| Occupation | Male | Female |
| Production | 1,046 (80.6%) | 251 (19.4%) |
| Transportation | 409 (76.3%) | 127 (23.7%) |
| Material Moving | 676 (72.3%) | 259 (27.7%) |
| Total (Category) | 2,131 (77.0%) | 637 (23.0%) |
| Total (Overall) | 10,304 (53.5%) | 8,951 (46.5%) |
Employment Industries by Sex in Owasso
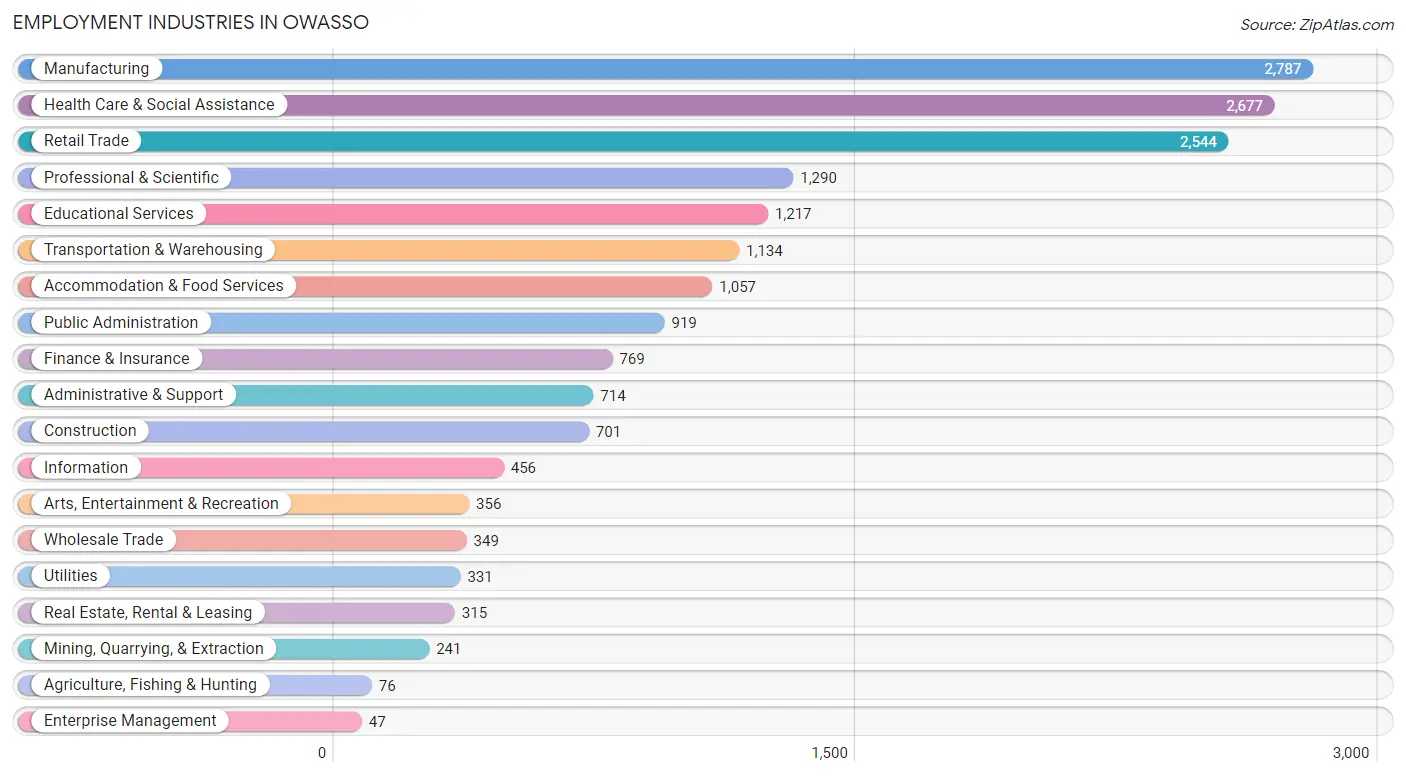
Employment Industries in Owasso
The major employment industries in Owasso include Manufacturing (2,787 | 14.5%), Health Care & Social Assistance (2,677 | 13.9%), Retail Trade (2,544 | 13.2%), Professional & Scientific (1,290 | 6.7%), and Educational Services (1,217 | 6.3%).
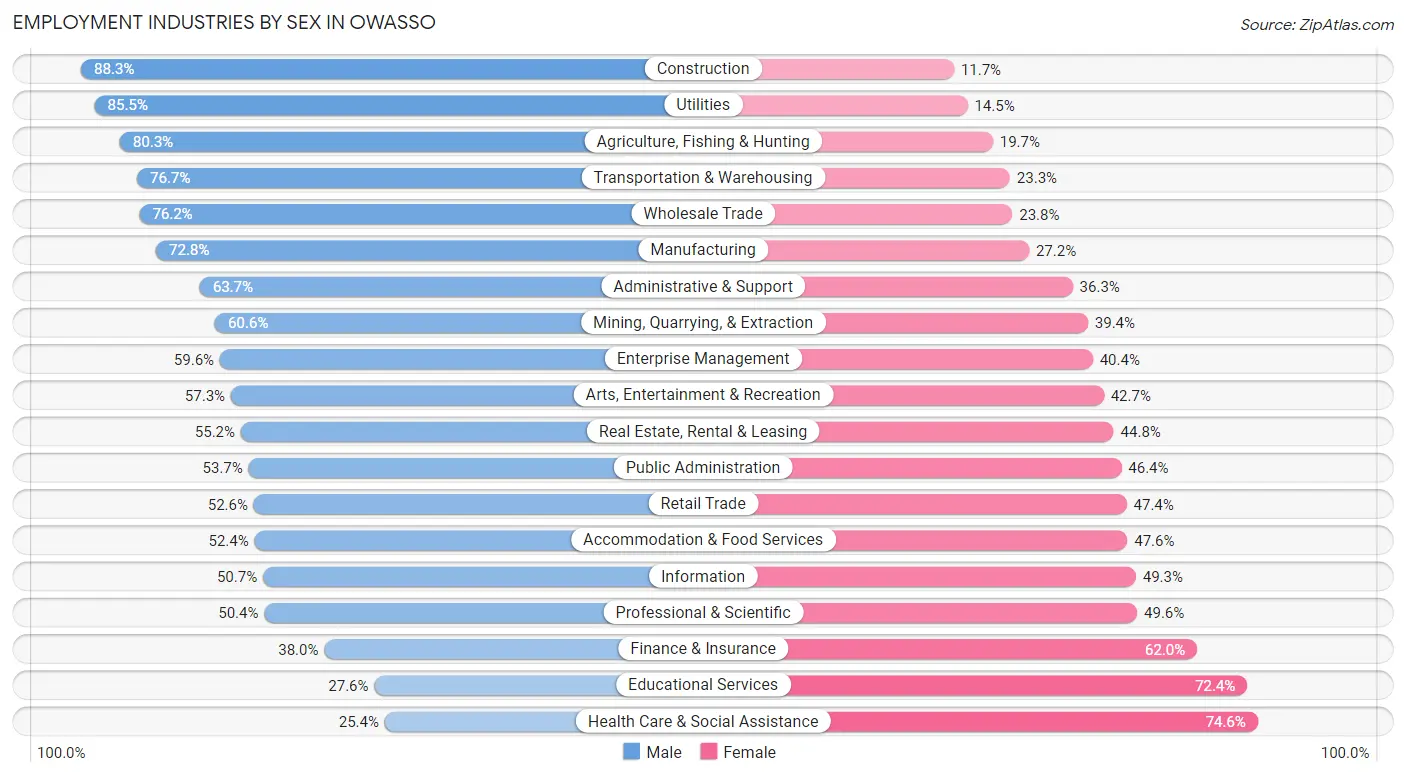
Employment Industries by Sex in Owasso
The Owasso industries that see more men than women are Construction (88.3%), Utilities (85.5%), and Agriculture, Fishing & Hunting (80.3%), whereas the industries that tend to have a higher number of women are Health Care & Social Assistance (74.6%), Educational Services (72.4%), and Finance & Insurance (62.0%).
| Industry | Male | Female |
| Agriculture, Fishing & Hunting | 61 (80.3%) | 15 (19.7%) |
| Mining, Quarrying, & Extraction | 146 (60.6%) | 95 (39.4%) |
| Construction | 619 (88.3%) | 82 (11.7%) |
| Manufacturing | 2,028 (72.8%) | 759 (27.2%) |
| Wholesale Trade | 266 (76.2%) | 83 (23.8%) |
| Retail Trade | 1,337 (52.6%) | 1,207 (47.4%) |
| Transportation & Warehousing | 870 (76.7%) | 264 (23.3%) |
| Utilities | 283 (85.5%) | 48 (14.5%) |
| Information | 231 (50.7%) | 225 (49.3%) |
| Finance & Insurance | 292 (38.0%) | 477 (62.0%) |
| Real Estate, Rental & Leasing | 174 (55.2%) | 141 (44.8%) |
| Professional & Scientific | 650 (50.4%) | 640 (49.6%) |
| Enterprise Management | 28 (59.6%) | 19 (40.4%) |
| Administrative & Support | 455 (63.7%) | 259 (36.3%) |
| Educational Services | 336 (27.6%) | 881 (72.4%) |
| Health Care & Social Assistance | 681 (25.4%) | 1,996 (74.6%) |
| Arts, Entertainment & Recreation | 204 (57.3%) | 152 (42.7%) |
| Accommodation & Food Services | 554 (52.4%) | 503 (47.6%) |
| Public Administration | 493 (53.6%) | 426 (46.4%) |
| Total | 10,304 (53.5%) | 8,951 (46.5%) |
Education in Owasso
School Enrollment in Owasso
The most common levels of schooling among the 10,606 students in Owasso are high school (2,592 | 24.4%), middle school (2,564 | 24.2%), and elementary school (1,935 | 18.2%).
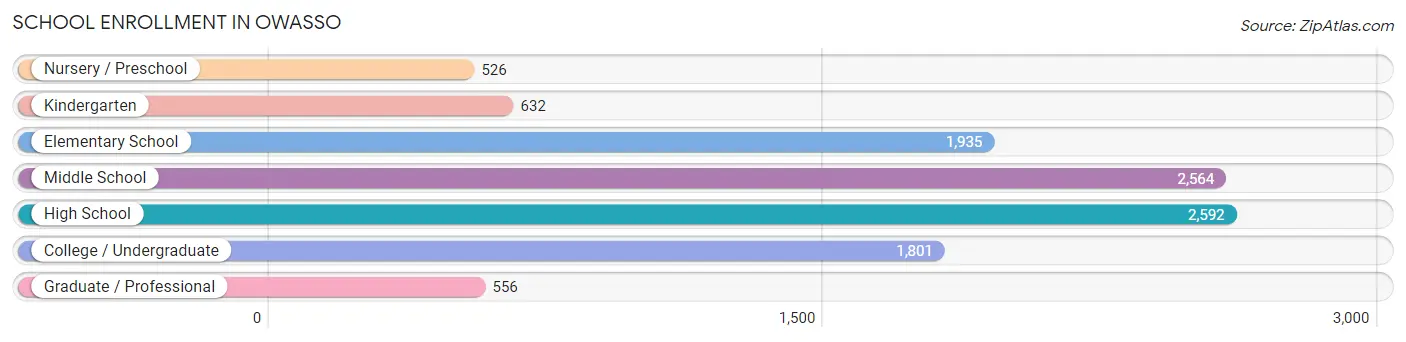
| School Level | # Students | % Students |
| Nursery / Preschool | 526 | 5.0% |
| Kindergarten | 632 | 6.0% |
| Elementary School | 1,935 | 18.2% |
| Middle School | 2,564 | 24.2% |
| High School | 2,592 | 24.4% |
| College / Undergraduate | 1,801 | 17.0% |
| Graduate / Professional | 556 | 5.2% |
| Total | 10,606 | 100.0% |
School Enrollment by Age by Funding Source in Owasso
Out of a total of 10,606 students who are enrolled in schools in Owasso, 1,495 (14.1%) attend a private institution, while the remaining 9,111 (85.9%) are enrolled in public schools. The age group of 3 to 4 year olds has the highest likelihood of being enrolled in private schools, with 277 (65.2% in the age bracket) enrolled. Conversely, the age group of 10 to 14 year olds has the lowest likelihood of being enrolled in a private school, with 2,770 (94.1% in the age bracket) attending a public institution.
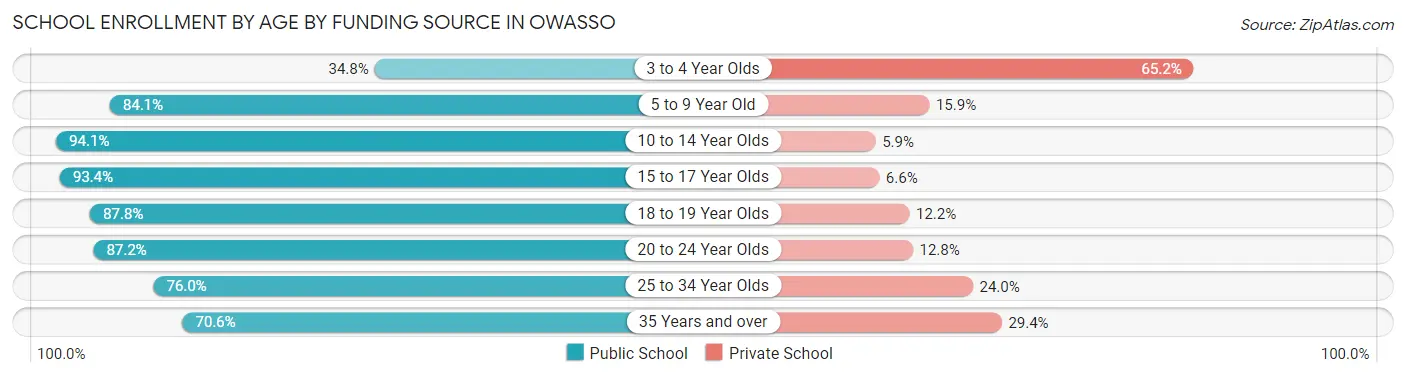
| Age Bracket | Public School | Private School |
| 3 to 4 Year Olds | 148 (34.8%) | 277 (65.2%) |
| 5 to 9 Year Old | 2,064 (84.1%) | 390 (15.9%) |
| 10 to 14 Year Olds | 2,770 (94.1%) | 173 (5.9%) |
| 15 to 17 Year Olds | 2,008 (93.4%) | 141 (6.6%) |
| 18 to 19 Year Olds | 483 (87.8%) | 67 (12.2%) |
| 20 to 24 Year Olds | 666 (87.2%) | 98 (12.8%) |
| 25 to 34 Year Olds | 497 (76.0%) | 157 (24.0%) |
| 35 Years and over | 471 (70.6%) | 196 (29.4%) |
| Total | 9,111 (85.9%) | 1,495 (14.1%) |
Educational Attainment by Field of Study in Owasso
Business (2,138 | 24.1%), education (1,187 | 13.4%), science & technology (979 | 11.0%), arts & humanities (792 | 8.9%), and engineering (683 | 7.7%) are the most common fields of study among 8,886 individuals in Owasso who have obtained a bachelor's degree or higher.
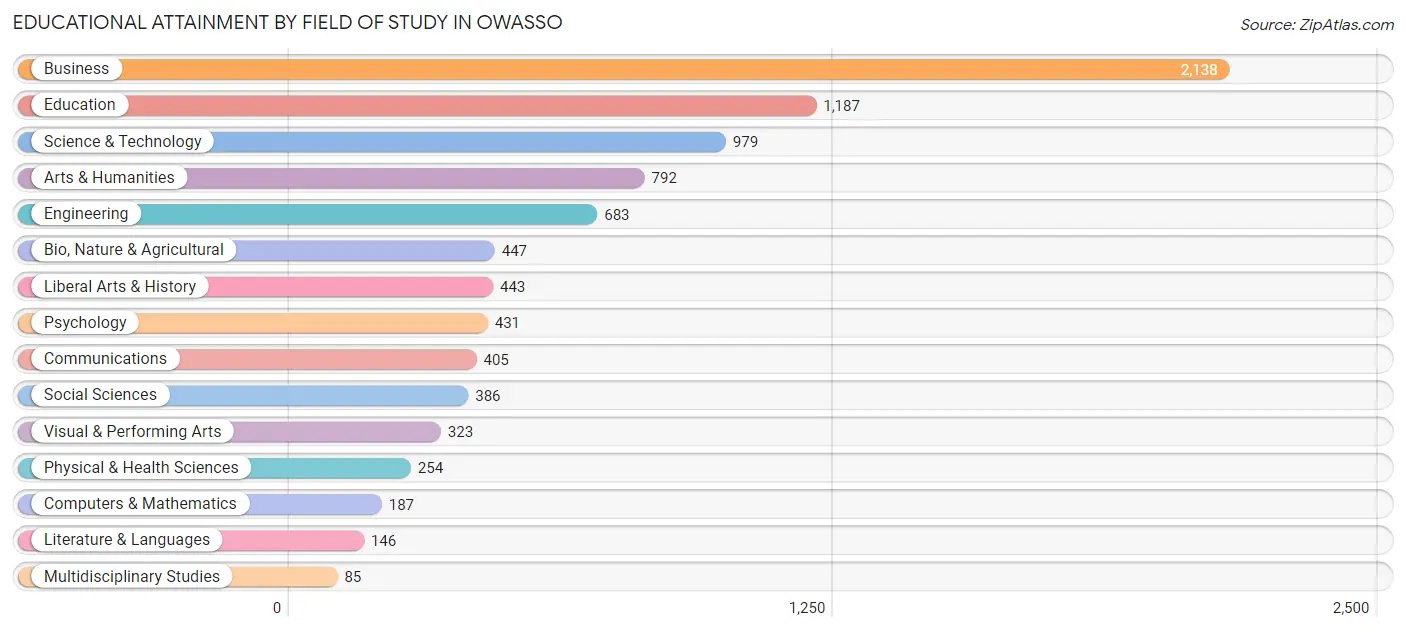
| Field of Study | # Graduates | % Graduates |
| Computers & Mathematics | 187 | 2.1% |
| Bio, Nature & Agricultural | 447 | 5.0% |
| Physical & Health Sciences | 254 | 2.9% |
| Psychology | 431 | 4.9% |
| Social Sciences | 386 | 4.3% |
| Engineering | 683 | 7.7% |
| Multidisciplinary Studies | 85 | 1.0% |
| Science & Technology | 979 | 11.0% |
| Business | 2,138 | 24.1% |
| Education | 1,187 | 13.4% |
| Literature & Languages | 146 | 1.6% |
| Liberal Arts & History | 443 | 5.0% |
| Visual & Performing Arts | 323 | 3.6% |
| Communications | 405 | 4.6% |
| Arts & Humanities | 792 | 8.9% |
| Total | 8,886 | 100.0% |
Transportation & Commute in Owasso
Vehicle Availability by Sex in Owasso
The most prevalent vehicle ownership categories in Owasso are males with 2 vehicles (5,171, accounting for 50.5%) and females with 2 vehicles (4,209, making up 58.7%).
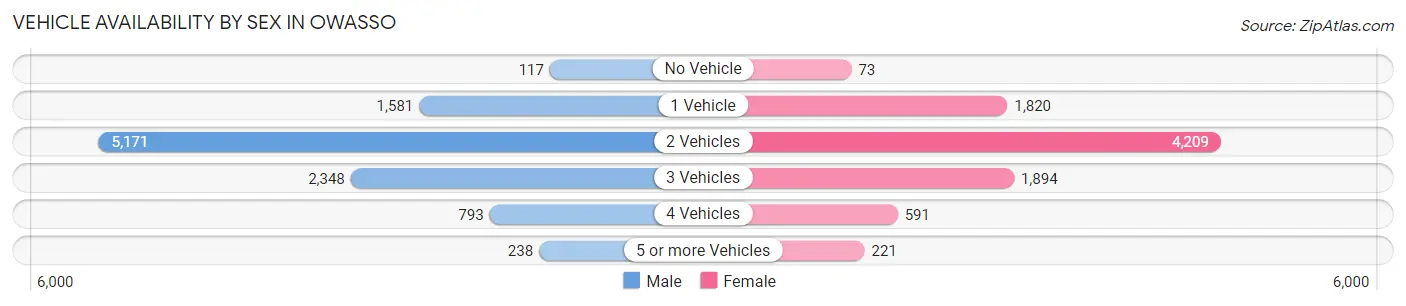
| Vehicles Available | Male | Female |
| No Vehicle | 117 (1.1%) | 73 (0.8%) |
| 1 Vehicle | 1,581 (15.4%) | 1,820 (20.7%) |
| 2 Vehicles | 5,171 (50.5%) | 4,209 (47.8%) |
| 3 Vehicles | 2,348 (22.9%) | 1,894 (21.5%) |
| 4 Vehicles | 793 (7.7%) | 591 (6.7%) |
| 5 or more Vehicles | 238 (2.3%) | 221 (2.5%) |
| Total | 10,248 (100.0%) | 8,808 (100.0%) |
Commute Time in Owasso
The most frequently occuring commute durations in Owasso are 20 to 24 minutes (3,432 commuters, 20.2%), 15 to 19 minutes (2,628 commuters, 15.4%), and 30 to 34 minutes (2,397 commuters, 14.1%).
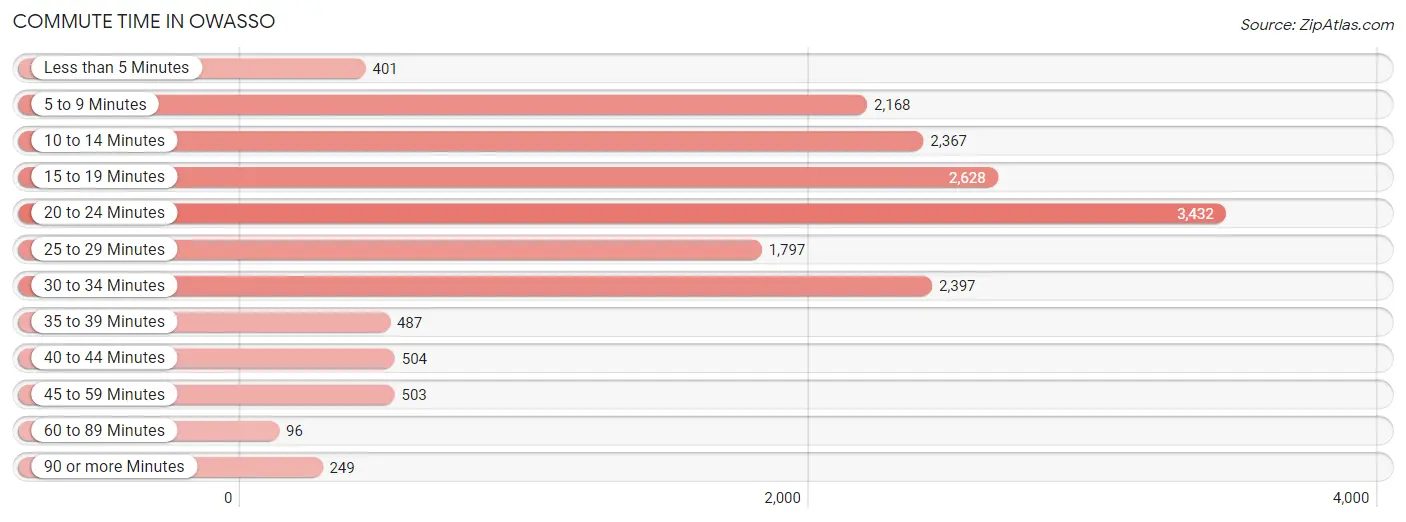
| Commute Time | # Commuters | % Commuters |
| Less than 5 Minutes | 401 | 2.4% |
| 5 to 9 Minutes | 2,168 | 12.7% |
| 10 to 14 Minutes | 2,367 | 13.9% |
| 15 to 19 Minutes | 2,628 | 15.4% |
| 20 to 24 Minutes | 3,432 | 20.2% |
| 25 to 29 Minutes | 1,797 | 10.5% |
| 30 to 34 Minutes | 2,397 | 14.1% |
| 35 to 39 Minutes | 487 | 2.9% |
| 40 to 44 Minutes | 504 | 3.0% |
| 45 to 59 Minutes | 503 | 2.9% |
| 60 to 89 Minutes | 96 | 0.6% |
| 90 or more Minutes | 249 | 1.5% |
Commute Time by Sex in Owasso
The most common commute times in Owasso are 20 to 24 minutes (1,882 commuters, 20.5%) for males and 20 to 24 minutes (1,550 commuters, 19.7%) for females.
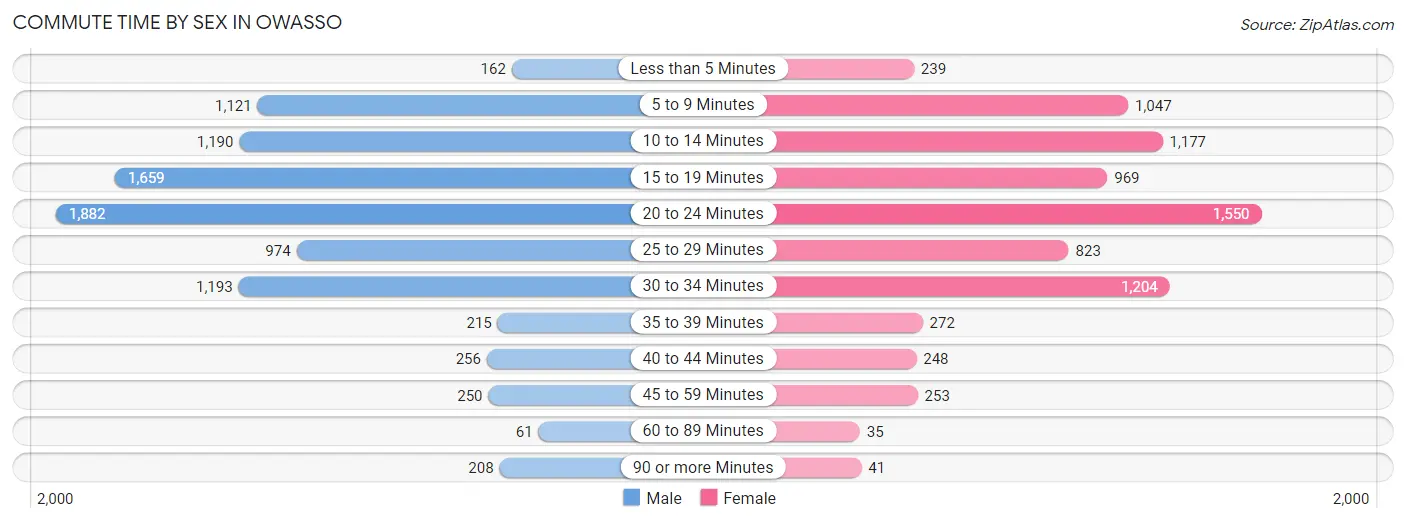
| Commute Time | Male | Female |
| Less than 5 Minutes | 162 (1.8%) | 239 (3.0%) |
| 5 to 9 Minutes | 1,121 (12.2%) | 1,047 (13.3%) |
| 10 to 14 Minutes | 1,190 (13.0%) | 1,177 (15.0%) |
| 15 to 19 Minutes | 1,659 (18.1%) | 969 (12.3%) |
| 20 to 24 Minutes | 1,882 (20.5%) | 1,550 (19.7%) |
| 25 to 29 Minutes | 974 (10.6%) | 823 (10.5%) |
| 30 to 34 Minutes | 1,193 (13.0%) | 1,204 (15.3%) |
| 35 to 39 Minutes | 215 (2.3%) | 272 (3.5%) |
| 40 to 44 Minutes | 256 (2.8%) | 248 (3.2%) |
| 45 to 59 Minutes | 250 (2.7%) | 253 (3.2%) |
| 60 to 89 Minutes | 61 (0.7%) | 35 (0.4%) |
| 90 or more Minutes | 208 (2.3%) | 41 (0.5%) |
Time of Departure to Work by Sex in Owasso
The most frequent times of departure to work in Owasso are 6:30 AM to 6:59 AM (1,330, 14.5%) for males and 7:00 AM to 7:29 AM (1,360, 17.3%) for females.
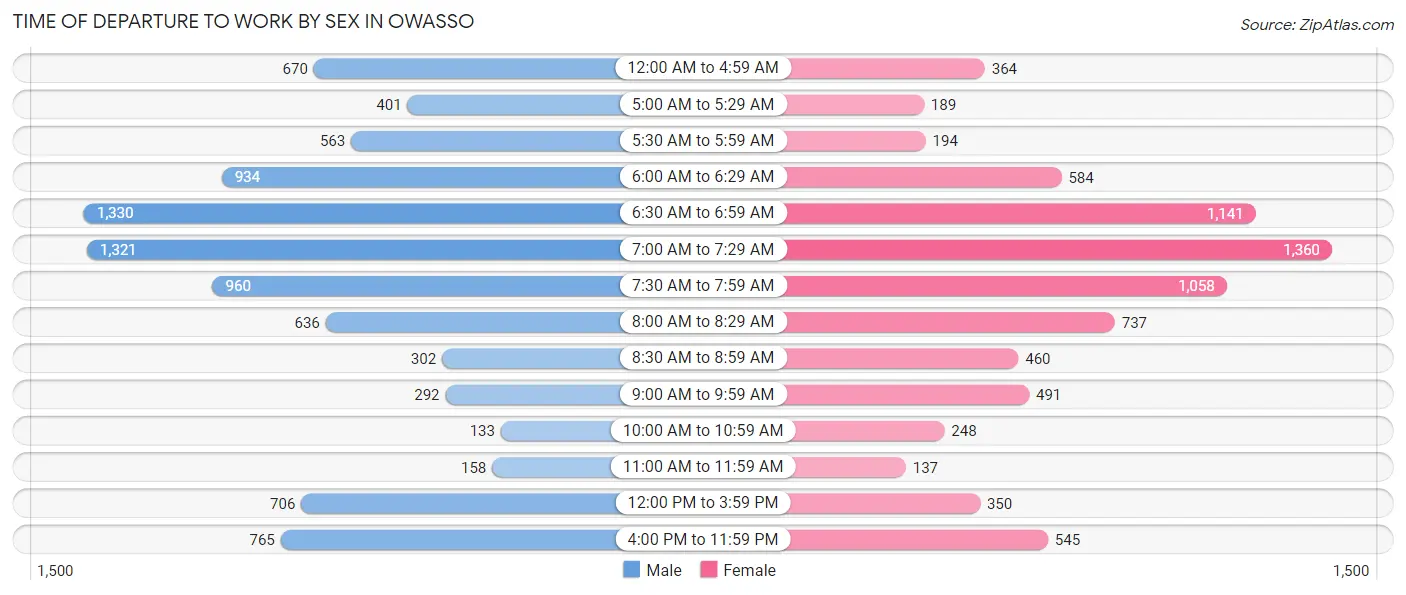
| Time of Departure | Male | Female |
| 12:00 AM to 4:59 AM | 670 (7.3%) | 364 (4.6%) |
| 5:00 AM to 5:29 AM | 401 (4.4%) | 189 (2.4%) |
| 5:30 AM to 5:59 AM | 563 (6.1%) | 194 (2.5%) |
| 6:00 AM to 6:29 AM | 934 (10.2%) | 584 (7.4%) |
| 6:30 AM to 6:59 AM | 1,330 (14.5%) | 1,141 (14.5%) |
| 7:00 AM to 7:29 AM | 1,321 (14.4%) | 1,360 (17.3%) |
| 7:30 AM to 7:59 AM | 960 (10.5%) | 1,058 (13.5%) |
| 8:00 AM to 8:29 AM | 636 (6.9%) | 737 (9.4%) |
| 8:30 AM to 8:59 AM | 302 (3.3%) | 460 (5.9%) |
| 9:00 AM to 9:59 AM | 292 (3.2%) | 491 (6.2%) |
| 10:00 AM to 10:59 AM | 133 (1.5%) | 248 (3.2%) |
| 11:00 AM to 11:59 AM | 158 (1.7%) | 137 (1.7%) |
| 12:00 PM to 3:59 PM | 706 (7.7%) | 350 (4.4%) |
| 4:00 PM to 11:59 PM | 765 (8.3%) | 545 (6.9%) |
| Total | 9,171 (100.0%) | 7,858 (100.0%) |
Housing Occupancy in Owasso
Occupancy by Ownership in Owasso
Of the total 14,230 dwellings in Owasso, owner-occupied units account for 9,181 (64.5%), while renter-occupied units make up 5,049 (35.5%).
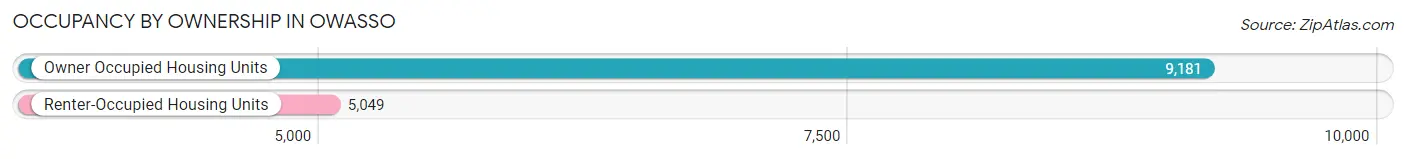
| Occupancy | # Housing Units | % Housing Units |
| Owner Occupied Housing Units | 9,181 | 64.5% |
| Renter-Occupied Housing Units | 5,049 | 35.5% |
| Total Occupied Housing Units | 14,230 | 100.0% |
Occupancy by Household Size in Owasso
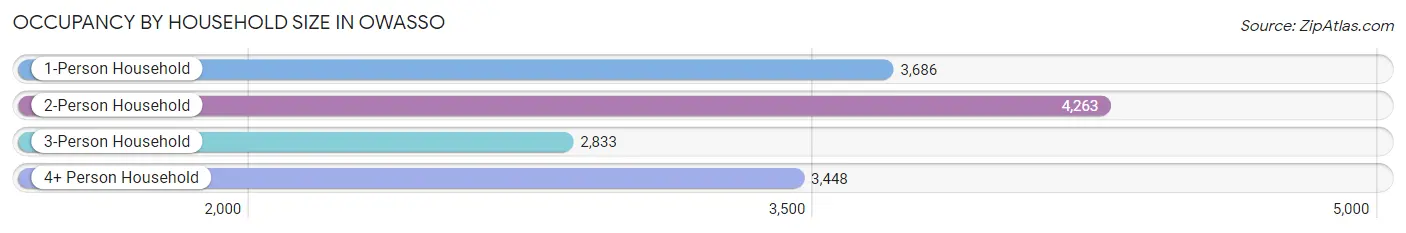
| Household Size | # Housing Units | % Housing Units |
| 1-Person Household | 3,686 | 25.9% |
| 2-Person Household | 4,263 | 30.0% |
| 3-Person Household | 2,833 | 19.9% |
| 4+ Person Household | 3,448 | 24.2% |
| Total Housing Units | 14,230 | 100.0% |
Occupancy by Ownership by Household Size in Owasso
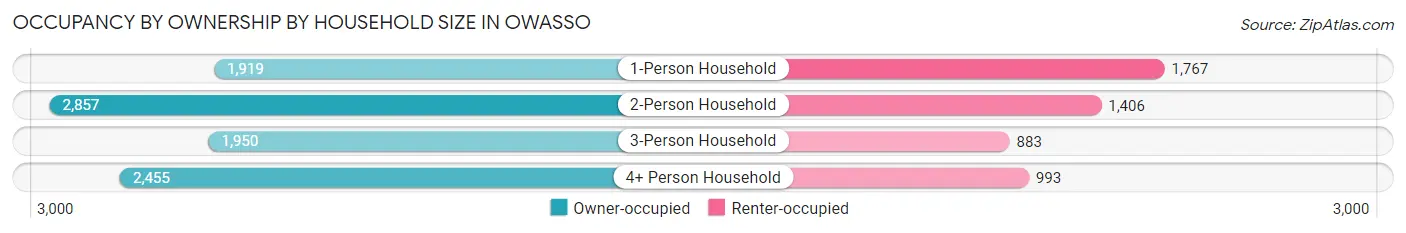
| Household Size | Owner-occupied | Renter-occupied |
| 1-Person Household | 1,919 (52.1%) | 1,767 (47.9%) |
| 2-Person Household | 2,857 (67.0%) | 1,406 (33.0%) |
| 3-Person Household | 1,950 (68.8%) | 883 (31.2%) |
| 4+ Person Household | 2,455 (71.2%) | 993 (28.8%) |
| Total Housing Units | 9,181 (64.5%) | 5,049 (35.5%) |
Occupancy by Educational Attainment in Owasso
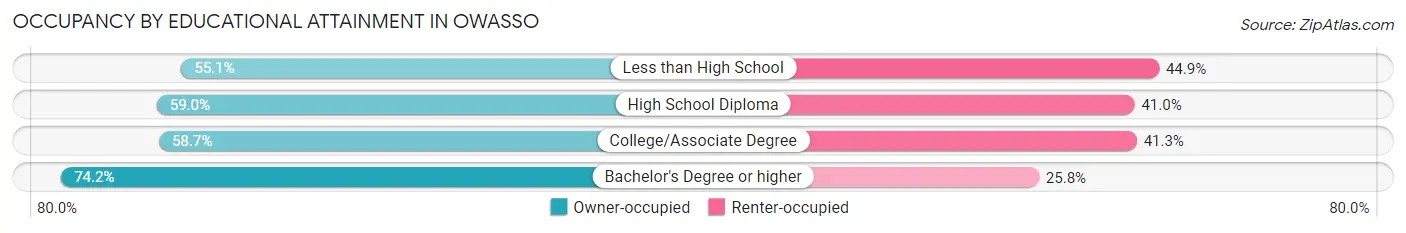
| Household Size | Owner-occupied | Renter-occupied |
| Less than High School | 370 (55.1%) | 301 (44.9%) |
| High School Diploma | 1,739 (59.0%) | 1,207 (41.0%) |
| College/Associate Degree | 3,034 (58.7%) | 2,136 (41.3%) |
| Bachelor's Degree or higher | 4,038 (74.2%) | 1,405 (25.8%) |
Occupancy by Age of Householder in Owasso
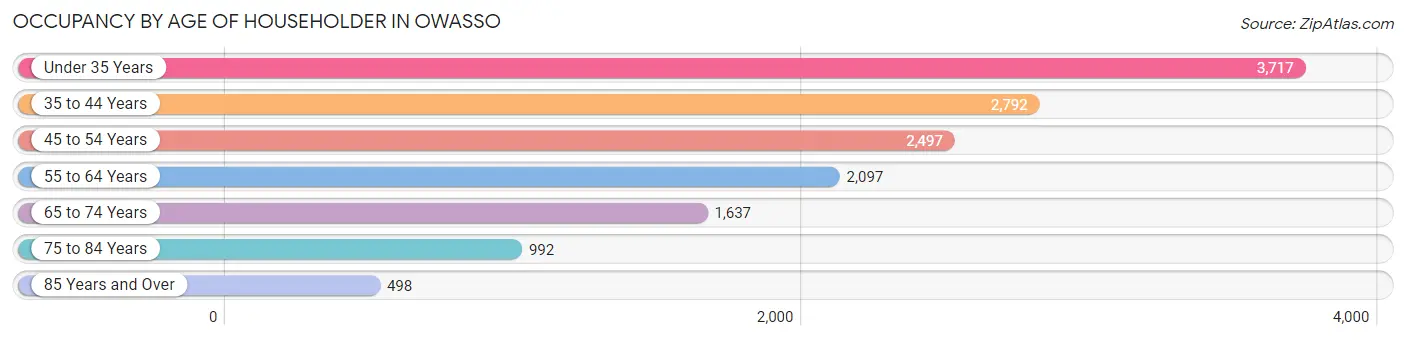
| Age Bracket | # Households | % Households |
| Under 35 Years | 3,717 | 26.1% |
| 35 to 44 Years | 2,792 | 19.6% |
| 45 to 54 Years | 2,497 | 17.5% |
| 55 to 64 Years | 2,097 | 14.7% |
| 65 to 74 Years | 1,637 | 11.5% |
| 75 to 84 Years | 992 | 7.0% |
| 85 Years and Over | 498 | 3.5% |
| Total | 14,230 | 100.0% |
Housing Finances in Owasso
Median Income by Occupancy in Owasso
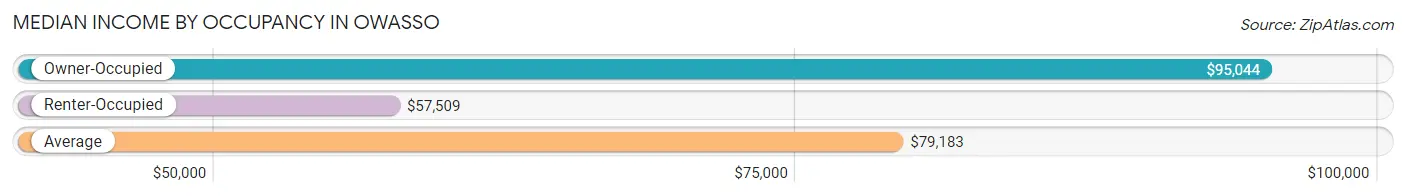
| Occupancy Type | # Households | Median Income |
| Owner-Occupied | 9,181 (64.5%) | $95,044 |
| Renter-Occupied | 5,049 (35.5%) | $57,509 |
| Average | 14,230 (100.0%) | $79,183 |
Occupancy by Householder Income Bracket in Owasso
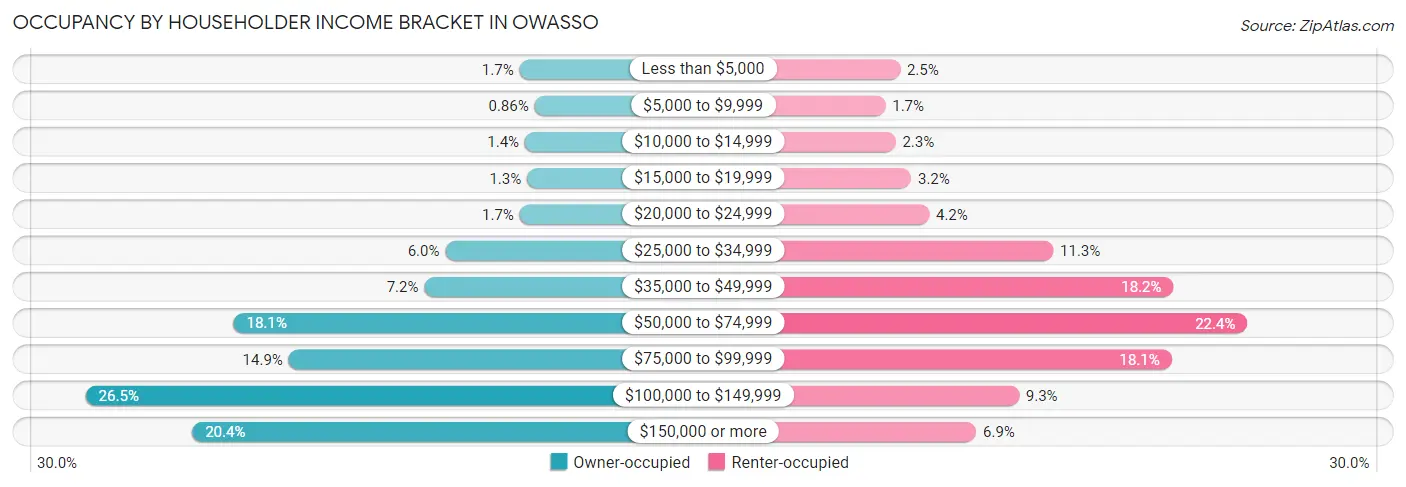
| Income Bracket | Owner-occupied | Renter-occupied |
| Less than $5,000 | 158 (1.7%) | 128 (2.5%) |
| $5,000 to $9,999 | 79 (0.9%) | 86 (1.7%) |
| $10,000 to $14,999 | 129 (1.4%) | 115 (2.3%) |
| $15,000 to $19,999 | 118 (1.3%) | 160 (3.2%) |
| $20,000 to $24,999 | 157 (1.7%) | 212 (4.2%) |
| $25,000 to $34,999 | 547 (6.0%) | 570 (11.3%) |
| $35,000 to $49,999 | 657 (7.2%) | 917 (18.2%) |
| $50,000 to $74,999 | 1,658 (18.1%) | 1,130 (22.4%) |
| $75,000 to $99,999 | 1,369 (14.9%) | 912 (18.1%) |
| $100,000 to $149,999 | 2,434 (26.5%) | 471 (9.3%) |
| $150,000 or more | 1,875 (20.4%) | 348 (6.9%) |
| Total | 9,181 (100.0%) | 5,049 (100.0%) |
Monthly Housing Cost Tiers in Owasso
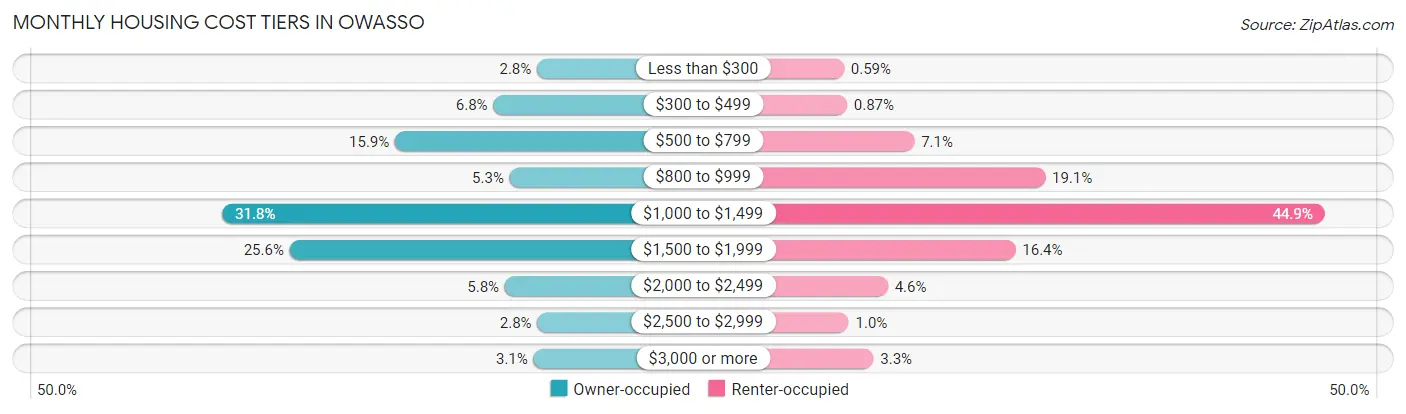
| Monthly Cost | Owner-occupied | Renter-occupied |
| Less than $300 | 259 (2.8%) | 30 (0.6%) |
| $300 to $499 | 628 (6.8%) | 44 (0.9%) |
| $500 to $799 | 1,459 (15.9%) | 357 (7.1%) |
| $800 to $999 | 490 (5.3%) | 965 (19.1%) |
| $1,000 to $1,499 | 2,921 (31.8%) | 2,265 (44.9%) |
| $1,500 to $1,999 | 2,349 (25.6%) | 827 (16.4%) |
| $2,000 to $2,499 | 531 (5.8%) | 234 (4.6%) |
| $2,500 to $2,999 | 256 (2.8%) | 52 (1.0%) |
| $3,000 or more | 288 (3.1%) | 167 (3.3%) |
| Total | 9,181 (100.0%) | 5,049 (100.0%) |
Physical Housing Characteristics in Owasso
Housing Structures in Owasso
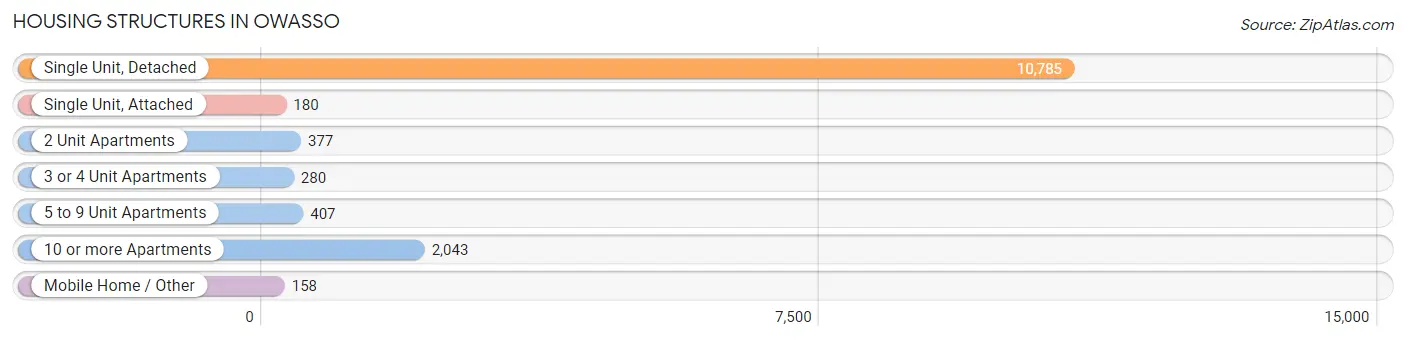
| Structure Type | # Housing Units | % Housing Units |
| Single Unit, Detached | 10,785 | 75.8% |
| Single Unit, Attached | 180 | 1.3% |
| 2 Unit Apartments | 377 | 2.6% |
| 3 or 4 Unit Apartments | 280 | 2.0% |
| 5 to 9 Unit Apartments | 407 | 2.9% |
| 10 or more Apartments | 2,043 | 14.4% |
| Mobile Home / Other | 158 | 1.1% |
| Total | 14,230 | 100.0% |
Housing Structures by Occupancy in Owasso
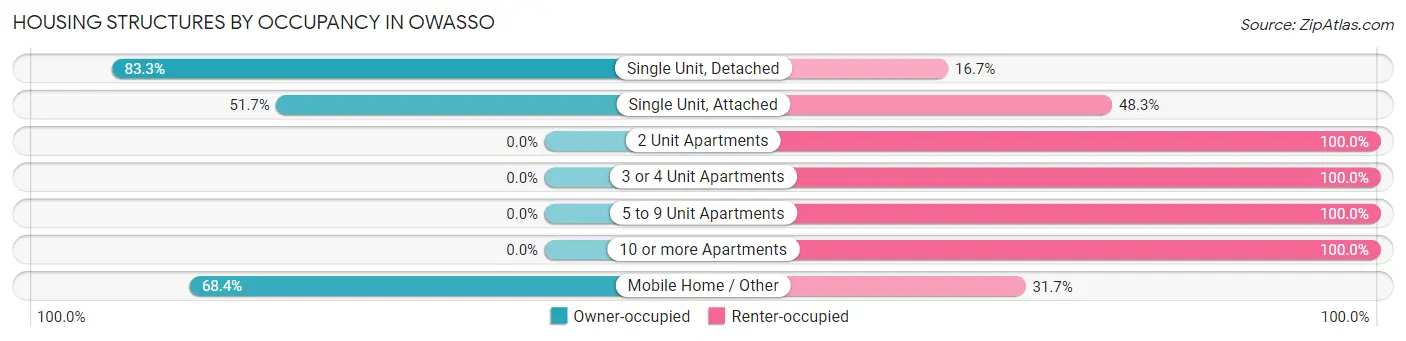
| Structure Type | Owner-occupied | Renter-occupied |
| Single Unit, Detached | 8,980 (83.3%) | 1,805 (16.7%) |
| Single Unit, Attached | 93 (51.7%) | 87 (48.3%) |
| 2 Unit Apartments | 0 (0.0%) | 377 (100.0%) |
| 3 or 4 Unit Apartments | 0 (0.0%) | 280 (100.0%) |
| 5 to 9 Unit Apartments | 0 (0.0%) | 407 (100.0%) |
| 10 or more Apartments | 0 (0.0%) | 2,043 (100.0%) |
| Mobile Home / Other | 108 (68.3%) | 50 (31.7%) |
| Total | 9,181 (64.5%) | 5,049 (35.5%) |
Housing Structures by Number of Rooms in Owasso
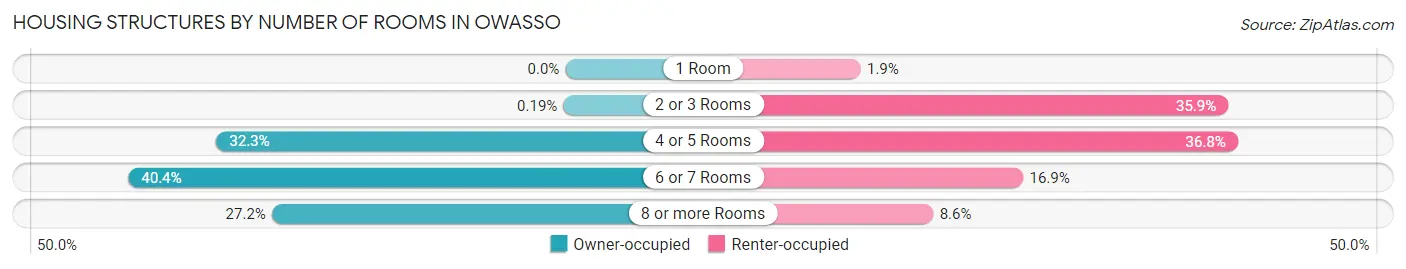
| Number of Rooms | Owner-occupied | Renter-occupied |
| 1 Room | 0 (0.0%) | 94 (1.9%) |
| 2 or 3 Rooms | 17 (0.2%) | 1,812 (35.9%) |
| 4 or 5 Rooms | 2,962 (32.3%) | 1,857 (36.8%) |
| 6 or 7 Rooms | 3,709 (40.4%) | 853 (16.9%) |
| 8 or more Rooms | 2,493 (27.2%) | 433 (8.6%) |
| Total | 9,181 (100.0%) | 5,049 (100.0%) |
Housing Structure by Heating Type in Owasso
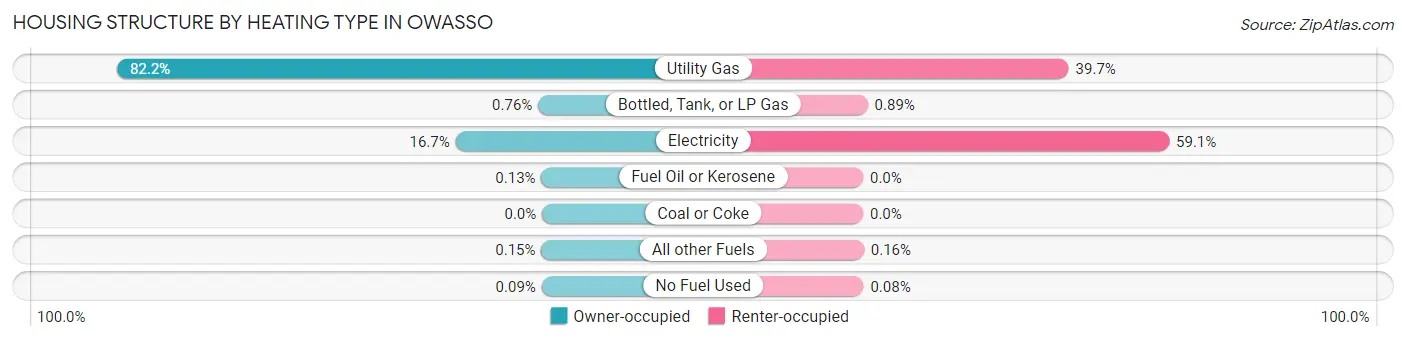
| Heating Type | Owner-occupied | Renter-occupied |
| Utility Gas | 7,542 (82.2%) | 2,006 (39.7%) |
| Bottled, Tank, or LP Gas | 70 (0.8%) | 45 (0.9%) |
| Electricity | 1,535 (16.7%) | 2,986 (59.1%) |
| Fuel Oil or Kerosene | 12 (0.1%) | 0 (0.0%) |
| Coal or Coke | 0 (0.0%) | 0 (0.0%) |
| All other Fuels | 14 (0.2%) | 8 (0.2%) |
| No Fuel Used | 8 (0.1%) | 4 (0.1%) |
| Total | 9,181 (100.0%) | 5,049 (100.0%) |
Household Vehicle Usage in Owasso
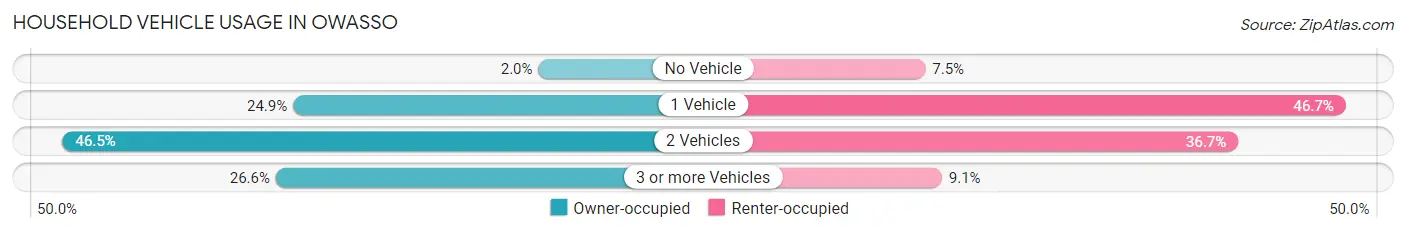
| Vehicles per Household | Owner-occupied | Renter-occupied |
| No Vehicle | 187 (2.0%) | 379 (7.5%) |
| 1 Vehicle | 2,290 (24.9%) | 2,360 (46.7%) |
| 2 Vehicles | 4,266 (46.5%) | 1,853 (36.7%) |
| 3 or more Vehicles | 2,438 (26.6%) | 457 (9.0%) |
| Total | 9,181 (100.0%) | 5,049 (100.0%) |
Real Estate & Mortgages in Owasso
Real Estate and Mortgage Overview in Owasso
| Characteristic | Without Mortgage | With Mortgage |
| Housing Units | 2,513 | 6,668 |
| Median Property Value | $223,600 | $216,400 |
| Median Household Income | $58,943 | $1,575 |
| Monthly Housing Costs | $557 | $288 |
| Real Estate Taxes | $2,077 | $327 |
Property Value by Mortgage Status in Owasso
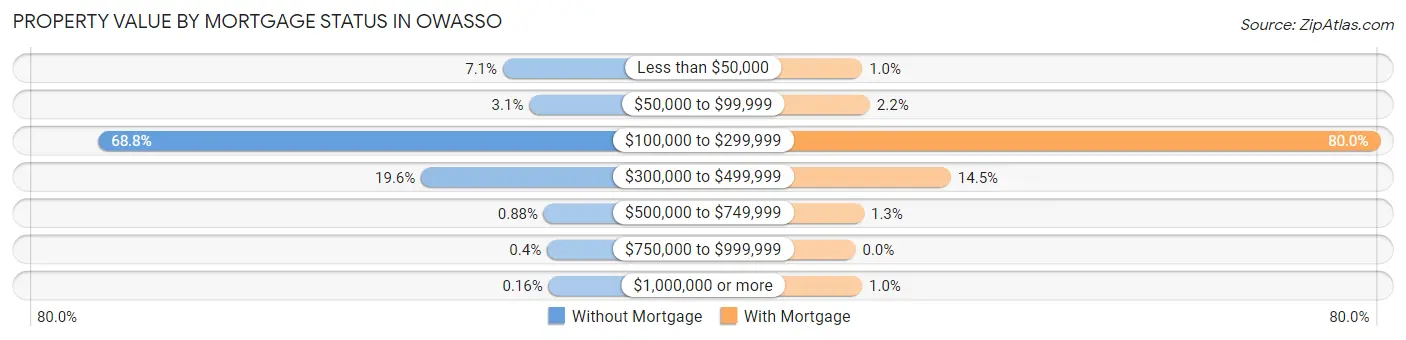
| Property Value | Without Mortgage | With Mortgage |
| Less than $50,000 | 179 (7.1%) | 68 (1.0%) |
| $50,000 to $99,999 | 78 (3.1%) | 146 (2.2%) |
| $100,000 to $299,999 | 1,728 (68.8%) | 5,332 (80.0%) |
| $300,000 to $499,999 | 492 (19.6%) | 969 (14.5%) |
| $500,000 to $749,999 | 22 (0.9%) | 86 (1.3%) |
| $750,000 to $999,999 | 10 (0.4%) | 0 (0.0%) |
| $1,000,000 or more | 4 (0.2%) | 67 (1.0%) |
| Total | 2,513 (100.0%) | 6,668 (100.0%) |
Household Income by Mortgage Status in Owasso
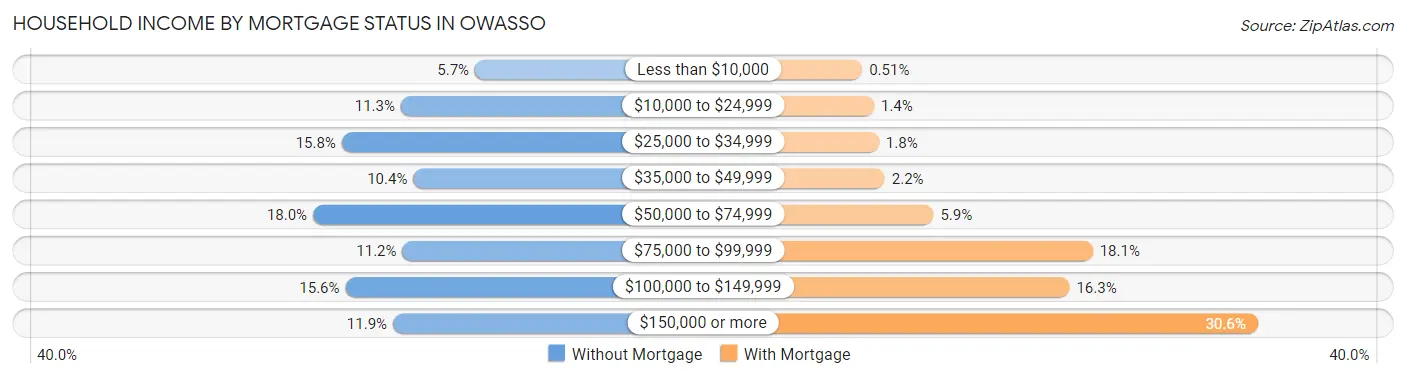
| Household Income | Without Mortgage | With Mortgage |
| Less than $10,000 | 143 (5.7%) | 34 (0.5%) |
| $10,000 to $24,999 | 285 (11.3%) | 94 (1.4%) |
| $25,000 to $34,999 | 398 (15.8%) | 119 (1.8%) |
| $35,000 to $49,999 | 261 (10.4%) | 149 (2.2%) |
| $50,000 to $74,999 | 453 (18.0%) | 396 (5.9%) |
| $75,000 to $99,999 | 282 (11.2%) | 1,205 (18.1%) |
| $100,000 to $149,999 | 391 (15.6%) | 1,087 (16.3%) |
| $150,000 or more | 300 (11.9%) | 2,043 (30.6%) |
| Total | 2,513 (100.0%) | 6,668 (100.0%) |
Property Value to Household Income Ratio in Owasso
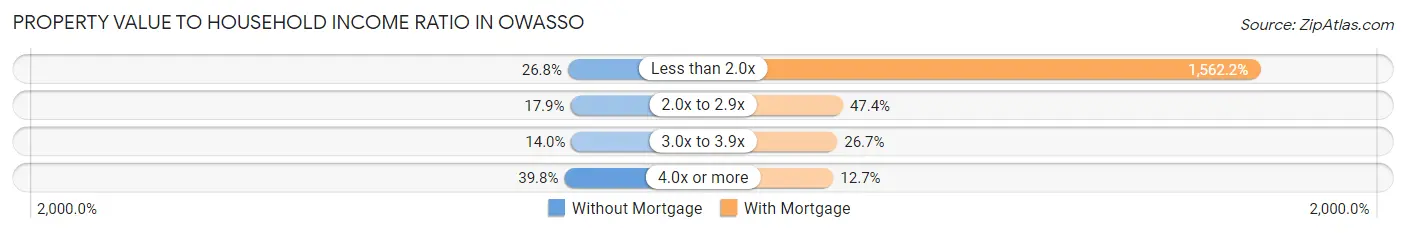
| Value-to-Income Ratio | Without Mortgage | With Mortgage |
| Less than 2.0x | 674 (26.8%) | 104,167 (1,562.2%) |
| 2.0x to 2.9x | 450 (17.9%) | 3,157 (47.3%) |
| 3.0x to 3.9x | 352 (14.0%) | 1,779 (26.7%) |
| 4.0x or more | 999 (39.8%) | 845 (12.7%) |
| Total | 2,513 (100.0%) | 6,668 (100.0%) |
Real Estate Taxes by Mortgage Status in Owasso
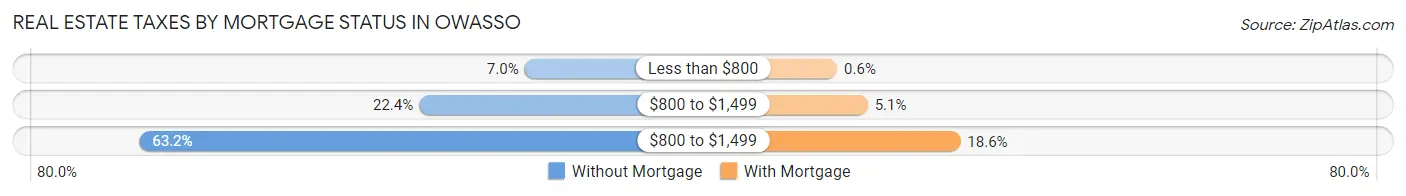
| Property Taxes | Without Mortgage | With Mortgage |
| Less than $800 | 175 (7.0%) | 40 (0.6%) |
| $800 to $1,499 | 562 (22.4%) | 338 (5.1%) |
| $800 to $1,499 | 1,589 (63.2%) | 1,241 (18.6%) |
| Total | 2,513 (100.0%) | 6,668 (100.0%) |
Health & Disability in Owasso
Health Insurance Coverage by Age in Owasso
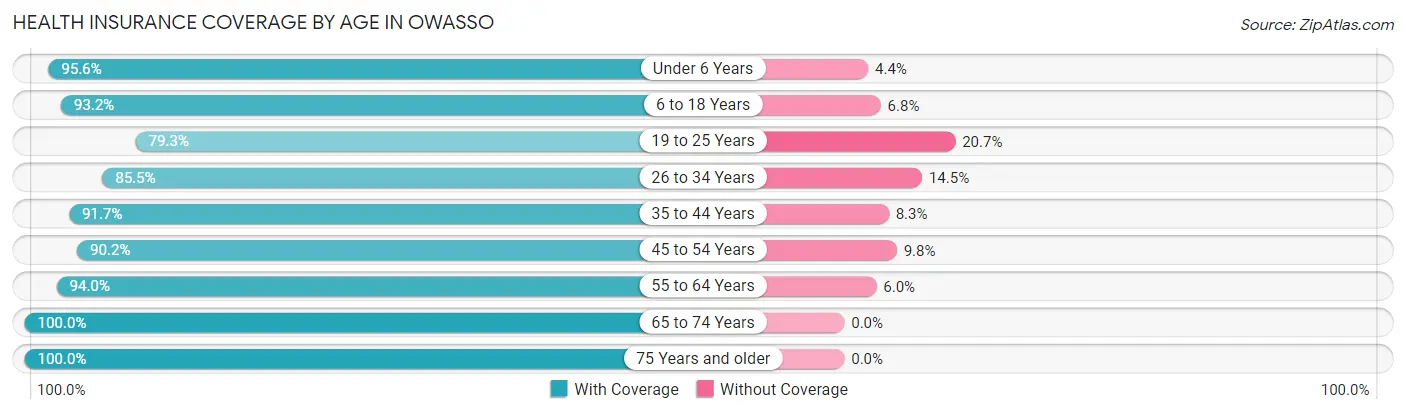
| Age Bracket | With Coverage | Without Coverage |
| Under 6 Years | 3,101 (95.6%) | 144 (4.4%) |
| 6 to 18 Years | 7,180 (93.2%) | 522 (6.8%) |
| 19 to 25 Years | 2,983 (79.3%) | 778 (20.7%) |
| 26 to 34 Years | 4,513 (85.5%) | 765 (14.5%) |
| 35 to 44 Years | 4,609 (91.7%) | 416 (8.3%) |
| 45 to 54 Years | 4,031 (90.2%) | 437 (9.8%) |
| 55 to 64 Years | 3,545 (94.0%) | 225 (6.0%) |
| 65 to 74 Years | 2,491 (100.0%) | 0 (0.0%) |
| 75 Years and older | 2,034 (100.0%) | 0 (0.0%) |
| Total | 34,487 (91.3%) | 3,287 (8.7%) |
Health Insurance Coverage by Citizenship Status in Owasso
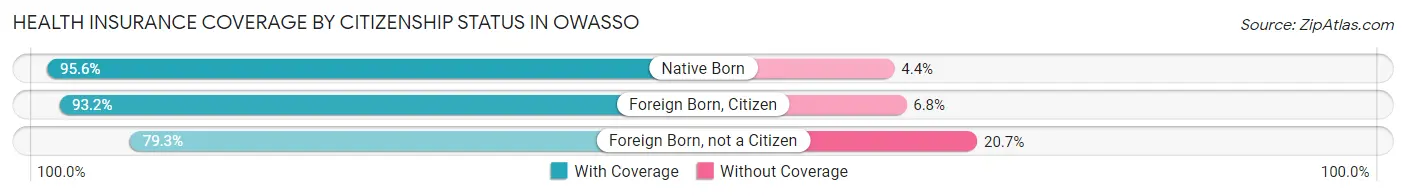
| Citizenship Status | With Coverage | Without Coverage |
| Native Born | 3,101 (95.6%) | 144 (4.4%) |
| Foreign Born, Citizen | 7,180 (93.2%) | 522 (6.8%) |
| Foreign Born, not a Citizen | 2,983 (79.3%) | 778 (20.7%) |
Health Insurance Coverage by Household Income in Owasso
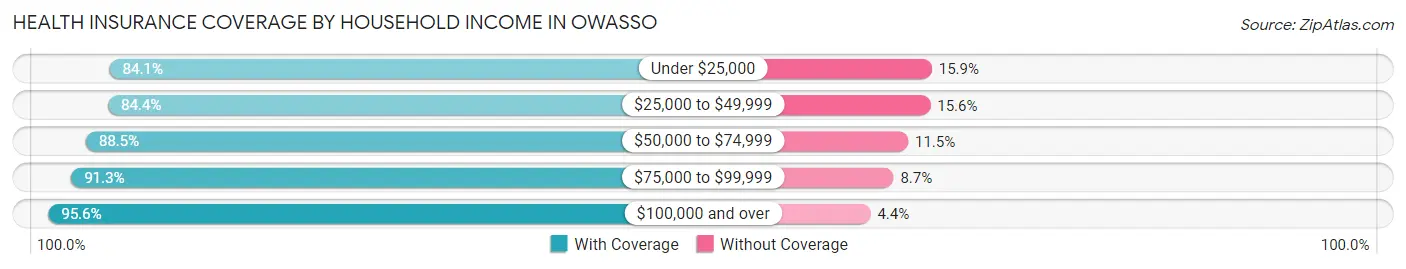
| Household Income | With Coverage | Without Coverage |
| Under $25,000 | 1,900 (84.1%) | 360 (15.9%) |
| $25,000 to $49,999 | 4,471 (84.4%) | 829 (15.6%) |
| $50,000 to $74,999 | 5,912 (88.5%) | 766 (11.5%) |
| $75,000 to $99,999 | 5,954 (91.3%) | 570 (8.7%) |
| $100,000 and over | 16,228 (95.6%) | 754 (4.4%) |
Public vs Private Health Insurance Coverage by Age in Owasso
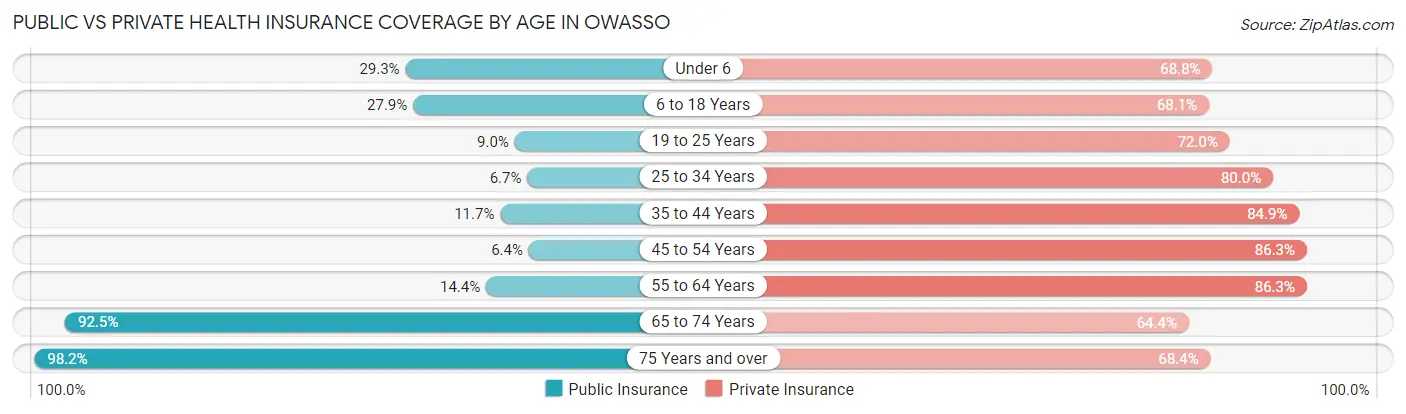
| Age Bracket | Public Insurance | Private Insurance |
| Under 6 | 951 (29.3%) | 2,232 (68.8%) |
| 6 to 18 Years | 2,148 (27.9%) | 5,248 (68.1%) |
| 19 to 25 Years | 340 (9.0%) | 2,708 (72.0%) |
| 25 to 34 Years | 353 (6.7%) | 4,224 (80.0%) |
| 35 to 44 Years | 589 (11.7%) | 4,266 (84.9%) |
| 45 to 54 Years | 287 (6.4%) | 3,857 (86.3%) |
| 55 to 64 Years | 541 (14.3%) | 3,254 (86.3%) |
| 65 to 74 Years | 2,304 (92.5%) | 1,604 (64.4%) |
| 75 Years and over | 1,997 (98.2%) | 1,392 (68.4%) |
| Total | 9,510 (25.2%) | 28,785 (76.2%) |
Disability Status by Sex by Age in Owasso
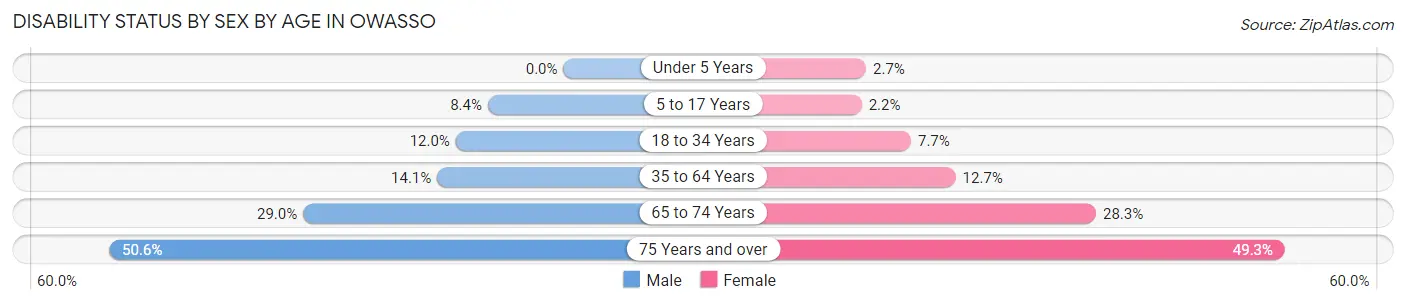
| Age Bracket | Male | Female |
| Under 5 Years | 0 (0.0%) | 35 (2.7%) |
| 5 to 17 Years | 386 (8.4%) | 72 (2.2%) |
| 18 to 34 Years | 602 (12.0%) | 346 (7.7%) |
| 35 to 64 Years | 902 (14.1%) | 868 (12.7%) |
| 65 to 74 Years | 323 (29.0%) | 390 (28.3%) |
| 75 Years and over | 259 (50.6%) | 751 (49.3%) |
Disability Class by Sex by Age in Owasso
Disability Class: Hearing Difficulty
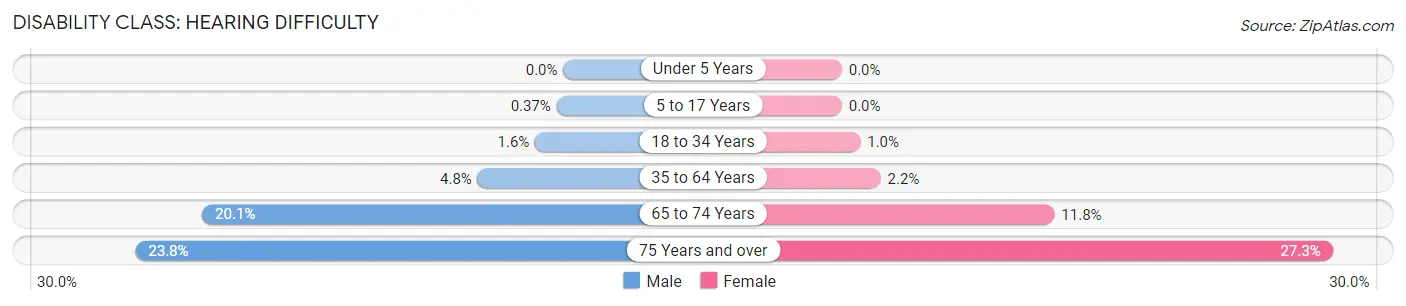
| Age Bracket | Male | Female |
| Under 5 Years | 0 (0.0%) | 0 (0.0%) |
| 5 to 17 Years | 17 (0.4%) | 0 (0.0%) |
| 18 to 34 Years | 79 (1.6%) | 46 (1.0%) |
| 35 to 64 Years | 306 (4.8%) | 148 (2.2%) |
| 65 to 74 Years | 224 (20.1%) | 163 (11.8%) |
| 75 Years and over | 122 (23.8%) | 416 (27.3%) |
Disability Class: Vision Difficulty
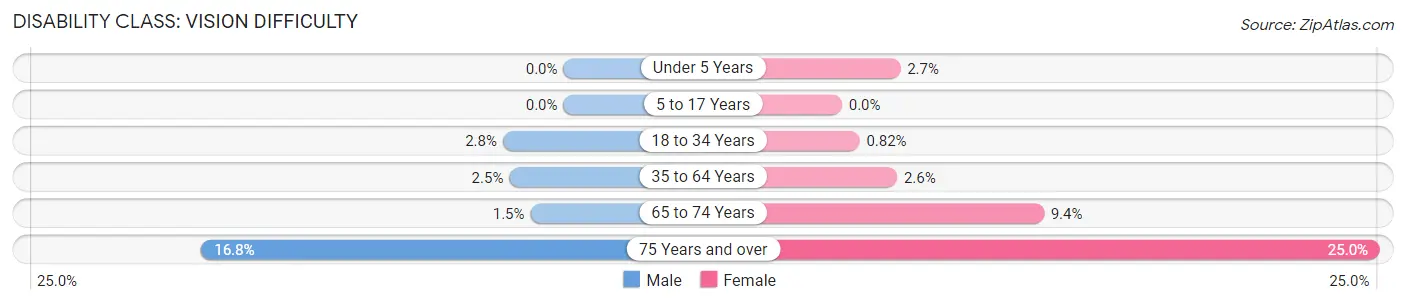
| Age Bracket | Male | Female |
| Under 5 Years | 0 (0.0%) | 35 (2.7%) |
| 5 to 17 Years | 0 (0.0%) | 0 (0.0%) |
| 18 to 34 Years | 141 (2.8%) | 37 (0.8%) |
| 35 to 64 Years | 161 (2.5%) | 175 (2.6%) |
| 65 to 74 Years | 17 (1.5%) | 129 (9.4%) |
| 75 Years and over | 86 (16.8%) | 380 (25.0%) |
Disability Class: Cognitive Difficulty
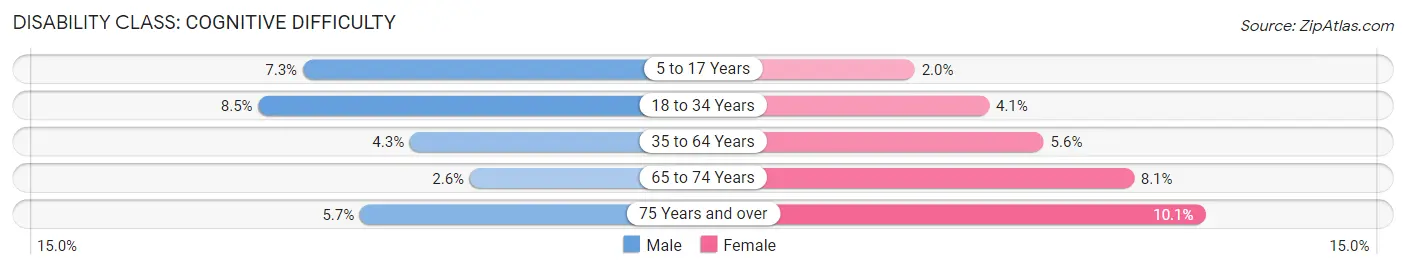
| Age Bracket | Male | Female |
| 5 to 17 Years | 333 (7.2%) | 66 (2.0%) |
| 18 to 34 Years | 426 (8.5%) | 184 (4.1%) |
| 35 to 64 Years | 274 (4.3%) | 385 (5.6%) |
| 65 to 74 Years | 29 (2.6%) | 112 (8.1%) |
| 75 Years and over | 29 (5.7%) | 154 (10.1%) |
Disability Class: Ambulatory Difficulty
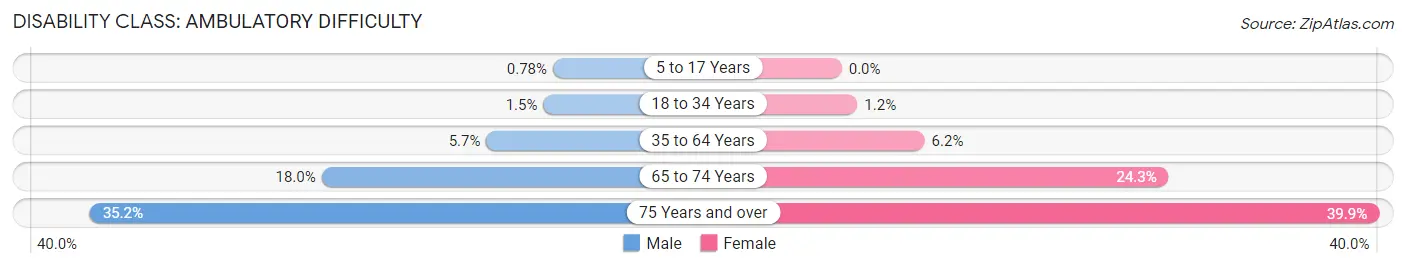
| Age Bracket | Male | Female |
| 5 to 17 Years | 36 (0.8%) | 0 (0.0%) |
| 18 to 34 Years | 75 (1.5%) | 52 (1.2%) |
| 35 to 64 Years | 367 (5.7%) | 421 (6.1%) |
| 65 to 74 Years | 200 (17.9%) | 334 (24.3%) |
| 75 Years and over | 180 (35.2%) | 607 (39.9%) |
Disability Class: Self-Care Difficulty
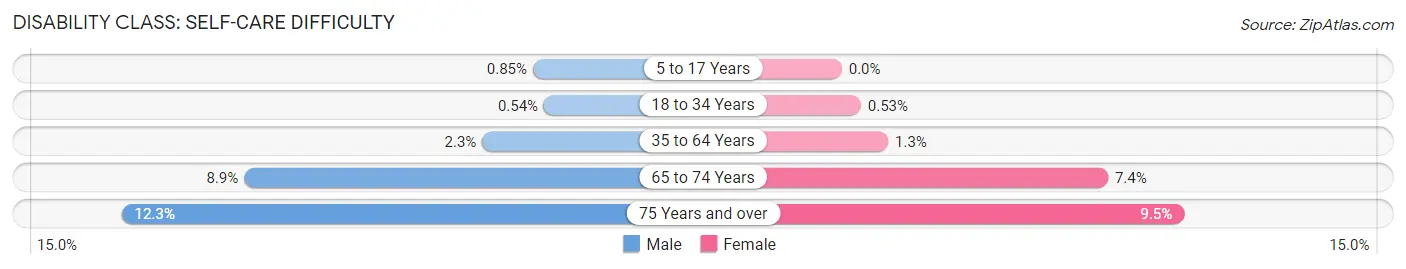
| Age Bracket | Male | Female |
| 5 to 17 Years | 39 (0.9%) | 0 (0.0%) |
| 18 to 34 Years | 27 (0.5%) | 24 (0.5%) |
| 35 to 64 Years | 145 (2.3%) | 88 (1.3%) |
| 65 to 74 Years | 99 (8.9%) | 102 (7.4%) |
| 75 Years and over | 63 (12.3%) | 145 (9.5%) |
Technology Access in Owasso
Computing Device Access in Owasso
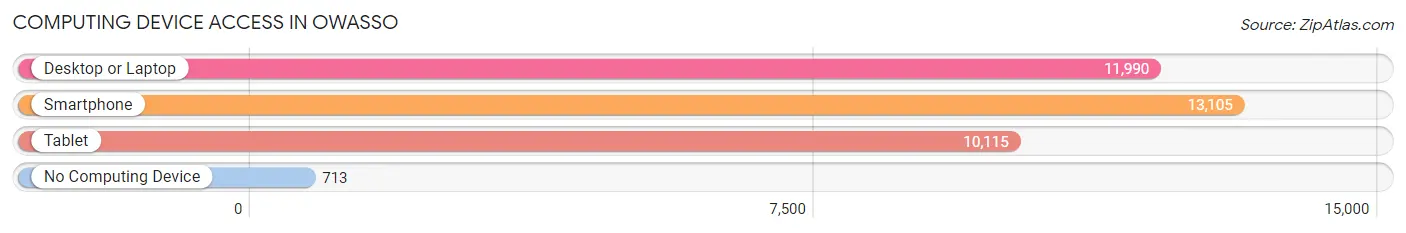
| Device Type | # Households | % Households |
| Desktop or Laptop | 11,990 | 84.3% |
| Smartphone | 13,105 | 92.1% |
| Tablet | 10,115 | 71.1% |
| No Computing Device | 713 | 5.0% |
| Total | 14,230 | 100.0% |
Internet Access in Owasso
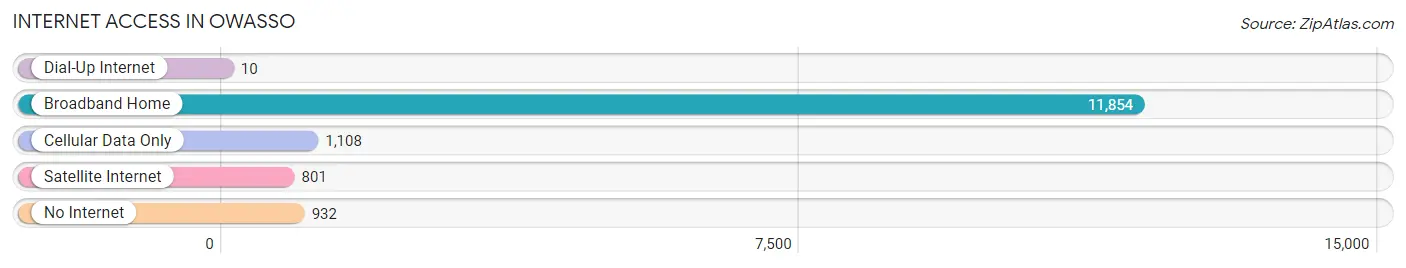
| Internet Type | # Households | % Households |
| Dial-Up Internet | 10 | 0.1% |
| Broadband Home | 11,854 | 83.3% |
| Cellular Data Only | 1,108 | 7.8% |
| Satellite Internet | 801 | 5.6% |
| No Internet | 932 | 6.6% |
| Total | 14,230 | 100.0% |
Owasso Summary
Owasso is a city located in Tulsa County, Oklahoma, United States. It is a suburb of Tulsa, located just north of the city. As of the 2010 census, the population was 28,915, making it the second-largest city in Tulsa County.
Geography
Owasso is located in the northeast corner of Tulsa County, approximately 15 miles (24 km) north of Tulsa. It is bordered by the cities of Collinsville to the north, Skiatook to the northeast, Sperry to the east, Turley to the southeast, and Tulsa to the south and west. According to the United States Census Bureau, the city has a total area of 24.2 square miles (62.7 km2), of which 24.1 square miles (62.4 km2) is land and 0.1 square miles (0.3 km2) (0.41%) is water.
History
Owasso was founded in 1881 by the St. Louis and San Francisco Railway. The town was named after the Osage Indians who once lived in the area. The first post office was established in 1882. The town was incorporated in 1904.
In the early 1900s, Owasso was a small farming community. The town began to grow in the 1950s, when Tulsa began to expand northward. By the 1970s, Owasso had become a bedroom community for Tulsa.
Economy
Owasso is a major economic center for Tulsa County. The city is home to several large employers, including the Tulsa Air and Space Museum, the Tulsa Technology Center, and the Tulsa Zoo. The city also has a large retail sector, with several large shopping centers and numerous restaurants.
Demographics
As of the 2010 census, there were 28,915 people, 10,845 households, and 8,072 families residing in the city. The population density was 1,196.2 people per square mile (461.7/km2). There were 11,717 housing units at an average density of 484.7 per square mile (187.2/km2). The racial makeup of the city was 81.2% White, 4.2% African American, 8.3% Native American, 1.3% Asian, 0.1% Pacific Islander, 1.7% from other races, and 3.3% from two or more races. Hispanic or Latino of any race were 5.2% of the population.
There were 10,845 households, out of which 41.2% had children under the age of 18 living with them, 63.2% were married couples living together, 9.7% had a female householder with no husband present, and 23.2% were non-families. 19.2% of all households were made up of individuals, and 6.2% had someone living alone who was 65 years of age or older. The average household size was 2.67 and the average family size was 3.08.
In the city, the population was spread out, with 29.2% under the age of 18, 7.7% from 18 to 24, 30.2% from 25 to 44, 23.3% from 45 to 64, and 9.6% who were 65 years of age or older. The median age was 35 years. For every 100 females, there were 94.2 males. For every 100 females age 18 and over, there were 90.3 males.
The median income for a household in the city was $60,945, and the median income for a family was $68,945. Males had a median income of $50,945 versus $32,945 for females. The per capita income for the city was $25,945. About 4.2% of families and 5.7% of the population were below the poverty line, including 6.7% of those under age 18 and 5.2% of those age 65 or over.
Common Questions
What is Per Capita Income in Owasso?
Per Capita income in Owasso is $35,275.
What is the Median Family Income in Owasso?
Median Family Income in Owasso is $95,998.
What is the Median Household income in Owasso?
Median Household Income in Owasso is $79,183.
What is Income or Wage Gap in Owasso?
Income or Wage Gap in Owasso is 32.2%.
Women in Owasso earn 67.8 cents for every dollar earned by a man.
What is Family Income Deficit in Owasso?
Family Income Deficit in Owasso is $8,487.
Families that are below poverty line in Owasso earn $8,487 less on average than the poverty threshold level.
What is Inequality or Gini Index in Owasso?
Inequality or Gini Index in Owasso is 0.38.
What is the Total Population of Owasso?
Total Population of Owasso is 38,134.
What is the Total Male Population of Owasso?
Total Male Population of Owasso is 19,212.
What is the Total Female Population of Owasso?
Total Female Population of Owasso is 18,922.
What is the Ratio of Males per 100 Females in Owasso?
There are 101.53 Males per 100 Females in Owasso.
What is the Ratio of Females per 100 Males in Owasso?
There are 98.49 Females per 100 Males in Owasso.
What is the Median Population Age in Owasso?
Median Population Age in Owasso is 33.5 Years.
What is the Average Family Size in Owasso
Average Family Size in Owasso is 3.2 People.
What is the Average Household Size in Owasso
Average Household Size in Owasso is 2.7 People.
How Large is the Labor Force in Owasso?
There are 20,325 People in the Labor Forcein in Owasso.
What is the Percentage of People in the Labor Force in Owasso?
70.1% of People are in the Labor Force in Owasso.
What is the Unemployment Rate in Owasso?
Unemployment Rate in Owasso is 4.6%.