Edmond, OK Map & Demographics
Edmond Map
Edmond Overview
$53,381
PER CAPITA INCOME
$124,204
AVG FAMILY INCOME
$96,389
AVG HOUSEHOLD INCOME
40.6%
WAGE / INCOME GAP [ % ]
59.4¢/ $1
WAGE / INCOME GAP [ $ ]
$13,270
FAMILY INCOME DEFICIT
0.48
INEQUALITY / GINI INDEX
94,503
TOTAL POPULATION
46,014
MALE POPULATION
48,489
FEMALE POPULATION
94.90
MALES / 100 FEMALES
105.38
FEMALES / 100 MALES
37.3
MEDIAN AGE
3.0
AVG FAMILY SIZE
2.6
AVG HOUSEHOLD SIZE
48,908
LABOR FORCE [ PEOPLE ]
66.5%
PERCENT IN LABOR FORCE
3.5%
UNEMPLOYMENT RATE
Edmond Area Codes
Income in Edmond
Income Overview in Edmond
Per Capita Income in Edmond is $53,381, while median incomes of families and households are $124,204 and $96,389 respectively.
| Characteristic | Number | Measure |
| Per Capita Income | 94,503 | $53,381 |
| Median Family Income | 25,503 | $124,204 |
| Mean Family Income | 25,503 | $164,419 |
| Median Household Income | 35,985 | $96,389 |
| Mean Household Income | 35,985 | $137,340 |
| Income Deficit | 25,503 | $13,270 |
| Wage / Income Gap (%) | 94,503 | 40.62% |
| Wage / Income Gap ($) | 94,503 | 59.38¢ per $1 |
| Gini / Inequality Index | 94,503 | 0.48 |
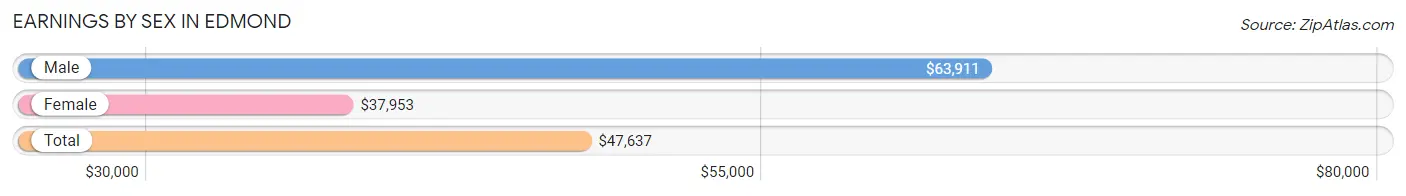
Earnings by Sex in Edmond
Average Earnings in Edmond are $47,637, $63,911 for men and $37,953 for women, a difference of 40.6%.
| Sex | Number | Average Earnings |
| Male | 27,006 (52.7%) | $63,911 |
| Female | 24,209 (47.3%) | $37,953 |
| Total | 51,215 (100.0%) | $47,637 |
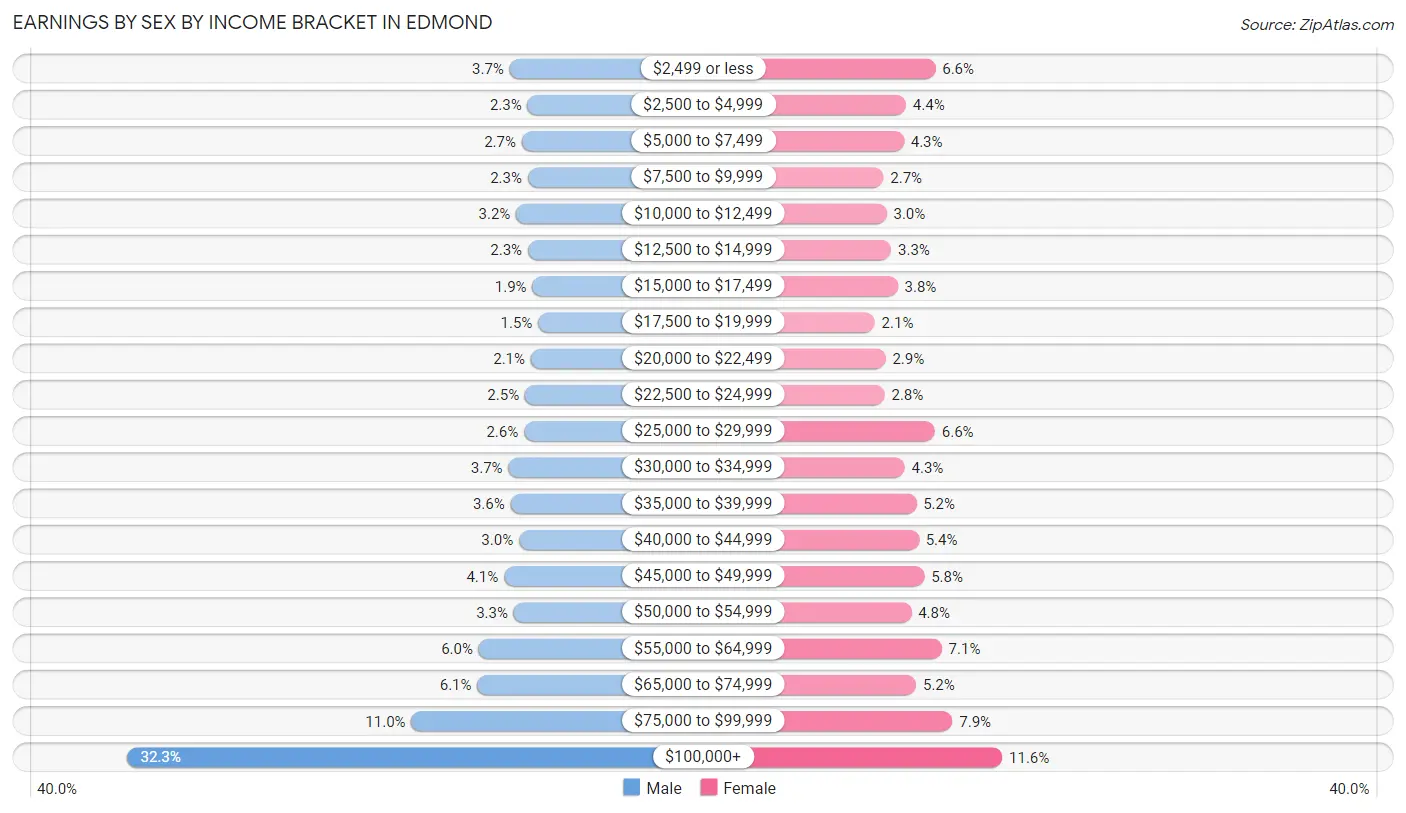
Earnings by Sex by Income Bracket in Edmond
The most common earnings brackets in Edmond are $100,000+ for men (8,718 | 32.3%) and $100,000+ for women (2,817 | 11.6%).
| Income | Male | Female |
| $2,499 or less | 985 (3.6%) | 1,604 (6.6%) |
| $2,500 to $4,999 | 623 (2.3%) | 1,073 (4.4%) |
| $5,000 to $7,499 | 739 (2.7%) | 1,033 (4.3%) |
| $7,500 to $9,999 | 618 (2.3%) | 663 (2.7%) |
| $10,000 to $12,499 | 853 (3.2%) | 722 (3.0%) |
| $12,500 to $14,999 | 616 (2.3%) | 804 (3.3%) |
| $15,000 to $17,499 | 523 (1.9%) | 923 (3.8%) |
| $17,500 to $19,999 | 408 (1.5%) | 507 (2.1%) |
| $20,000 to $22,499 | 556 (2.1%) | 702 (2.9%) |
| $22,500 to $24,999 | 675 (2.5%) | 686 (2.8%) |
| $25,000 to $29,999 | 695 (2.6%) | 1,597 (6.6%) |
| $30,000 to $34,999 | 1,010 (3.7%) | 1,049 (4.3%) |
| $35,000 to $39,999 | 968 (3.6%) | 1,259 (5.2%) |
| $40,000 to $44,999 | 797 (2.9%) | 1,306 (5.4%) |
| $45,000 to $49,999 | 1,098 (4.1%) | 1,404 (5.8%) |
| $50,000 to $54,999 | 902 (3.3%) | 1,169 (4.8%) |
| $55,000 to $64,999 | 1,610 (6.0%) | 1,721 (7.1%) |
| $65,000 to $74,999 | 1,639 (6.1%) | 1,256 (5.2%) |
| $75,000 to $99,999 | 2,973 (11.0%) | 1,914 (7.9%) |
| $100,000+ | 8,718 (32.3%) | 2,817 (11.6%) |
| Total | 27,006 (100.0%) | 24,209 (100.0%) |
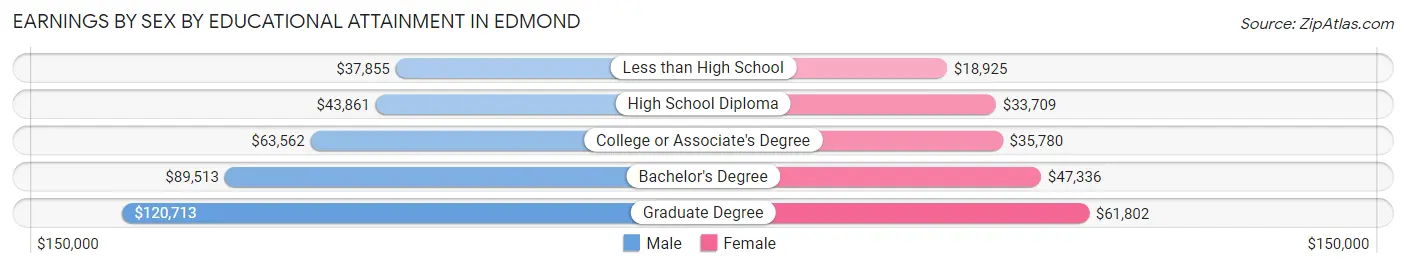
Earnings by Sex by Educational Attainment in Edmond
Average earnings in Edmond are $76,702 for men and $45,760 for women, a difference of 40.3%. Men with an educational attainment of graduate degree enjoy the highest average annual earnings of $120,713, while those with less than high school education earn the least with $37,855. Women with an educational attainment of graduate degree earn the most with the average annual earnings of $61,802, while those with less than high school education have the smallest earnings of $18,925.
| Educational Attainment | Male Income | Female Income |
| Less than High School | $37,855 | $18,925 |
| High School Diploma | $43,861 | $33,709 |
| College or Associate's Degree | $63,562 | $35,780 |
| Bachelor's Degree | $89,513 | $47,336 |
| Graduate Degree | $120,713 | $61,802 |
| Total | $76,702 | $45,760 |
Family Income in Edmond
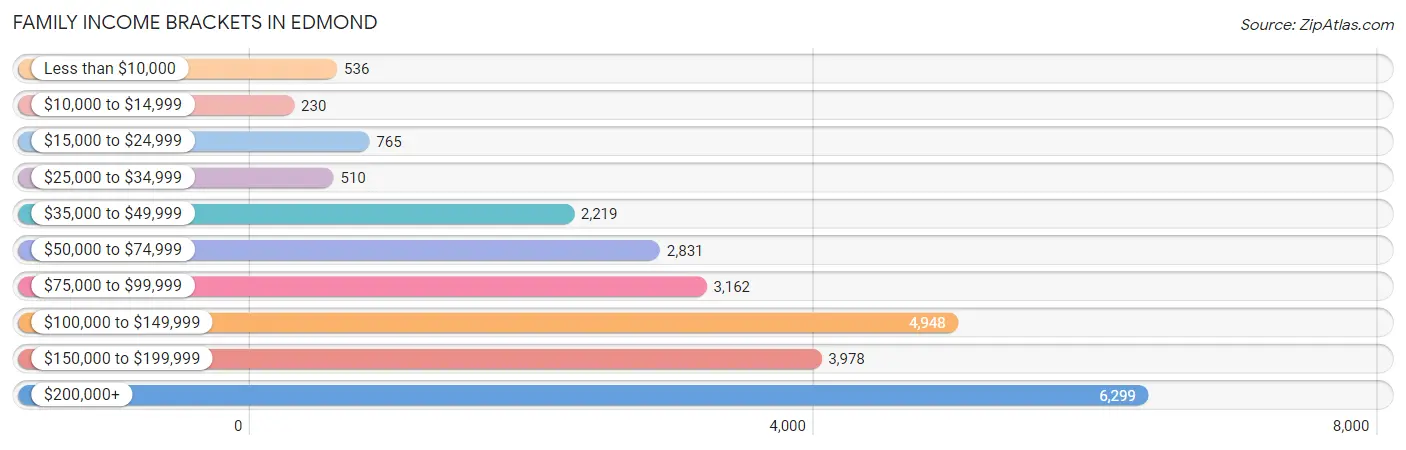
Family Income Brackets in Edmond
According to the Edmond family income data, there are 6,299 families falling into the $200,000+ income range, which is the most common income bracket and makes up 24.7% of all families. Conversely, the $10,000 to $14,999 income bracket is the least frequent group with only 230 families (0.9%) belonging to this category.
| Income Bracket | # Families | % Families |
| Less than $10,000 | 536 | 2.1% |
| $10,000 to $14,999 | 230 | 0.9% |
| $15,000 to $24,999 | 765 | 3.0% |
| $25,000 to $34,999 | 510 | 2.0% |
| $35,000 to $49,999 | 2,219 | 8.7% |
| $50,000 to $74,999 | 2,831 | 11.1% |
| $75,000 to $99,999 | 3,162 | 12.4% |
| $100,000 to $149,999 | 4,948 | 19.4% |
| $150,000 to $199,999 | 3,978 | 15.6% |
| $200,000+ | 6,299 | 24.7% |
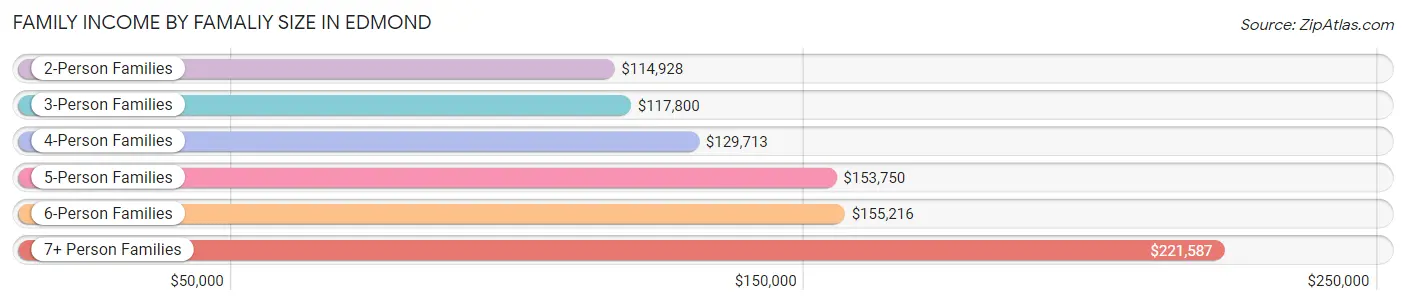
Family Income by Famaliy Size in Edmond
7+ person families (281 | 1.1%) account for the highest median family income in Edmond with $221,587 per family, while 2-person families (12,451 | 48.8%) have the highest median income of $57,464 per family member.
| Income Bracket | # Families | Median Income |
| 2-Person Families | 12,451 (48.8%) | $114,928 |
| 3-Person Families | 5,474 (21.5%) | $117,800 |
| 4-Person Families | 4,660 (18.3%) | $129,713 |
| 5-Person Families | 2,044 (8.0%) | $153,750 |
| 6-Person Families | 593 (2.3%) | $155,216 |
| 7+ Person Families | 281 (1.1%) | $221,587 |
| Total | 25,503 (100.0%) | $124,204 |
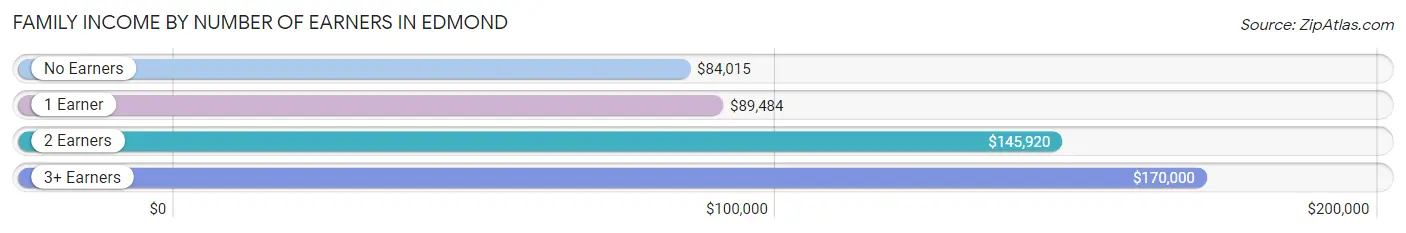
Family Income by Number of Earners in Edmond
The median family income in Edmond is $124,204, with families comprising 3+ earners (2,322) having the highest median family income of $170,000, while families with no earners (3,446) have the lowest median family income of $84,015, accounting for 9.1% and 13.5% of families, respectively.
| Number of Earners | # Families | Median Income |
| No Earners | 3,446 (13.5%) | $84,015 |
| 1 Earner | 7,969 (31.2%) | $89,484 |
| 2 Earners | 11,766 (46.1%) | $145,920 |
| 3+ Earners | 2,322 (9.1%) | $170,000 |
| Total | 25,503 (100.0%) | $124,204 |
Household Income in Edmond
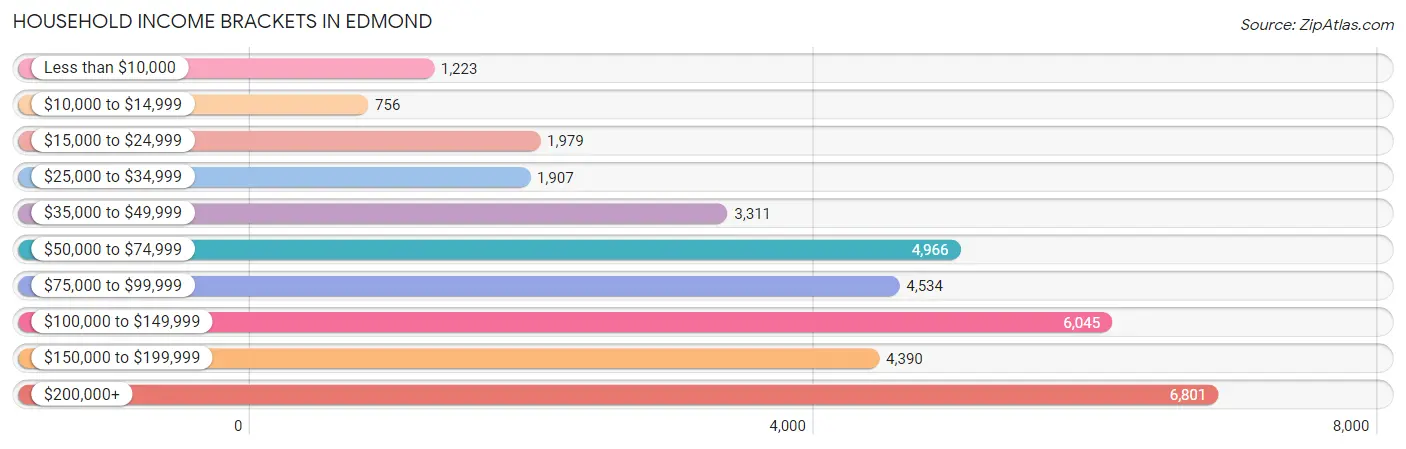
Household Income Brackets in Edmond
With 6,801 households falling in the category, the $200,000+ income range is the most frequent in Edmond, accounting for 18.9% of all households. In contrast, only 756 households (2.1%) fall into the $10,000 to $14,999 income bracket, making it the least populous group.
| Income Bracket | # Households | % Households |
| Less than $10,000 | 1,223 | 3.4% |
| $10,000 to $14,999 | 756 | 2.1% |
| $15,000 to $24,999 | 1,979 | 5.5% |
| $25,000 to $34,999 | 1,907 | 5.3% |
| $35,000 to $49,999 | 3,311 | 9.2% |
| $50,000 to $74,999 | 4,966 | 13.8% |
| $75,000 to $99,999 | 4,534 | 12.6% |
| $100,000 to $149,999 | 6,045 | 16.8% |
| $150,000 to $199,999 | 4,390 | 12.2% |
| $200,000+ | 6,801 | 18.9% |
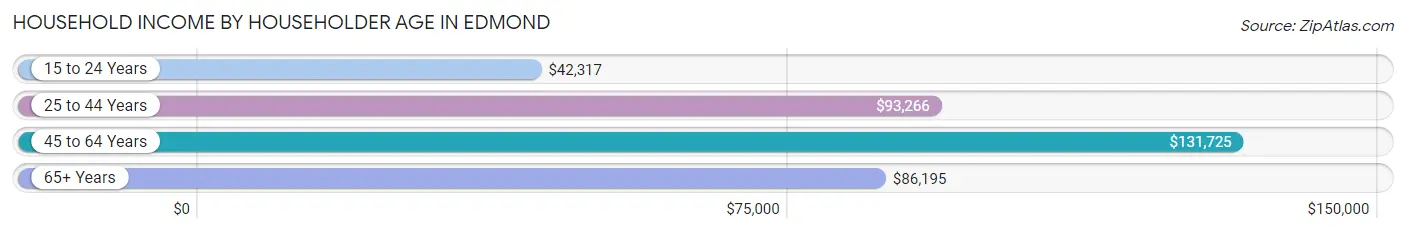
Household Income by Householder Age in Edmond
The median household income in Edmond is $96,389, with the highest median household income of $131,725 found in the 45 to 64 years age bracket for the primary householder. A total of 12,847 households (35.7%) fall into this category. Meanwhile, the 15 to 24 years age bracket for the primary householder has the lowest median household income of $42,317, with 2,324 households (6.5%) in this group.
| Income Bracket | # Households | Median Income |
| 15 to 24 Years | 2,324 (6.5%) | $42,317 |
| 25 to 44 Years | 12,168 (33.8%) | $93,266 |
| 45 to 64 Years | 12,847 (35.7%) | $131,725 |
| 65+ Years | 8,646 (24.0%) | $86,195 |
| Total | 35,985 (100.0%) | $96,389 |
Poverty in Edmond
Income Below Poverty by Sex and Age in Edmond
With 8.9% poverty level for males and 10.0% for females among the residents of Edmond, 18 to 24 year old males and 18 to 24 year old females are the most vulnerable to poverty, with 1,004 males (23.8%) and 1,203 females (29.1%) in their respective age groups living below the poverty level.
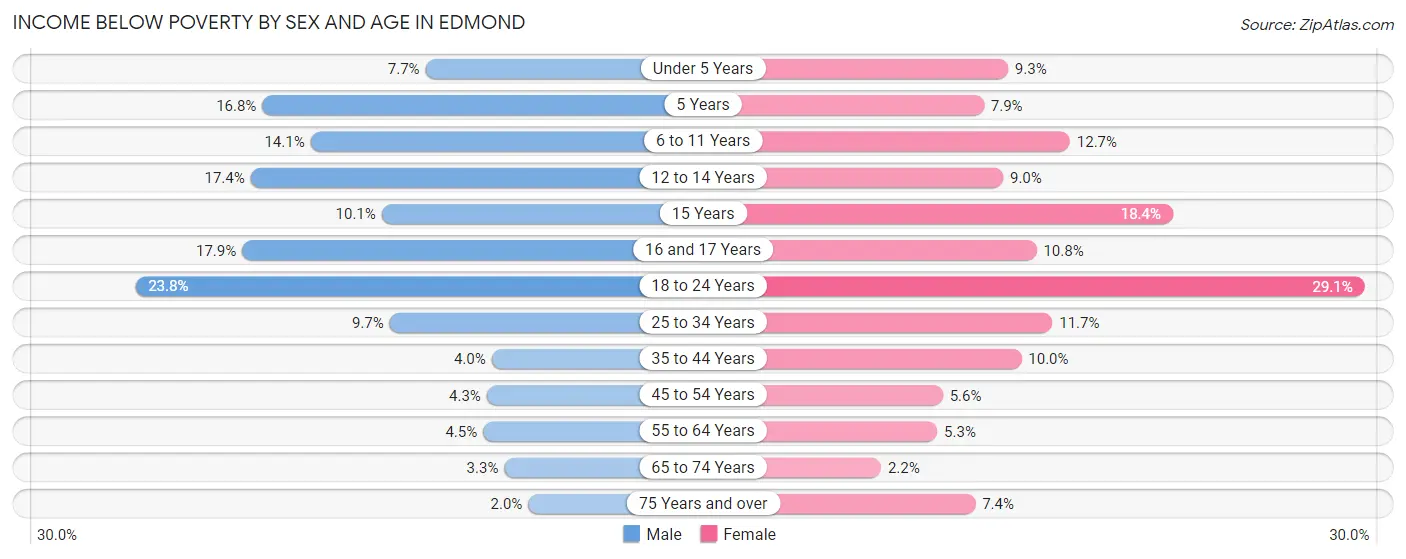
| Age Bracket | Male | Female |
| Under 5 Years | 256 (7.7%) | 287 (9.2%) |
| 5 Years | 113 (16.8%) | 44 (7.9%) |
| 6 to 11 Years | 527 (14.1%) | 508 (12.7%) |
| 12 to 14 Years | 342 (17.4%) | 191 (9.0%) |
| 15 Years | 58 (10.1%) | 117 (18.4%) |
| 16 and 17 Years | 289 (17.9%) | 134 (10.8%) |
| 18 to 24 Years | 1,004 (23.8%) | 1,203 (29.1%) |
| 25 to 34 Years | 528 (9.7%) | 669 (11.7%) |
| 35 to 44 Years | 231 (4.0%) | 602 (10.0%) |
| 45 to 54 Years | 257 (4.3%) | 327 (5.6%) |
| 55 to 64 Years | 247 (4.5%) | 342 (5.3%) |
| 65 to 74 Years | 136 (3.3%) | 107 (2.2%) |
| 75 Years and over | 44 (2.0%) | 205 (7.4%) |
| Total | 4,032 (8.9%) | 4,736 (10.0%) |
Income Above Poverty by Sex and Age in Edmond
According to the poverty statistics in Edmond, males aged 75 years and over and females aged 65 to 74 years are the age groups that are most secure financially, with 98.0% of males and 97.8% of females in these age groups living above the poverty line.
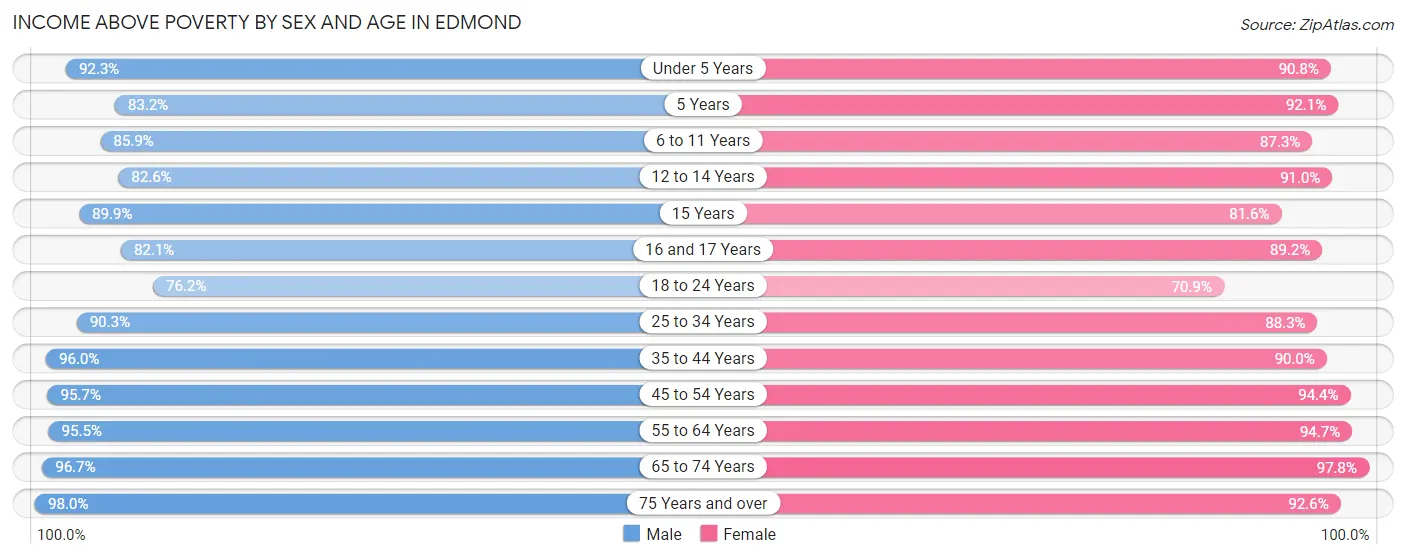
| Age Bracket | Male | Female |
| Under 5 Years | 3,077 (92.3%) | 2,816 (90.7%) |
| 5 Years | 561 (83.2%) | 512 (92.1%) |
| 6 to 11 Years | 3,216 (85.9%) | 3,493 (87.3%) |
| 12 to 14 Years | 1,621 (82.6%) | 1,936 (91.0%) |
| 15 Years | 515 (89.9%) | 518 (81.6%) |
| 16 and 17 Years | 1,326 (82.1%) | 1,102 (89.2%) |
| 18 to 24 Years | 3,207 (76.2%) | 2,930 (70.9%) |
| 25 to 34 Years | 4,927 (90.3%) | 5,037 (88.3%) |
| 35 to 44 Years | 5,542 (96.0%) | 5,420 (90.0%) |
| 45 to 54 Years | 5,756 (95.7%) | 5,496 (94.4%) |
| 55 to 64 Years | 5,282 (95.5%) | 6,102 (94.7%) |
| 65 to 74 Years | 3,992 (96.7%) | 4,803 (97.8%) |
| 75 Years and over | 2,200 (98.0%) | 2,553 (92.6%) |
| Total | 41,222 (91.1%) | 42,718 (90.0%) |
Income Below Poverty Among Married-Couple Families in Edmond
The poverty statistics for married-couple families in Edmond show that 2.5% or 524 of the total 21,215 families live below the poverty line. Families with 5 or more children have the highest poverty rate of 6.4%, comprising of 7 families. On the other hand, families with no children have the lowest poverty rate of 1.4%, which includes 166 families.
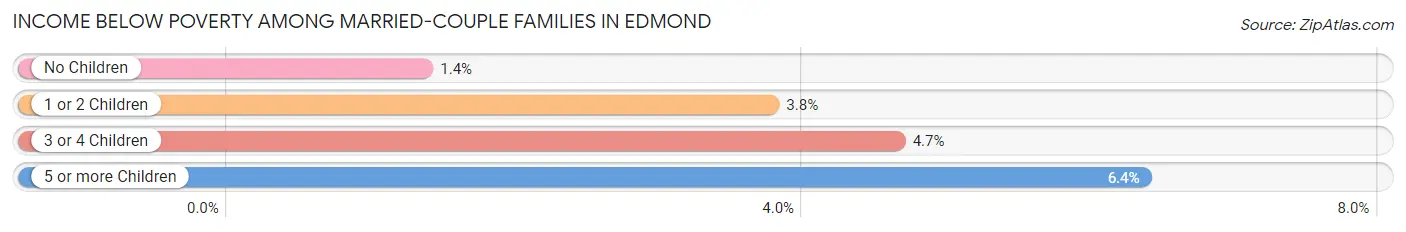
| Children | Above Poverty | Below Poverty |
| No Children | 12,076 (98.6%) | 166 (1.4%) |
| 1 or 2 Children | 6,668 (96.2%) | 261 (3.8%) |
| 3 or 4 Children | 1,844 (95.4%) | 90 (4.6%) |
| 5 or more Children | 103 (93.6%) | 7 (6.4%) |
| Total | 20,691 (97.5%) | 524 (2.5%) |
Income Below Poverty Among Single-Parent Households in Edmond
According to the poverty data in Edmond, 8.6% or 109 single-father households and 22.4% or 679 single-mother households are living below the poverty line. Among single-father households, those with no children have the highest poverty rate, with 49 households (8.8%) experiencing poverty. Likewise, among single-mother households, those with 3 or 4 children have the highest poverty rate, with 270 households (64.7%) falling below the poverty line.
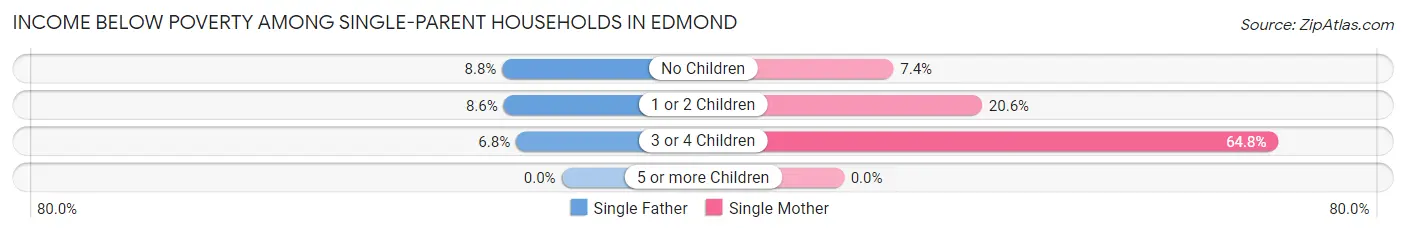
| Children | Single Father | Single Mother |
| No Children | 49 (8.8%) | 72 (7.4%) |
| 1 or 2 Children | 56 (8.6%) | 337 (20.6%) |
| 3 or 4 Children | 4 (6.8%) | 270 (64.7%) |
| 5 or more Children | 0 (0.0%) | 0 (0.0%) |
| Total | 109 (8.6%) | 679 (22.4%) |
Income Below Poverty Among Married-Couple vs Single-Parent Households in Edmond
The poverty data for Edmond shows that 524 of the married-couple family households (2.5%) and 788 of the single-parent households (18.4%) are living below the poverty level. Within the married-couple family households, those with 5 or more children have the highest poverty rate, with 7 households (6.4%) falling below the poverty line. Among the single-parent households, those with 3 or 4 children have the highest poverty rate, with 274 household (57.6%) living below poverty.
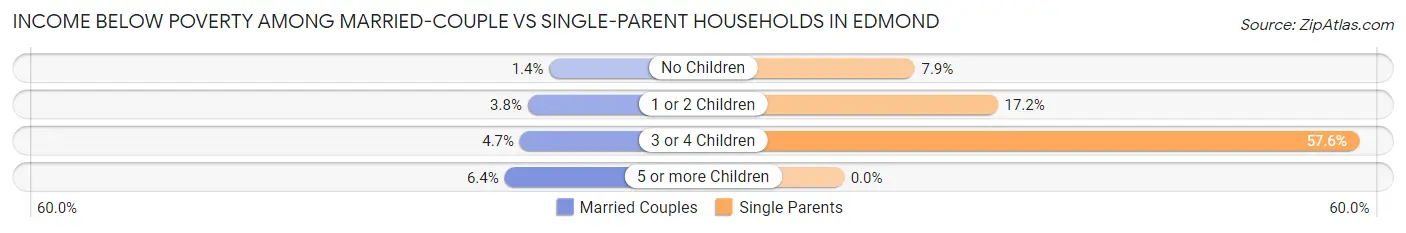
| Children | Married-Couple Families | Single-Parent Households |
| No Children | 166 (1.4%) | 121 (7.9%) |
| 1 or 2 Children | 261 (3.8%) | 393 (17.2%) |
| 3 or 4 Children | 90 (4.6%) | 274 (57.6%) |
| 5 or more Children | 7 (6.4%) | 0 (0.0%) |
| Total | 524 (2.5%) | 788 (18.4%) |
Race in Edmond
The most populous races in Edmond are White / Caucasian (74,606 | 78.9%), Two or more Races (8,730 | 9.2%), and Hispanic or Latino (6,151 | 6.5%).
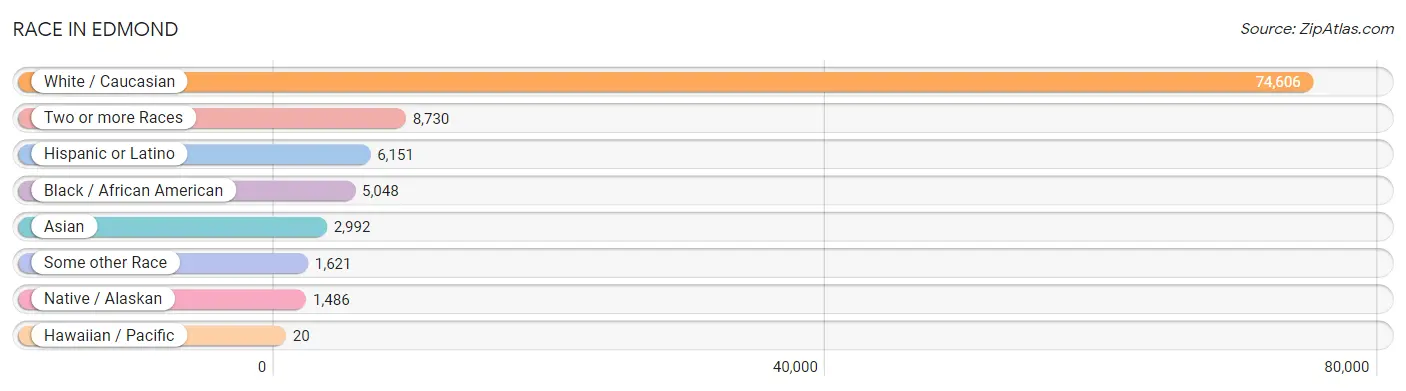
| Race | # Population | % Population |
| Asian | 2,992 | 3.2% |
| Black / African American | 5,048 | 5.3% |
| Hawaiian / Pacific | 20 | 0.0% |
| Hispanic or Latino | 6,151 | 6.5% |
| Native / Alaskan | 1,486 | 1.6% |
| White / Caucasian | 74,606 | 78.9% |
| Two or more Races | 8,730 | 9.2% |
| Some other Race | 1,621 | 1.7% |
| Total | 94,503 | 100.0% |
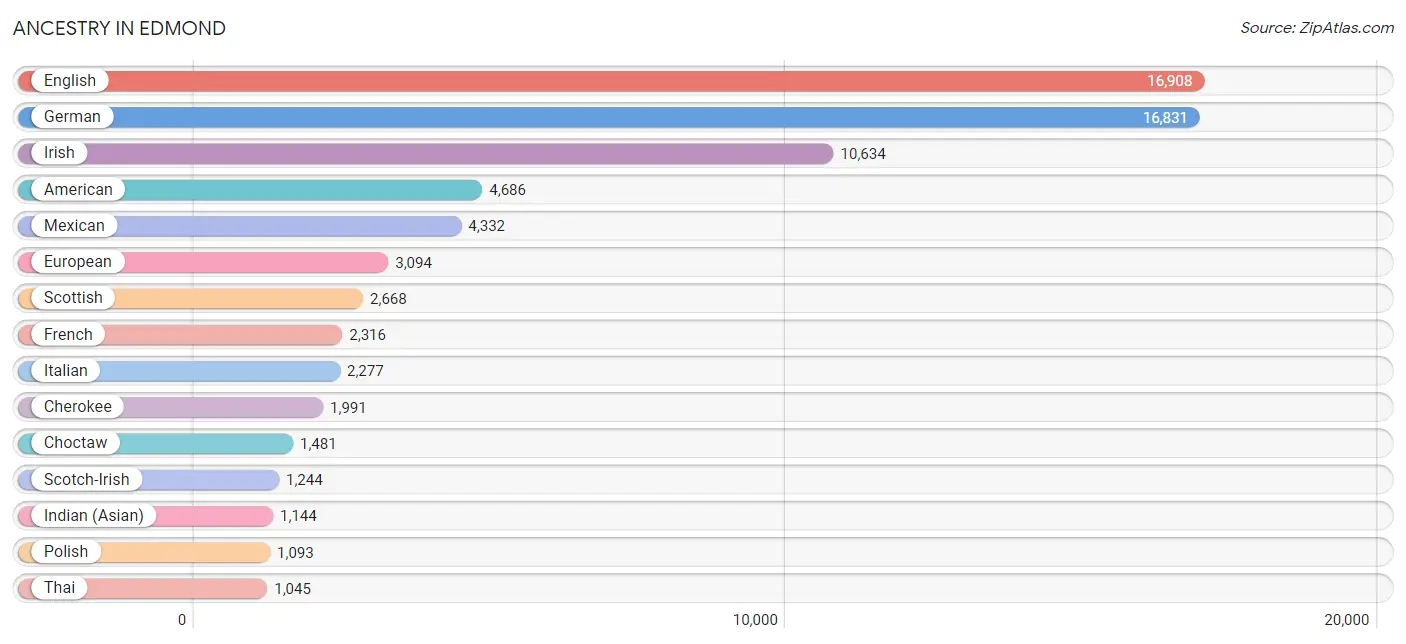
Ancestry in Edmond
The most populous ancestries reported in Edmond are English (16,908 | 17.9%), German (16,831 | 17.8%), Irish (10,634 | 11.3%), American (4,686 | 5.0%), and Mexican (4,332 | 4.6%), together accounting for 56.5% of all Edmond residents.
| Ancestry | # Population | % Population |
| African | 422 | 0.4% |
| Albanian | 27 | 0.0% |
| American | 4,686 | 5.0% |
| Apache | 3 | 0.0% |
| Arab | 932 | 1.0% |
| Argentinean | 5 | 0.0% |
| Armenian | 7 | 0.0% |
| Australian | 1 | 0.0% |
| Austrian | 87 | 0.1% |
| Basque | 8 | 0.0% |
| Belgian | 25 | 0.0% |
| Bhutanese | 452 | 0.5% |
| Blackfeet | 17 | 0.0% |
| Brazilian | 32 | 0.0% |
| British | 883 | 0.9% |
| British West Indian | 29 | 0.0% |
| Burmese | 195 | 0.2% |
| Cajun | 35 | 0.0% |
| Canadian | 165 | 0.2% |
| Central American | 213 | 0.2% |
| Central American Indian | 9 | 0.0% |
| Cherokee | 1,991 | 2.1% |
| Chickasaw | 582 | 0.6% |
| Chilean | 22 | 0.0% |
| Choctaw | 1,481 | 1.6% |
| Colombian | 295 | 0.3% |
| Comanche | 40 | 0.0% |
| Costa Rican | 28 | 0.0% |
| Cree | 8 | 0.0% |
| Creek | 311 | 0.3% |
| Croatian | 96 | 0.1% |
| Cuban | 194 | 0.2% |
| Czech | 421 | 0.4% |
| Czechoslovakian | 143 | 0.2% |
| Danish | 138 | 0.2% |
| Delaware | 55 | 0.1% |
| Dominican | 39 | 0.0% |
| Dutch | 958 | 1.0% |
| Dutch West Indian | 32 | 0.0% |
| Eastern European | 258 | 0.3% |
| Egyptian | 15 | 0.0% |
| English | 16,908 | 17.9% |
| Ethiopian | 22 | 0.0% |
| European | 3,094 | 3.3% |
| Filipino | 192 | 0.2% |
| Finnish | 36 | 0.0% |
| French | 2,316 | 2.5% |
| French Canadian | 223 | 0.2% |
| German | 16,831 | 17.8% |
| Ghanaian | 47 | 0.1% |
| Greek | 232 | 0.3% |
| Guamanian / Chamorro | 7 | 0.0% |
| Guatemalan | 69 | 0.1% |
| Honduran | 19 | 0.0% |
| Hopi | 6 | 0.0% |
| Hungarian | 134 | 0.1% |
| Icelander | 20 | 0.0% |
| Indian (Asian) | 1,144 | 1.2% |
| Iranian | 349 | 0.4% |
| Iraqi | 172 | 0.2% |
| Irish | 10,634 | 11.3% |
| Iroquois | 62 | 0.1% |
| Israeli | 18 | 0.0% |
| Italian | 2,277 | 2.4% |
| Jamaican | 15 | 0.0% |
| Kenyan | 11 | 0.0% |
| Kiowa | 21 | 0.0% |
| Korean | 298 | 0.3% |
| Laotian | 8 | 0.0% |
| Lebanese | 265 | 0.3% |
| Lithuanian | 63 | 0.1% |
| Lumbee | 11 | 0.0% |
| Luxembourger | 1 | 0.0% |
| Mexican | 4,332 | 4.6% |
| Mexican American Indian | 19 | 0.0% |
| Moroccan | 68 | 0.1% |
| Native Hawaiian | 58 | 0.1% |
| Navajo | 4 | 0.0% |
| Nicaraguan | 8 | 0.0% |
| Nigerian | 278 | 0.3% |
| Northern European | 177 | 0.2% |
| Norwegian | 920 | 1.0% |
| Osage | 96 | 0.1% |
| Paiute | 8 | 0.0% |
| Pakistani | 44 | 0.1% |
| Panamanian | 11 | 0.0% |
| Pennsylvania German | 9 | 0.0% |
| Peruvian | 65 | 0.1% |
| Polish | 1,093 | 1.2% |
| Portuguese | 168 | 0.2% |
| Potawatomi | 73 | 0.1% |
| Pueblo | 11 | 0.0% |
| Puerto Rican | 303 | 0.3% |
| Romanian | 32 | 0.0% |
| Russian | 359 | 0.4% |
| Salvadoran | 78 | 0.1% |
| Samoan | 29 | 0.0% |
| Scandinavian | 429 | 0.4% |
| Scotch-Irish | 1,244 | 1.3% |
| Scottish | 2,668 | 2.8% |
| Seminole | 17 | 0.0% |
| Sioux | 13 | 0.0% |
| Slavic | 9 | 0.0% |
| Slovak | 159 | 0.2% |
| Slovene | 36 | 0.0% |
| South American | 535 | 0.6% |
| Spaniard | 278 | 0.3% |
| Spanish | 170 | 0.2% |
| Sri Lankan | 408 | 0.4% |
| Subsaharan African | 790 | 0.8% |
| Swedish | 856 | 0.9% |
| Swiss | 467 | 0.5% |
| Syrian | 53 | 0.1% |
| Thai | 1,045 | 1.1% |
| Turkish | 51 | 0.1% |
| Ugandan | 8 | 0.0% |
| Ukrainian | 42 | 0.0% |
| Venezuelan | 148 | 0.2% |
| Vietnamese | 93 | 0.1% |
| Welsh | 387 | 0.4% |
| Yugoslavian | 12 | 0.0% | View All 121 Rows |
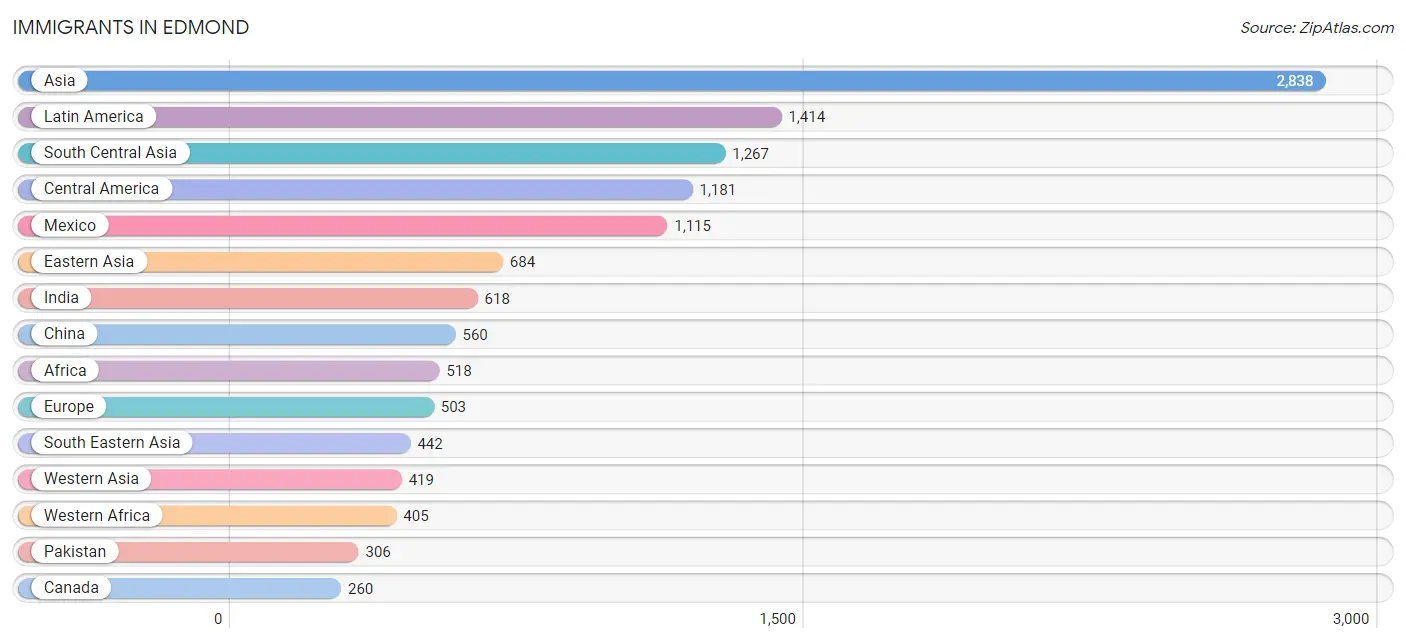
Immigrants in Edmond
The most numerous immigrant groups reported in Edmond came from Asia (2,838 | 3.0%), Latin America (1,414 | 1.5%), South Central Asia (1,267 | 1.3%), Central America (1,181 | 1.3%), and Mexico (1,115 | 1.2%), together accounting for 8.3% of all Edmond residents.
| Immigration Origin | # Population | % Population |
| Africa | 518 | 0.5% |
| Asia | 2,838 | 3.0% |
| Bangladesh | 62 | 0.1% |
| Brazil | 29 | 0.0% |
| Canada | 260 | 0.3% |
| Caribbean | 36 | 0.0% |
| Central America | 1,181 | 1.3% |
| China | 560 | 0.6% |
| Colombia | 69 | 0.1% |
| Czechoslovakia | 17 | 0.0% |
| Dominican Republic | 7 | 0.0% |
| Eastern Africa | 47 | 0.1% |
| Eastern Asia | 684 | 0.7% |
| Eastern Europe | 152 | 0.2% |
| El Salvador | 7 | 0.0% |
| England | 99 | 0.1% |
| Eritrea | 22 | 0.0% |
| Europe | 503 | 0.5% |
| France | 1 | 0.0% |
| Germany | 57 | 0.1% |
| Ghana | 16 | 0.0% |
| Grenada | 11 | 0.0% |
| Guatemala | 32 | 0.0% |
| Guyana | 24 | 0.0% |
| Honduras | 19 | 0.0% |
| Hungary | 9 | 0.0% |
| India | 618 | 0.6% |
| Indonesia | 51 | 0.1% |
| Iran | 217 | 0.2% |
| Iraq | 252 | 0.3% |
| Italy | 9 | 0.0% |
| Japan | 12 | 0.0% |
| Kazakhstan | 7 | 0.0% |
| Kenya | 11 | 0.0% |
| Korea | 112 | 0.1% |
| Latin America | 1,414 | 1.5% |
| Malaysia | 83 | 0.1% |
| Mexico | 1,115 | 1.2% |
| Middle Africa | 36 | 0.0% |
| Morocco | 24 | 0.0% |
| Nepal | 6 | 0.0% |
| Nicaragua | 8 | 0.0% |
| Nigeria | 210 | 0.2% |
| Northern Africa | 24 | 0.0% |
| Northern Europe | 231 | 0.2% |
| Oceania | 29 | 0.0% |
| Pakistan | 306 | 0.3% |
| Peru | 7 | 0.0% |
| Philippines | 71 | 0.1% |
| Portugal | 32 | 0.0% |
| Romania | 83 | 0.1% |
| Russia | 43 | 0.1% |
| Saudi Arabia | 116 | 0.1% |
| Scotland | 65 | 0.1% |
| Senegal | 100 | 0.1% |
| South America | 197 | 0.2% |
| South Central Asia | 1,267 | 1.3% |
| South Eastern Asia | 442 | 0.5% |
| Southern Europe | 62 | 0.1% |
| Spain | 21 | 0.0% |
| Sri Lanka | 51 | 0.1% |
| Sweden | 51 | 0.1% |
| Taiwan | 165 | 0.2% |
| Thailand | 27 | 0.0% |
| Turkey | 51 | 0.1% |
| Uganda | 8 | 0.0% |
| Venezuela | 68 | 0.1% |
| Vietnam | 210 | 0.2% |
| Western Africa | 405 | 0.4% |
| Western Asia | 419 | 0.4% |
| Western Europe | 58 | 0.1% |
| Zaire | 36 | 0.0% |
| Zimbabwe | 6 | 0.0% | View All 73 Rows |
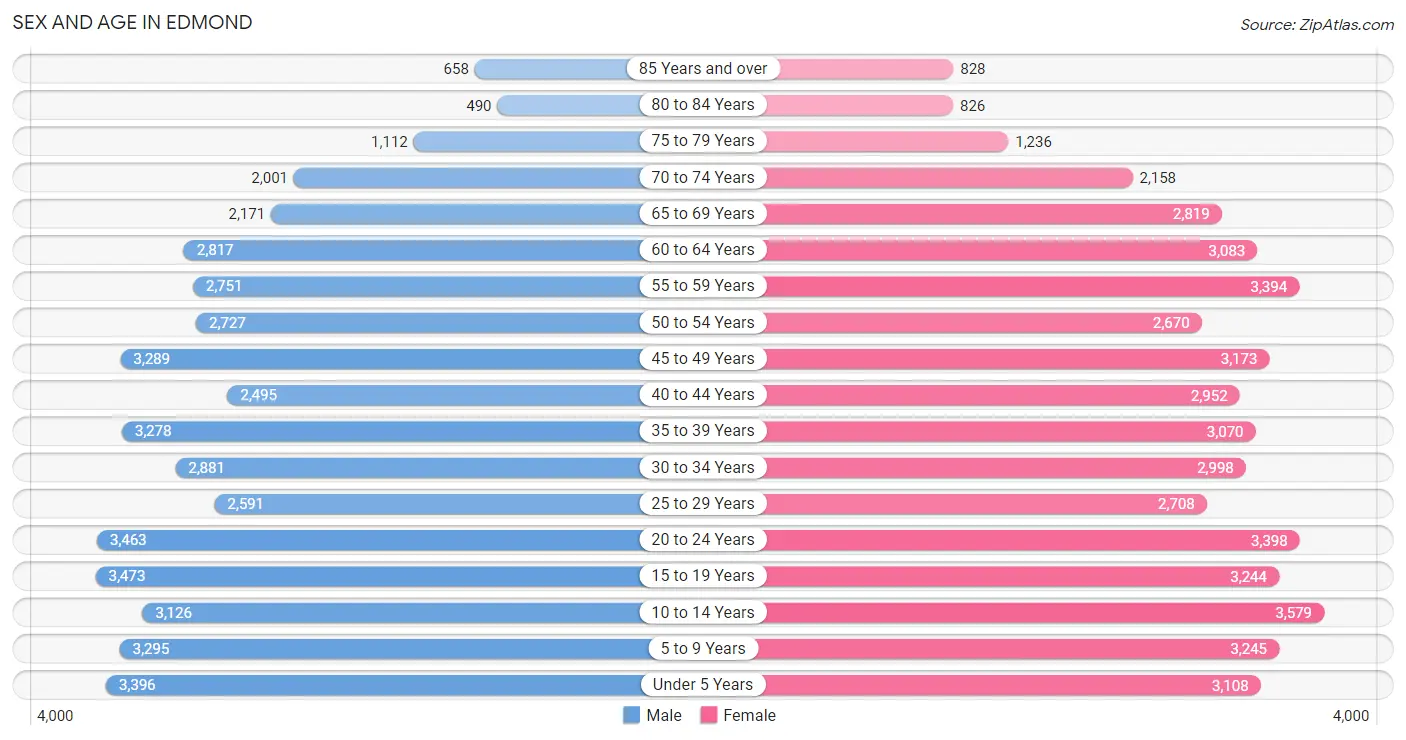
Sex and Age in Edmond
Sex and Age in Edmond
The most populous age groups in Edmond are 15 to 19 Years (3,473 | 7.5%) for men and 10 to 14 Years (3,579 | 7.4%) for women.
| Age Bracket | Male | Female |
| Under 5 Years | 3,396 (7.4%) | 3,108 (6.4%) |
| 5 to 9 Years | 3,295 (7.2%) | 3,245 (6.7%) |
| 10 to 14 Years | 3,126 (6.8%) | 3,579 (7.4%) |
| 15 to 19 Years | 3,473 (7.5%) | 3,244 (6.7%) |
| 20 to 24 Years | 3,463 (7.5%) | 3,398 (7.0%) |
| 25 to 29 Years | 2,591 (5.6%) | 2,708 (5.6%) |
| 30 to 34 Years | 2,881 (6.3%) | 2,998 (6.2%) |
| 35 to 39 Years | 3,278 (7.1%) | 3,070 (6.3%) |
| 40 to 44 Years | 2,495 (5.4%) | 2,952 (6.1%) |
| 45 to 49 Years | 3,289 (7.1%) | 3,173 (6.5%) |
| 50 to 54 Years | 2,727 (5.9%) | 2,670 (5.5%) |
| 55 to 59 Years | 2,751 (6.0%) | 3,394 (7.0%) |
| 60 to 64 Years | 2,817 (6.1%) | 3,083 (6.4%) |
| 65 to 69 Years | 2,171 (4.7%) | 2,819 (5.8%) |
| 70 to 74 Years | 2,001 (4.3%) | 2,158 (4.4%) |
| 75 to 79 Years | 1,112 (2.4%) | 1,236 (2.5%) |
| 80 to 84 Years | 490 (1.1%) | 826 (1.7%) |
| 85 Years and over | 658 (1.4%) | 828 (1.7%) |
| Total | 46,014 (100.0%) | 48,489 (100.0%) |
Families and Households in Edmond
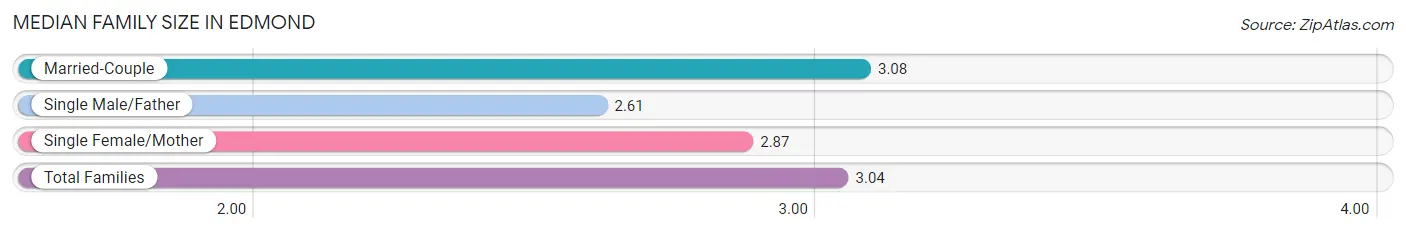
Median Family Size in Edmond
The median family size in Edmond is 3.04 persons per family, with married-couple families (21,215 | 83.2%) accounting for the largest median family size of 3.08 persons per family. On the other hand, single male/father families (1,262 | 5.0%) represent the smallest median family size with 2.61 persons per family.
| Family Type | # Families | Family Size |
| Married-Couple | 21,215 (83.2%) | 3.08 |
| Single Male/Father | 1,262 (5.0%) | 2.61 |
| Single Female/Mother | 3,026 (11.9%) | 2.87 |
| Total Families | 25,503 (100.0%) | 3.04 |
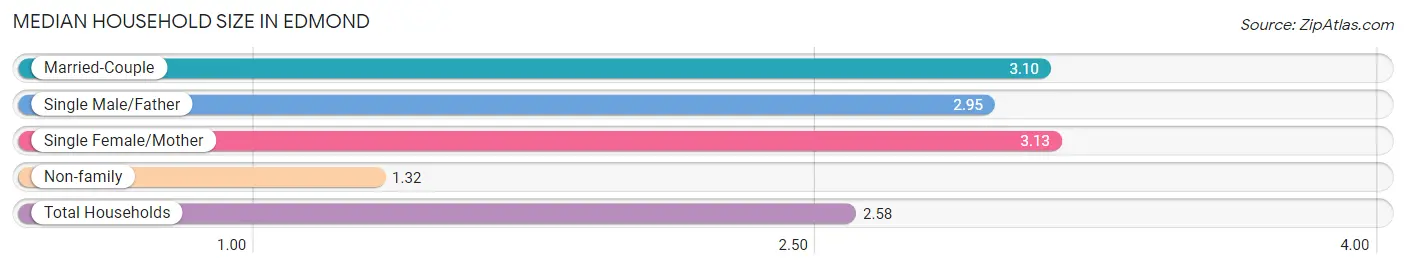
Median Household Size in Edmond
The median household size in Edmond is 2.58 persons per household, with single female/mother households (3,026 | 8.4%) accounting for the largest median household size of 3.13 persons per household. non-family households (10,482 | 29.1%) represent the smallest median household size with 1.32 persons per household.
| Household Type | # Households | Household Size |
| Married-Couple | 21,215 (59.0%) | 3.10 |
| Single Male/Father | 1,262 (3.5%) | 2.95 |
| Single Female/Mother | 3,026 (8.4%) | 3.13 |
| Non-family | 10,482 (29.1%) | 1.32 |
| Total Households | 35,985 (100.0%) | 2.58 |
Household Size by Marriage Status in Edmond
Out of a total of 35,985 households in Edmond, 25,503 (70.9%) are family households, while 10,482 (29.1%) are nonfamily households. The most numerous type of family households are 2-person households, comprising 11,874, and the most common type of nonfamily households are 1-person households, comprising 7,911.
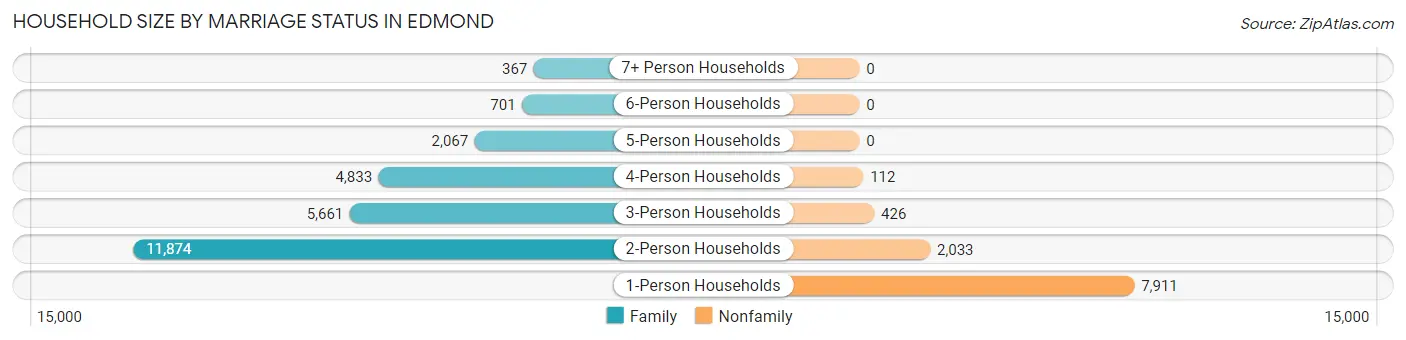
| Household Size | Family Households | Nonfamily Households |
| 1-Person Households | - | 7,911 (22.0%) |
| 2-Person Households | 11,874 (33.0%) | 2,033 (5.7%) |
| 3-Person Households | 5,661 (15.7%) | 426 (1.2%) |
| 4-Person Households | 4,833 (13.4%) | 112 (0.3%) |
| 5-Person Households | 2,067 (5.7%) | 0 (0.0%) |
| 6-Person Households | 701 (1.9%) | 0 (0.0%) |
| 7+ Person Households | 367 (1.0%) | 0 (0.0%) |
| Total | 25,503 (70.9%) | 10,482 (29.1%) |
Female Fertility in Edmond
Fertility by Age in Edmond
Average fertility rate in Edmond is 68.0 births per 1,000 women. Women in the age bracket of 20 to 34 years have the highest fertility rate with 115.0 births per 1,000 women. Women in the age bracket of 20 to 34 years acount for 70.3% of all women with births.
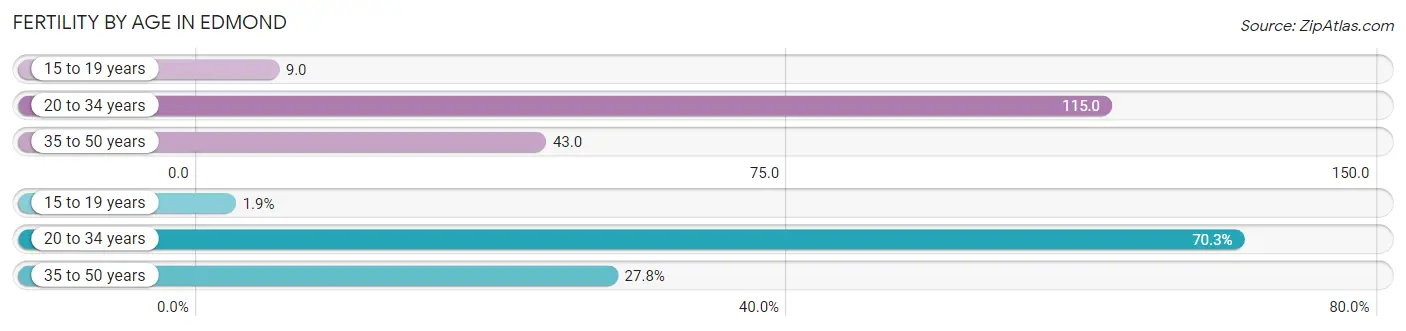
| Age Bracket | Women with Births | Births / 1,000 Women |
| 15 to 19 years | 28 (1.9%) | 9.0 |
| 20 to 34 years | 1,047 (70.3%) | 115.0 |
| 35 to 50 years | 414 (27.8%) | 43.0 |
| Total | 1,489 (100.0%) | 68.0 |
Fertility by Age by Marriage Status in Edmond
85.8% of women with births (1,489) in Edmond are married. The highest percentage of unmarried women with births falls into 15 to 19 years age bracket with 100.0% of them unmarried at the time of birth, while the lowest percentage of unmarried women with births belong to 35 to 50 years age bracket with 5.8% of them unmarried.
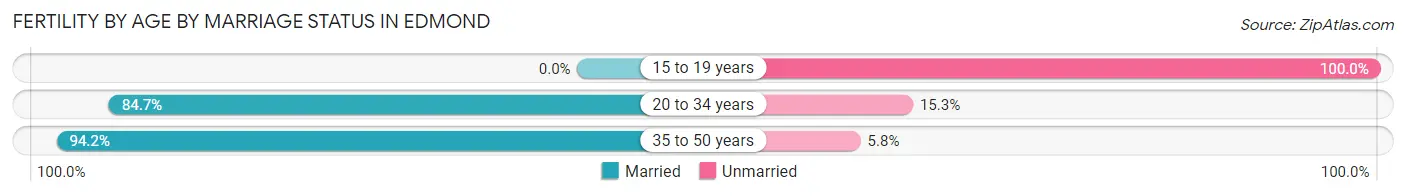
| Age Bracket | Married | Unmarried |
| 15 to 19 years | 0 (0.0%) | 28 (100.0%) |
| 20 to 34 years | 887 (84.7%) | 160 (15.3%) |
| 35 to 50 years | 390 (94.2%) | 24 (5.8%) |
| Total | 1,278 (85.8%) | 211 (14.2%) |
Fertility by Education in Edmond
Average fertility rate in Edmond is 68.0 births per 1,000 women. Women with the education attainment of bachelor's degree have the highest fertility rate of 97.0 births per 1,000 women, while women with the education attainment of less than high school have the lowest fertility at 20.0 births per 1,000 women. Women with the education attainment of bachelor's degree represent 45.6% of all women with births.
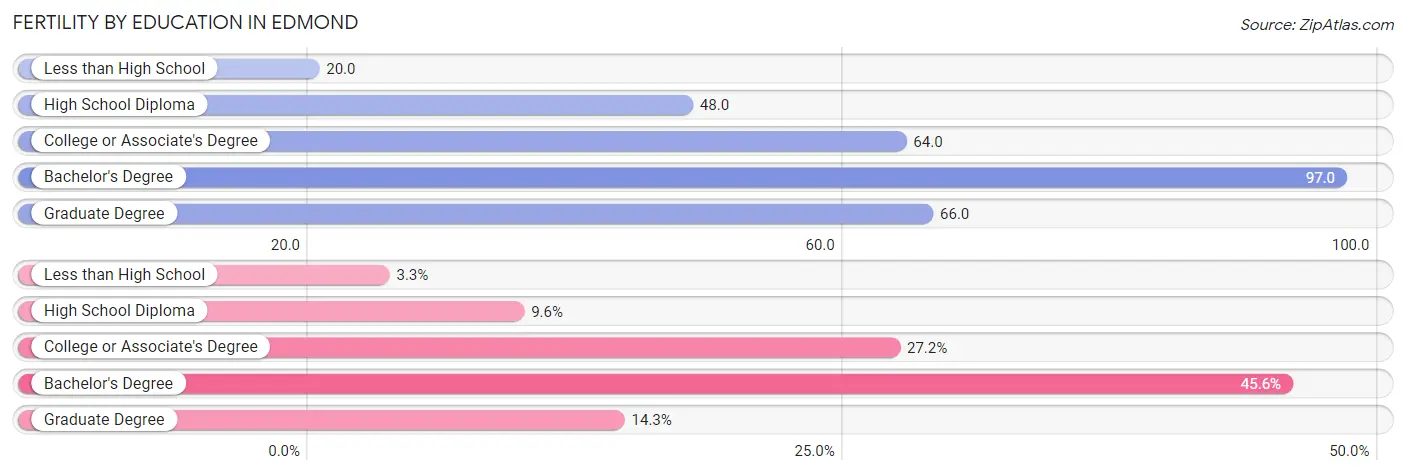
| Educational Attainment | Women with Births | Births / 1,000 Women |
| Less than High School | 49 (3.3%) | 20.0 |
| High School Diploma | 143 (9.6%) | 48.0 |
| College or Associate's Degree | 405 (27.2%) | 64.0 |
| Bachelor's Degree | 679 (45.6%) | 97.0 |
| Graduate Degree | 213 (14.3%) | 66.0 |
| Total | 1,489 (100.0%) | 68.0 |
Fertility by Education by Marriage Status in Edmond
14.2% of women with births in Edmond are unmarried. Women with the educational attainment of bachelor's degree are most likely to be married with 100.0% of them married at childbirth, while women with the educational attainment of less than high school are least likely to be married with 57.1% of them unmarried at childbirth.
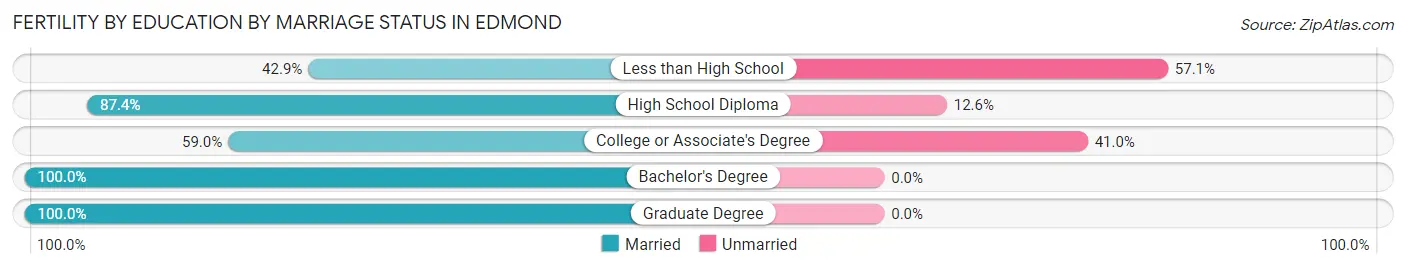
| Educational Attainment | Married | Unmarried |
| Less than High School | 21 (42.9%) | 28 (57.1%) |
| High School Diploma | 125 (87.4%) | 18 (12.6%) |
| College or Associate's Degree | 239 (59.0%) | 166 (41.0%) |
| Bachelor's Degree | 679 (100.0%) | 0 (0.0%) |
| Graduate Degree | 213 (100.0%) | 0 (0.0%) |
| Total | 1,278 (85.8%) | 211 (14.2%) |
Employment Characteristics in Edmond
Employment by Class of Employer in Edmond
Among the 46,443 employed individuals in Edmond, private company employees (28,104 | 60.5%), not-for-profit organizations (4,066 | 8.7%), and state government employees (3,288 | 7.1%) make up the most common classes of employment.
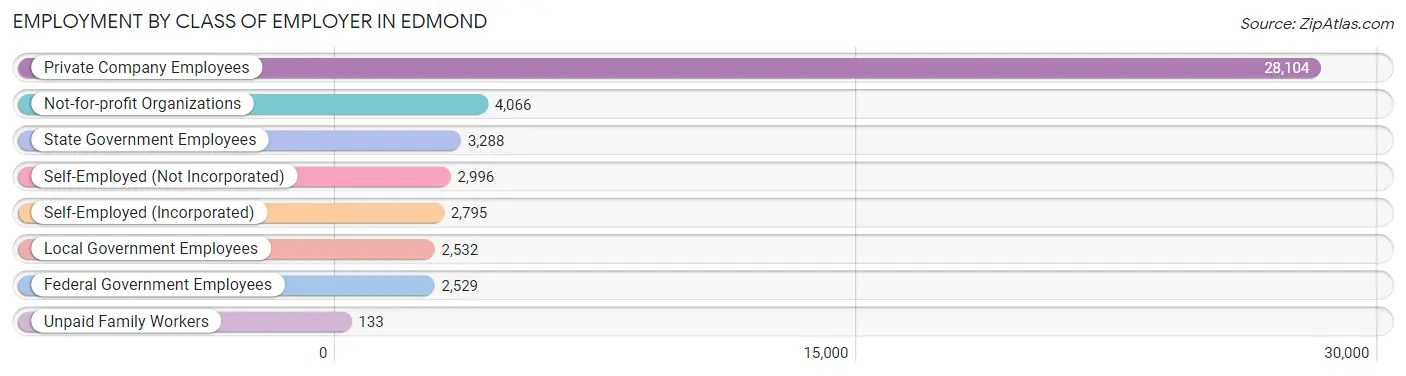
| Employer Class | # Employees | % Employees |
| Private Company Employees | 28,104 | 60.5% |
| Self-Employed (Incorporated) | 2,795 | 6.0% |
| Self-Employed (Not Incorporated) | 2,996 | 6.5% |
| Not-for-profit Organizations | 4,066 | 8.7% |
| Local Government Employees | 2,532 | 5.4% |
| State Government Employees | 3,288 | 7.1% |
| Federal Government Employees | 2,529 | 5.4% |
| Unpaid Family Workers | 133 | 0.3% |
| Total | 46,443 | 100.0% |
Employment Status by Age in Edmond
According to the labor force statistics for Edmond, out of the total population over 16 years of age (73,546), 66.5% or 48,908 individuals are in the labor force, with 3.5% or 1,712 of them unemployed. The age group with the highest labor force participation rate is 35 to 44 years, with 85.9% or 10,132 individuals in the labor force. Within the labor force, the 16 to 19 years age range has the highest percentage of unemployed individuals, with 15.9% or 388 of them being unemployed.
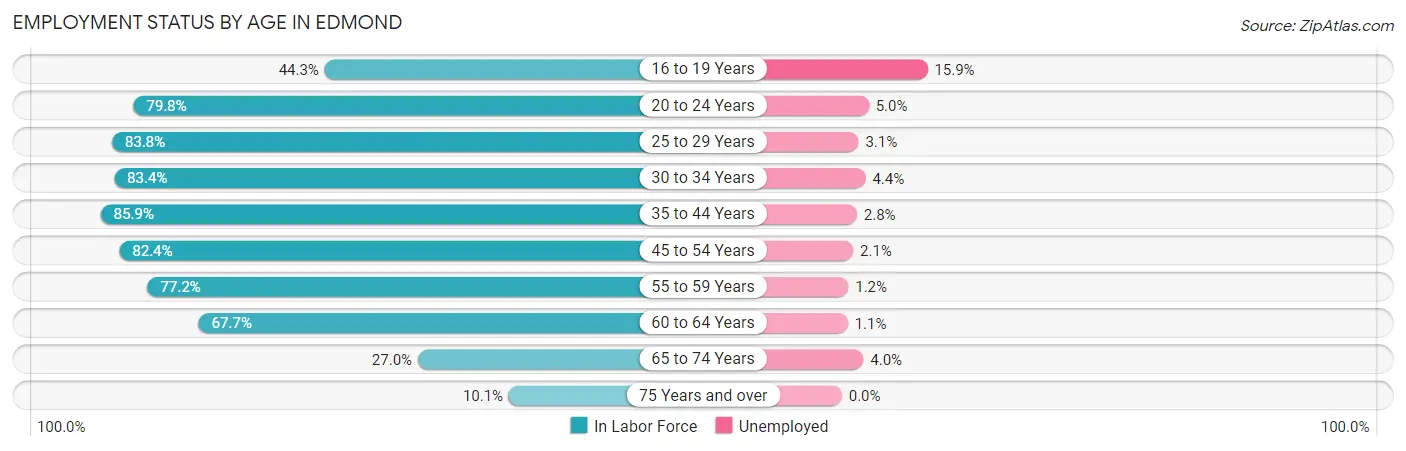
| Age Bracket | In Labor Force | Unemployed |
| 16 to 19 Years | 2,440 (44.3%) | 388 (15.9%) |
| 20 to 24 Years | 5,475 (79.8%) | 274 (5.0%) |
| 25 to 29 Years | 4,441 (83.8%) | 138 (3.1%) |
| 30 to 34 Years | 4,903 (83.4%) | 216 (4.4%) |
| 35 to 44 Years | 10,132 (85.9%) | 284 (2.8%) |
| 45 to 54 Years | 9,772 (82.4%) | 205 (2.1%) |
| 55 to 59 Years | 4,744 (77.2%) | 57 (1.2%) |
| 60 to 64 Years | 3,994 (67.7%) | 44 (1.1%) |
| 65 to 74 Years | 2,470 (27.0%) | 99 (4.0%) |
| 75 Years and over | 520 (10.1%) | 0 (0.0%) |
| Total | 48,908 (66.5%) | 1,712 (3.5%) |
Employment Status by Educational Attainment in Edmond
According to labor force statistics for Edmond, 81.0% of individuals (37,970) out of the total population between 25 and 64 years of age (46,877) are in the labor force, with 2.5% or 949 of them being unemployed. The group with the highest labor force participation rate are those with the educational attainment of bachelor's degree or higher, with 84.8% or 22,467 individuals in the labor force. Within the labor force, individuals with high school diploma education have the highest percentage of unemployment, with 5.4% or 269 of them being unemployed.
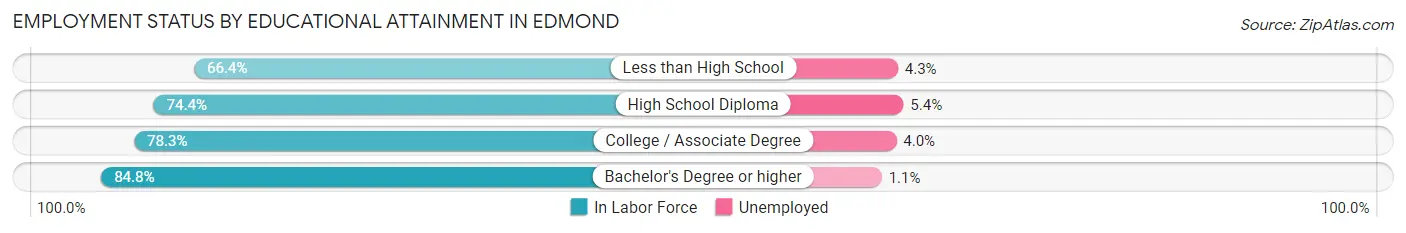
| Educational Attainment | In Labor Force | Unemployed |
| Less than High School | 989 (66.4%) | 64 (4.3%) |
| High School Diploma | 4,989 (74.4%) | 362 (5.4%) |
| College / Associate Degree | 9,544 (78.3%) | 488 (4.0%) |
| Bachelor's Degree or higher | 22,467 (84.8%) | 291 (1.1%) |
| Total | 37,970 (81.0%) | 1,172 (2.5%) |
Employment Occupations by Sex in Edmond
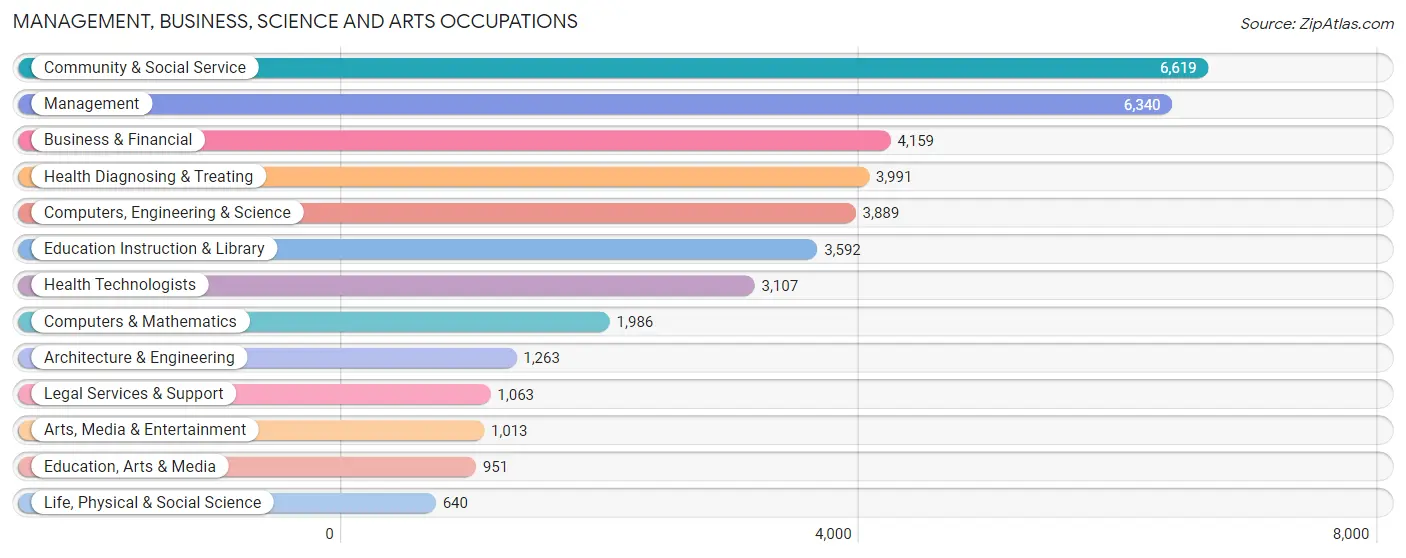
Management, Business, Science and Arts Occupations
The most common Management, Business, Science and Arts occupations in Edmond are Community & Social Service (6,619 | 14.1%), Management (6,340 | 13.5%), Business & Financial (4,159 | 8.9%), Health Diagnosing & Treating (3,991 | 8.5%), and Computers, Engineering & Science (3,889 | 8.3%).
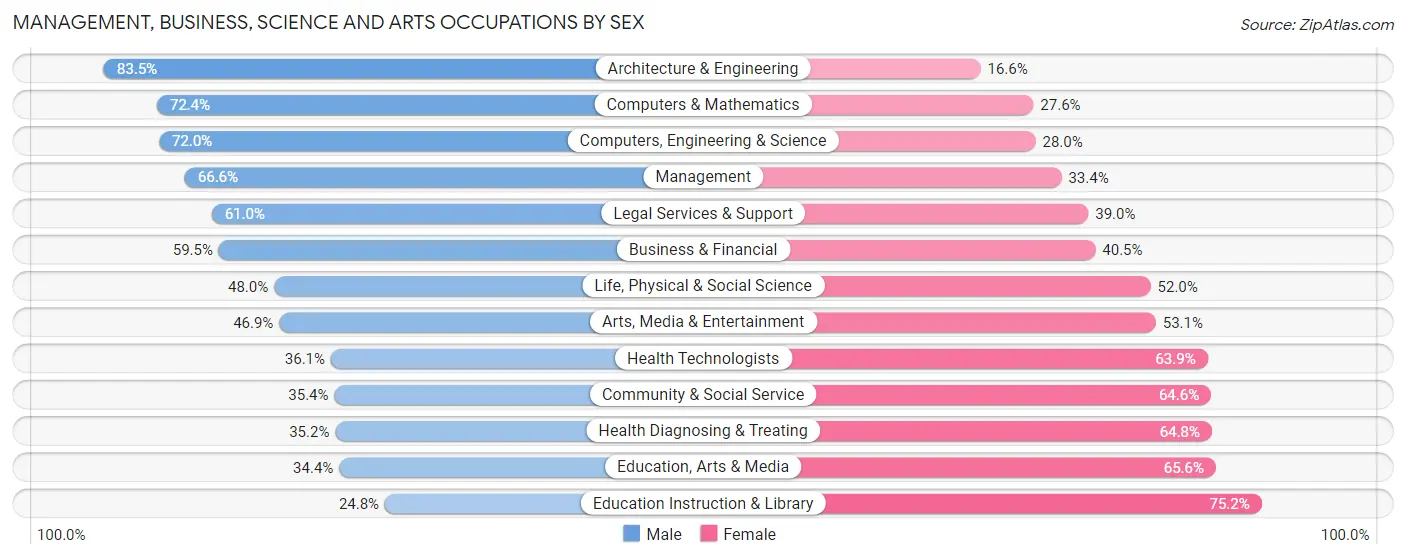
Management, Business, Science and Arts Occupations by Sex
Within the Management, Business, Science and Arts occupations in Edmond, the most male-oriented occupations are Architecture & Engineering (83.5%), Computers & Mathematics (72.4%), and Computers, Engineering & Science (72.0%), while the most female-oriented occupations are Education Instruction & Library (75.2%), Education, Arts & Media (65.6%), and Health Diagnosing & Treating (64.8%).
| Occupation | Male | Female |
| Management | 4,220 (66.6%) | 2,120 (33.4%) |
| Business & Financial | 2,474 (59.5%) | 1,685 (40.5%) |
| Computers, Engineering & Science | 2,799 (72.0%) | 1,090 (28.0%) |
| Computers & Mathematics | 1,438 (72.4%) | 548 (27.6%) |
| Architecture & Engineering | 1,054 (83.5%) | 209 (16.6%) |
| Life, Physical & Social Science | 307 (48.0%) | 333 (52.0%) |
| Community & Social Service | 2,342 (35.4%) | 4,277 (64.6%) |
| Education, Arts & Media | 327 (34.4%) | 624 (65.6%) |
| Legal Services & Support | 648 (61.0%) | 415 (39.0%) |
| Education Instruction & Library | 892 (24.8%) | 2,700 (75.2%) |
| Arts, Media & Entertainment | 475 (46.9%) | 538 (53.1%) |
| Health Diagnosing & Treating | 1,405 (35.2%) | 2,586 (64.8%) |
| Health Technologists | 1,122 (36.1%) | 1,985 (63.9%) |
| Total (Category) | 13,240 (53.0%) | 11,758 (47.0%) |
| Total (Overall) | 24,960 (53.2%) | 21,923 (46.8%) |
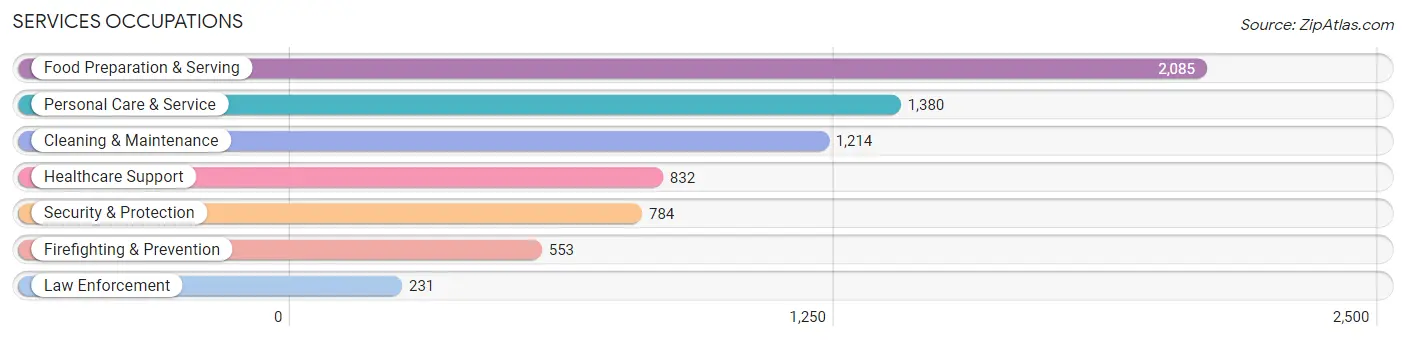
Services Occupations
The most common Services occupations in Edmond are Food Preparation & Serving (2,085 | 4.4%), Personal Care & Service (1,380 | 2.9%), Cleaning & Maintenance (1,214 | 2.6%), Healthcare Support (832 | 1.8%), and Security & Protection (784 | 1.7%).
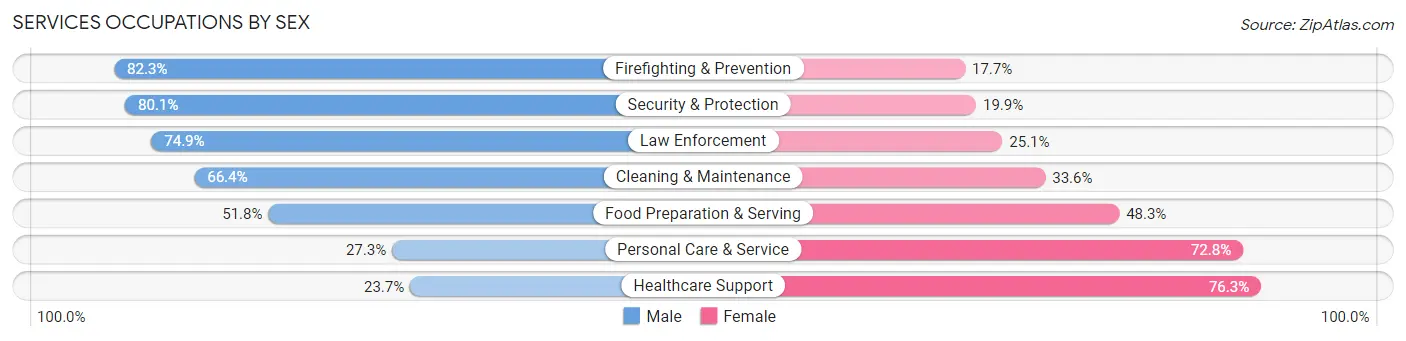
Services Occupations by Sex
Within the Services occupations in Edmond, the most male-oriented occupations are Firefighting & Prevention (82.3%), Security & Protection (80.1%), and Law Enforcement (74.9%), while the most female-oriented occupations are Healthcare Support (76.3%), Personal Care & Service (72.8%), and Food Preparation & Serving (48.2%).
| Occupation | Male | Female |
| Healthcare Support | 197 (23.7%) | 635 (76.3%) |
| Security & Protection | 628 (80.1%) | 156 (19.9%) |
| Firefighting & Prevention | 455 (82.3%) | 98 (17.7%) |
| Law Enforcement | 173 (74.9%) | 58 (25.1%) |
| Food Preparation & Serving | 1,079 (51.7%) | 1,006 (48.2%) |
| Cleaning & Maintenance | 806 (66.4%) | 408 (33.6%) |
| Personal Care & Service | 376 (27.3%) | 1,004 (72.8%) |
| Total (Category) | 3,086 (49.0%) | 3,209 (51.0%) |
| Total (Overall) | 24,960 (53.2%) | 21,923 (46.8%) |
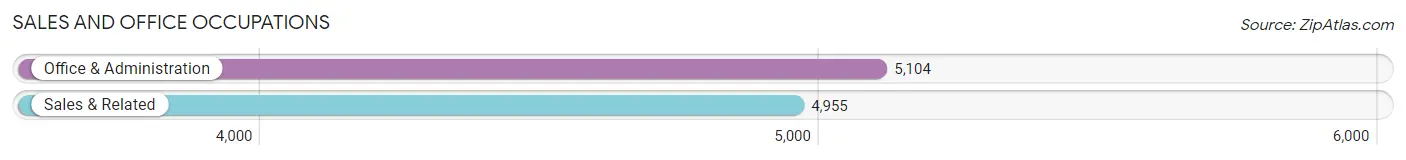
Sales and Office Occupations
The most common Sales and Office occupations in Edmond are Office & Administration (5,104 | 10.9%), and Sales & Related (4,955 | 10.6%).
Sales and Office Occupations by Sex
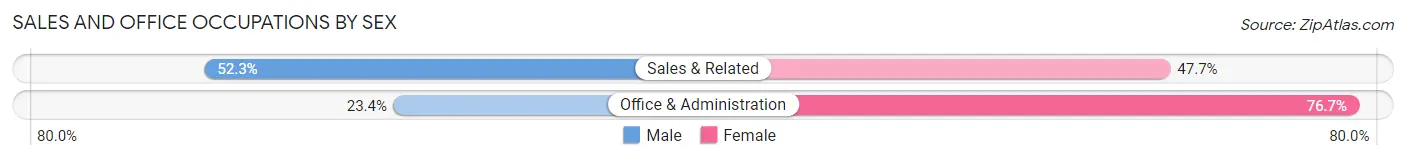
| Occupation | Male | Female |
| Sales & Related | 2,593 (52.3%) | 2,362 (47.7%) |
| Office & Administration | 1,192 (23.4%) | 3,912 (76.6%) |
| Total (Category) | 3,785 (37.6%) | 6,274 (62.4%) |
| Total (Overall) | 24,960 (53.2%) | 21,923 (46.8%) |
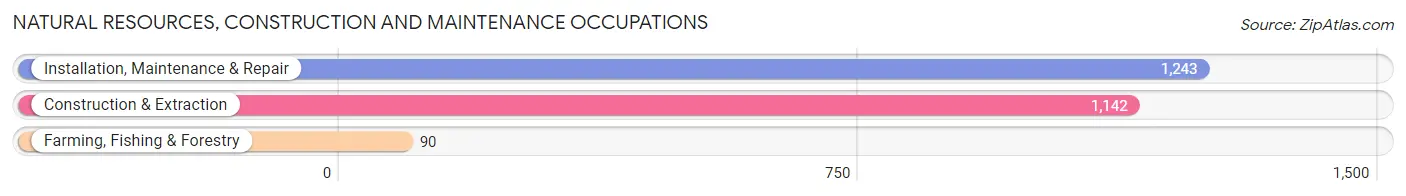
Natural Resources, Construction and Maintenance Occupations
The most common Natural Resources, Construction and Maintenance occupations in Edmond are Installation, Maintenance & Repair (1,243 | 2.6%), Construction & Extraction (1,142 | 2.4%), and Farming, Fishing & Forestry (90 | 0.2%).
Natural Resources, Construction and Maintenance Occupations by Sex
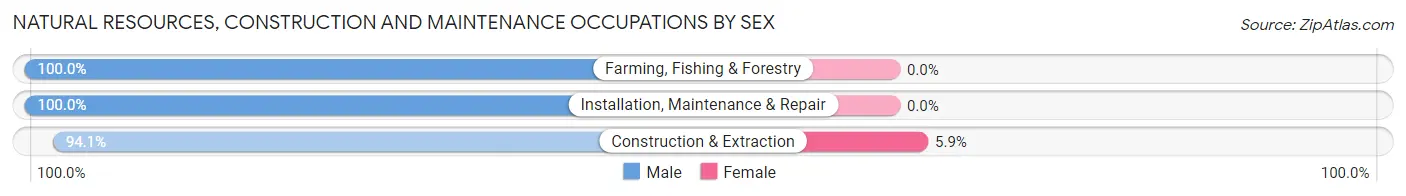
| Occupation | Male | Female |
| Farming, Fishing & Forestry | 90 (100.0%) | 0 (0.0%) |
| Construction & Extraction | 1,075 (94.1%) | 67 (5.9%) |
| Installation, Maintenance & Repair | 1,243 (100.0%) | 0 (0.0%) |
| Total (Category) | 2,408 (97.3%) | 67 (2.7%) |
| Total (Overall) | 24,960 (53.2%) | 21,923 (46.8%) |
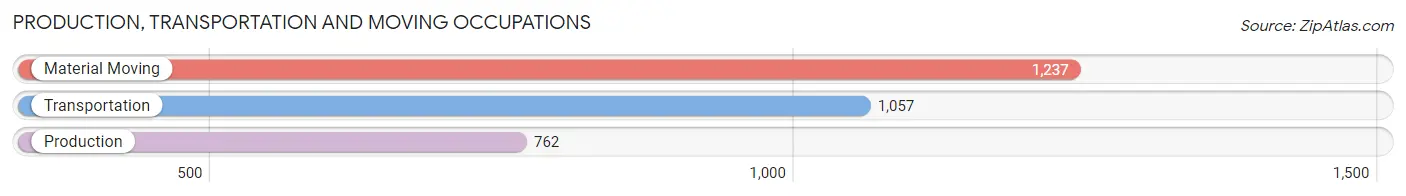
Production, Transportation and Moving Occupations
The most common Production, Transportation and Moving occupations in Edmond are Material Moving (1,237 | 2.6%), Transportation (1,057 | 2.2%), and Production (762 | 1.6%).
Production, Transportation and Moving Occupations by Sex
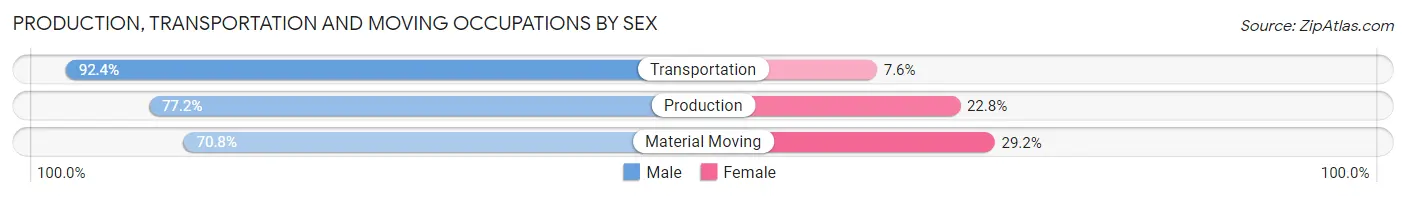
| Occupation | Male | Female |
| Production | 588 (77.2%) | 174 (22.8%) |
| Transportation | 977 (92.4%) | 80 (7.6%) |
| Material Moving | 876 (70.8%) | 361 (29.2%) |
| Total (Category) | 2,441 (79.9%) | 615 (20.1%) |
| Total (Overall) | 24,960 (53.2%) | 21,923 (46.8%) |
Employment Industries by Sex in Edmond
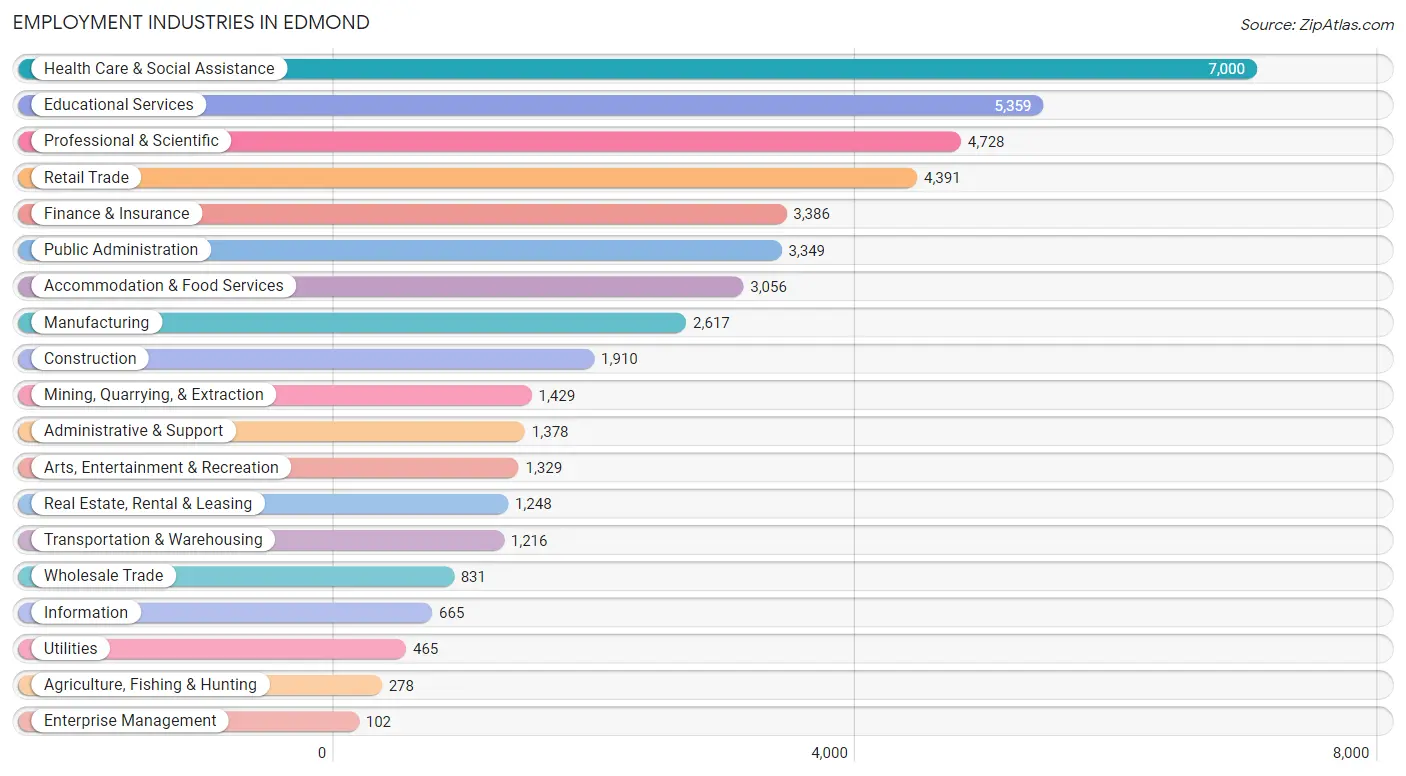
Employment Industries in Edmond
The major employment industries in Edmond include Health Care & Social Assistance (7,000 | 14.9%), Educational Services (5,359 | 11.4%), Professional & Scientific (4,728 | 10.1%), Retail Trade (4,391 | 9.4%), and Finance & Insurance (3,386 | 7.2%).
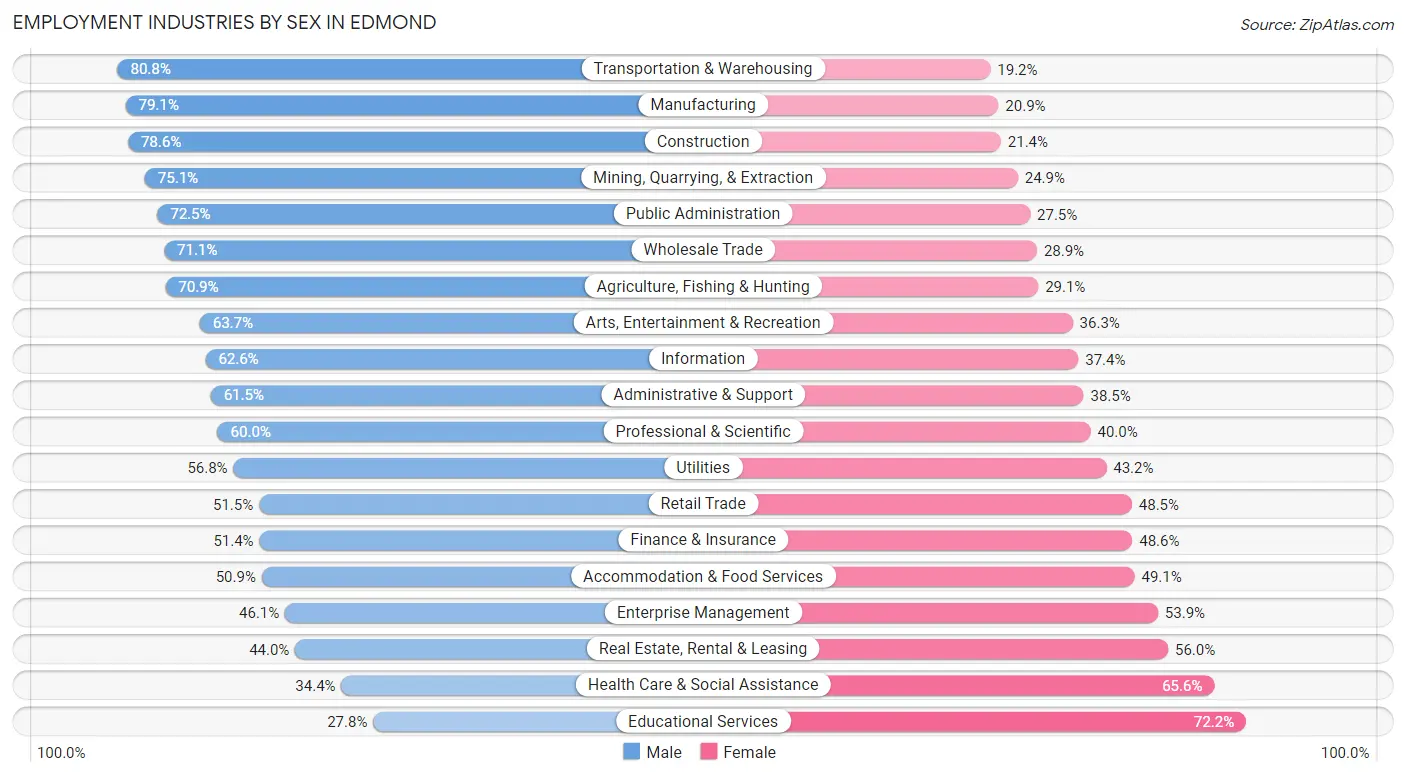
Employment Industries by Sex in Edmond
The Edmond industries that see more men than women are Transportation & Warehousing (80.8%), Manufacturing (79.1%), and Construction (78.6%), whereas the industries that tend to have a higher number of women are Educational Services (72.2%), Health Care & Social Assistance (65.6%), and Real Estate, Rental & Leasing (56.0%).
| Industry | Male | Female |
| Agriculture, Fishing & Hunting | 197 (70.9%) | 81 (29.1%) |
| Mining, Quarrying, & Extraction | 1,073 (75.1%) | 356 (24.9%) |
| Construction | 1,501 (78.6%) | 409 (21.4%) |
| Manufacturing | 2,070 (79.1%) | 547 (20.9%) |
| Wholesale Trade | 591 (71.1%) | 240 (28.9%) |
| Retail Trade | 2,260 (51.5%) | 2,131 (48.5%) |
| Transportation & Warehousing | 982 (80.8%) | 234 (19.2%) |
| Utilities | 264 (56.8%) | 201 (43.2%) |
| Information | 416 (62.6%) | 249 (37.4%) |
| Finance & Insurance | 1,740 (51.4%) | 1,646 (48.6%) |
| Real Estate, Rental & Leasing | 549 (44.0%) | 699 (56.0%) |
| Professional & Scientific | 2,838 (60.0%) | 1,890 (40.0%) |
| Enterprise Management | 47 (46.1%) | 55 (53.9%) |
| Administrative & Support | 847 (61.5%) | 531 (38.5%) |
| Educational Services | 1,492 (27.8%) | 3,867 (72.2%) |
| Health Care & Social Assistance | 2,410 (34.4%) | 4,590 (65.6%) |
| Arts, Entertainment & Recreation | 847 (63.7%) | 482 (36.3%) |
| Accommodation & Food Services | 1,556 (50.9%) | 1,500 (49.1%) |
| Public Administration | 2,429 (72.5%) | 920 (27.5%) |
| Total | 24,960 (53.2%) | 21,923 (46.8%) |
Education in Edmond
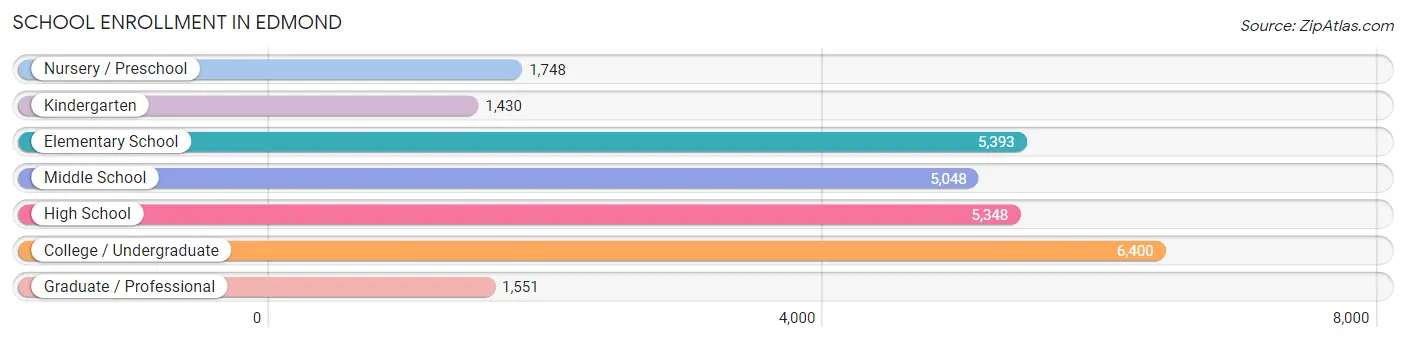
School Enrollment in Edmond
The most common levels of schooling among the 26,918 students in Edmond are college / undergraduate (6,400 | 23.8%), elementary school (5,393 | 20.0%), and high school (5,348 | 19.9%).
| School Level | # Students | % Students |
| Nursery / Preschool | 1,748 | 6.5% |
| Kindergarten | 1,430 | 5.3% |
| Elementary School | 5,393 | 20.0% |
| Middle School | 5,048 | 18.8% |
| High School | 5,348 | 19.9% |
| College / Undergraduate | 6,400 | 23.8% |
| Graduate / Professional | 1,551 | 5.8% |
| Total | 26,918 | 100.0% |
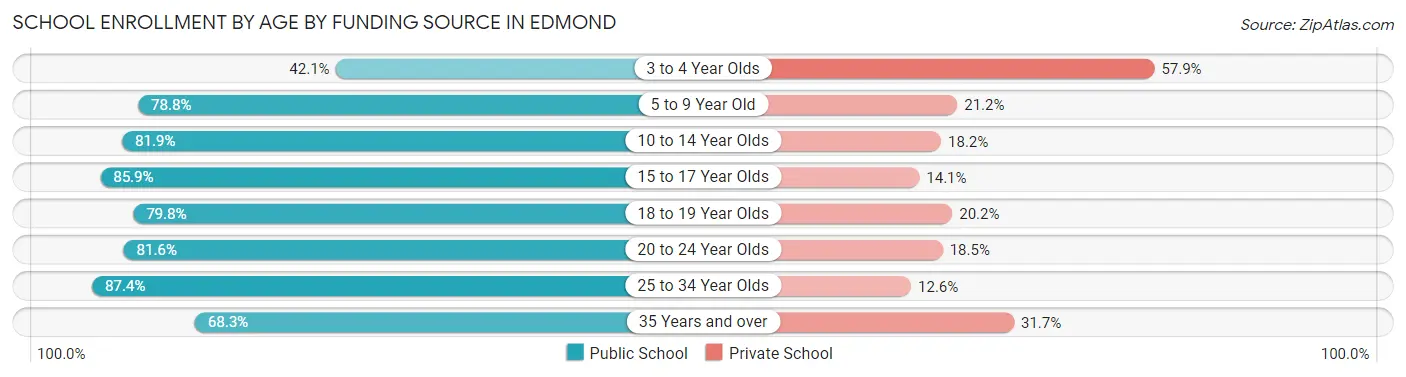
School Enrollment by Age by Funding Source in Edmond
Out of a total of 26,918 students who are enrolled in schools in Edmond, 5,599 (20.8%) attend a private institution, while the remaining 21,319 (79.2%) are enrolled in public schools. The age group of 3 to 4 year olds has the highest likelihood of being enrolled in private schools, with 756 (57.9% in the age bracket) enrolled. Conversely, the age group of 25 to 34 year olds has the lowest likelihood of being enrolled in a private school, with 1,358 (87.4% in the age bracket) attending a public institution.
| Age Bracket | Public School | Private School |
| 3 to 4 Year Olds | 550 (42.1%) | 756 (57.9%) |
| 5 to 9 Year Old | 4,959 (78.8%) | 1,331 (21.2%) |
| 10 to 14 Year Olds | 5,341 (81.9%) | 1,184 (18.1%) |
| 15 to 17 Year Olds | 3,437 (85.9%) | 564 (14.1%) |
| 18 to 19 Year Olds | 1,675 (79.8%) | 425 (20.2%) |
| 20 to 24 Year Olds | 2,940 (81.6%) | 665 (18.4%) |
| 25 to 34 Year Olds | 1,358 (87.4%) | 195 (12.6%) |
| 35 Years and over | 1,050 (68.3%) | 488 (31.7%) |
| Total | 21,319 (79.2%) | 5,599 (20.8%) |
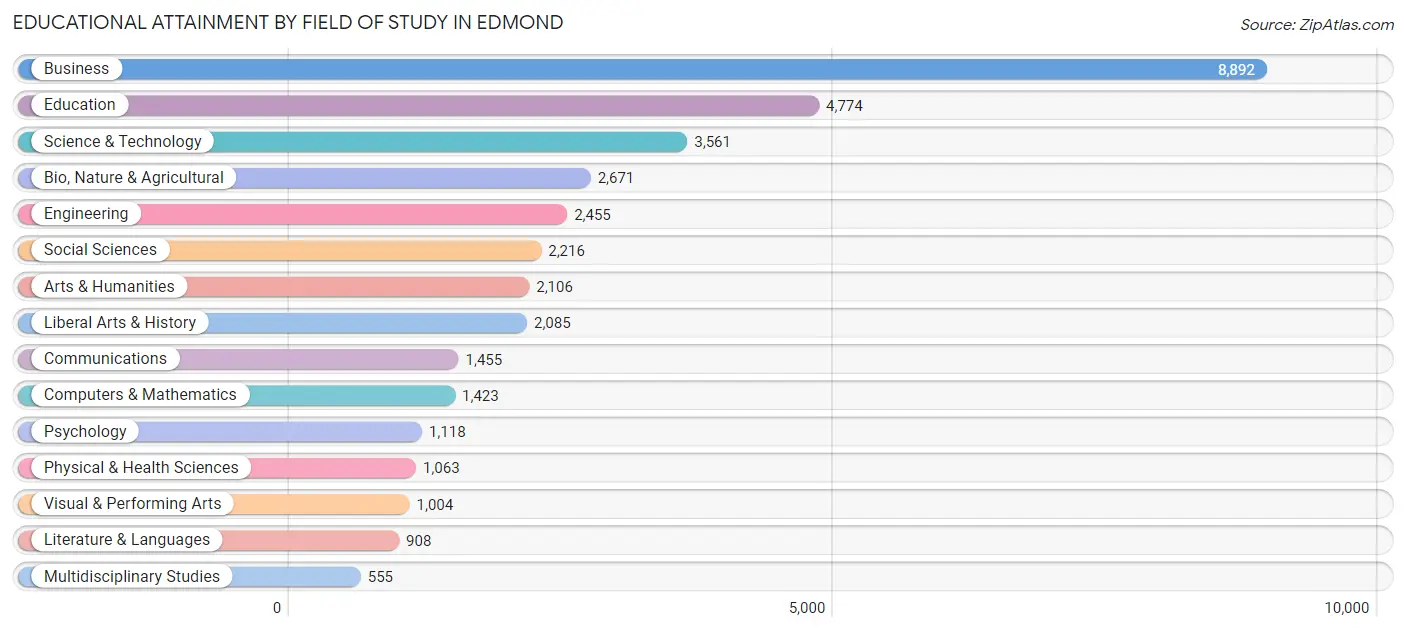
Educational Attainment by Field of Study in Edmond
Business (8,892 | 24.5%), education (4,774 | 13.2%), science & technology (3,561 | 9.8%), bio, nature & agricultural (2,671 | 7.4%), and engineering (2,455 | 6.8%) are the most common fields of study among 36,286 individuals in Edmond who have obtained a bachelor's degree or higher.
| Field of Study | # Graduates | % Graduates |
| Computers & Mathematics | 1,423 | 3.9% |
| Bio, Nature & Agricultural | 2,671 | 7.4% |
| Physical & Health Sciences | 1,063 | 2.9% |
| Psychology | 1,118 | 3.1% |
| Social Sciences | 2,216 | 6.1% |
| Engineering | 2,455 | 6.8% |
| Multidisciplinary Studies | 555 | 1.5% |
| Science & Technology | 3,561 | 9.8% |
| Business | 8,892 | 24.5% |
| Education | 4,774 | 13.2% |
| Literature & Languages | 908 | 2.5% |
| Liberal Arts & History | 2,085 | 5.8% |
| Visual & Performing Arts | 1,004 | 2.8% |
| Communications | 1,455 | 4.0% |
| Arts & Humanities | 2,106 | 5.8% |
| Total | 36,286 | 100.0% |
Transportation & Commute in Edmond
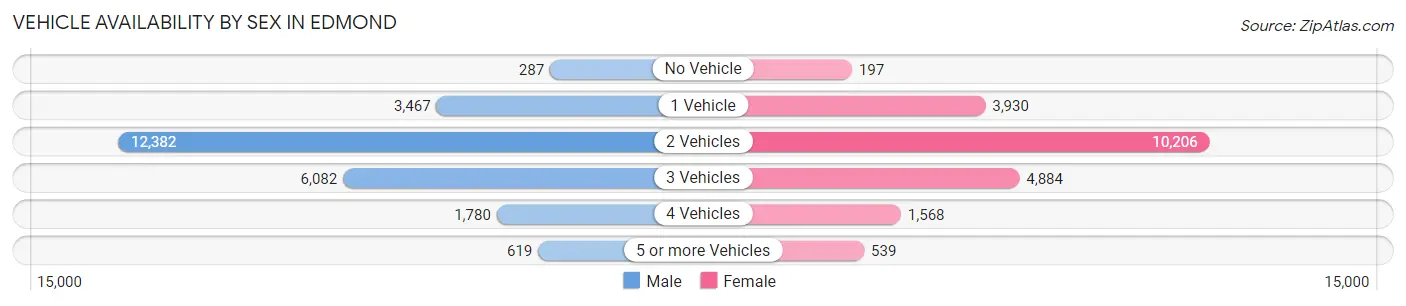
Vehicle Availability by Sex in Edmond
The most prevalent vehicle ownership categories in Edmond are males with 2 vehicles (12,382, accounting for 50.3%) and females with 2 vehicles (10,206, making up 58.1%).
| Vehicles Available | Male | Female |
| No Vehicle | 287 (1.2%) | 197 (0.9%) |
| 1 Vehicle | 3,467 (14.1%) | 3,930 (18.4%) |
| 2 Vehicles | 12,382 (50.3%) | 10,206 (47.9%) |
| 3 Vehicles | 6,082 (24.7%) | 4,884 (22.9%) |
| 4 Vehicles | 1,780 (7.2%) | 1,568 (7.3%) |
| 5 or more Vehicles | 619 (2.5%) | 539 (2.5%) |
| Total | 24,617 (100.0%) | 21,324 (100.0%) |
Commute Time in Edmond
The most frequently occuring commute durations in Edmond are 30 to 34 minutes (7,473 commuters, 18.1%), 20 to 24 minutes (7,065 commuters, 17.2%), and 15 to 19 minutes (6,828 commuters, 16.6%).
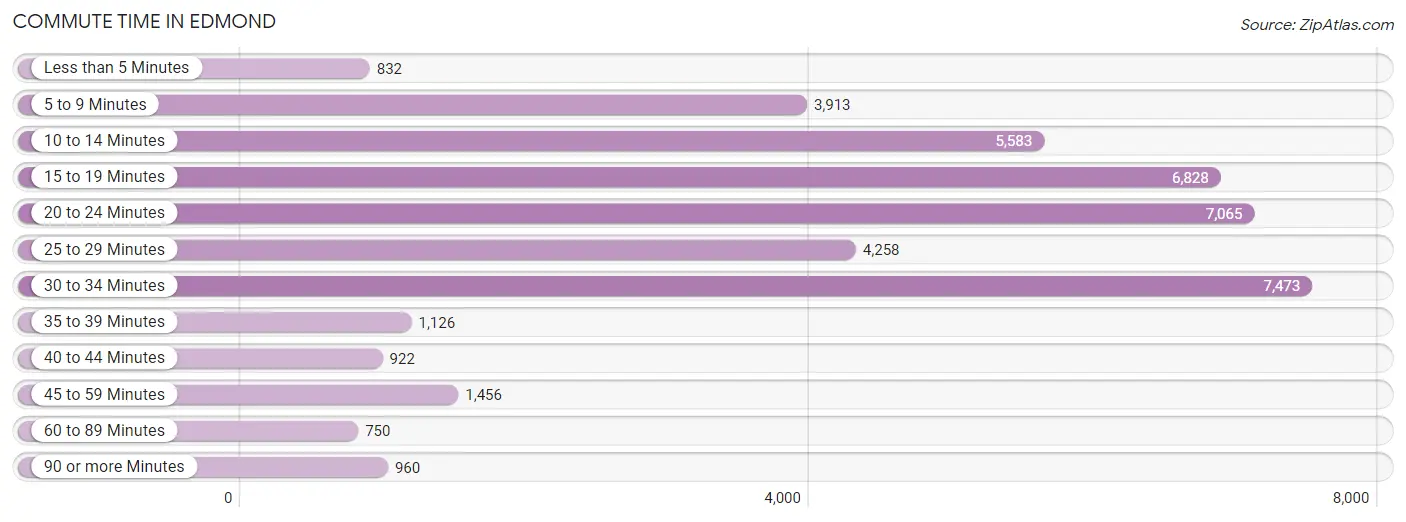
| Commute Time | # Commuters | % Commuters |
| Less than 5 Minutes | 832 | 2.0% |
| 5 to 9 Minutes | 3,913 | 9.5% |
| 10 to 14 Minutes | 5,583 | 13.6% |
| 15 to 19 Minutes | 6,828 | 16.6% |
| 20 to 24 Minutes | 7,065 | 17.2% |
| 25 to 29 Minutes | 4,258 | 10.3% |
| 30 to 34 Minutes | 7,473 | 18.1% |
| 35 to 39 Minutes | 1,126 | 2.7% |
| 40 to 44 Minutes | 922 | 2.2% |
| 45 to 59 Minutes | 1,456 | 3.5% |
| 60 to 89 Minutes | 750 | 1.8% |
| 90 or more Minutes | 960 | 2.3% |
Commute Time by Sex in Edmond
The most common commute times in Edmond are 30 to 34 minutes (4,299 commuters, 19.5%) for males and 20 to 24 minutes (3,280 commuters, 17.2%) for females.
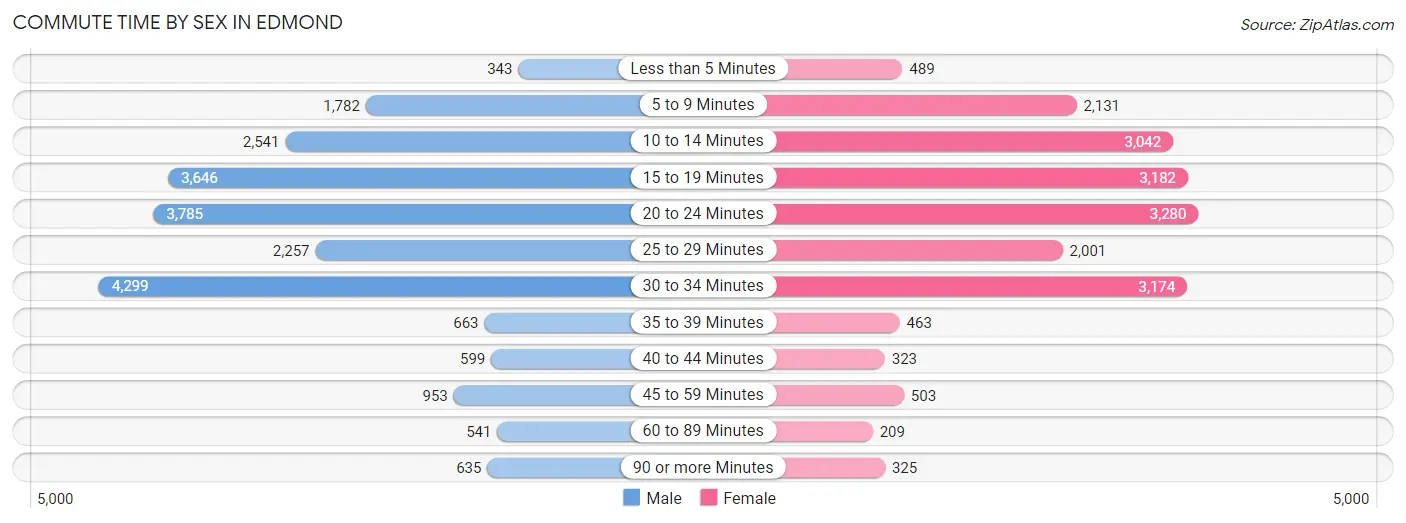
| Commute Time | Male | Female |
| Less than 5 Minutes | 343 (1.6%) | 489 (2.6%) |
| 5 to 9 Minutes | 1,782 (8.1%) | 2,131 (11.1%) |
| 10 to 14 Minutes | 2,541 (11.5%) | 3,042 (15.9%) |
| 15 to 19 Minutes | 3,646 (16.5%) | 3,182 (16.6%) |
| 20 to 24 Minutes | 3,785 (17.2%) | 3,280 (17.2%) |
| 25 to 29 Minutes | 2,257 (10.2%) | 2,001 (10.5%) |
| 30 to 34 Minutes | 4,299 (19.5%) | 3,174 (16.6%) |
| 35 to 39 Minutes | 663 (3.0%) | 463 (2.4%) |
| 40 to 44 Minutes | 599 (2.7%) | 323 (1.7%) |
| 45 to 59 Minutes | 953 (4.3%) | 503 (2.6%) |
| 60 to 89 Minutes | 541 (2.5%) | 209 (1.1%) |
| 90 or more Minutes | 635 (2.9%) | 325 (1.7%) |
Time of Departure to Work by Sex in Edmond
The most frequent times of departure to work in Edmond are 7:00 AM to 7:29 AM (3,515, 16.0%) for males and 7:30 AM to 7:59 AM (3,426, 17.9%) for females.
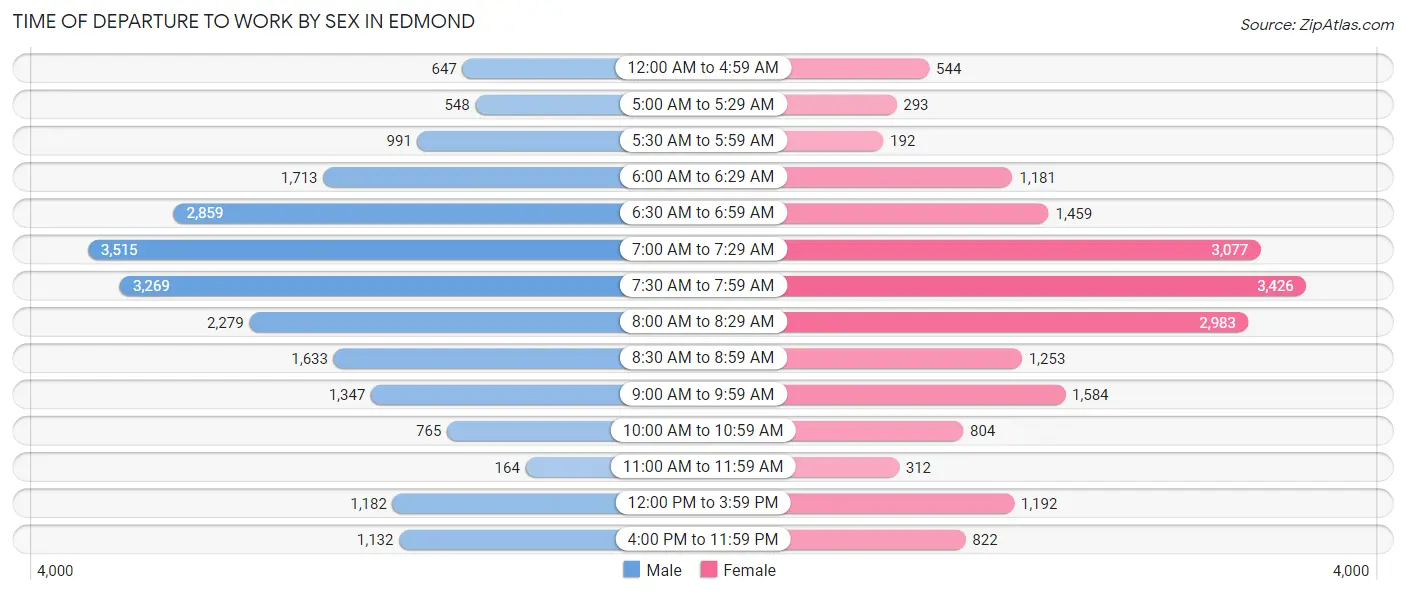
| Time of Departure | Male | Female |
| 12:00 AM to 4:59 AM | 647 (2.9%) | 544 (2.8%) |
| 5:00 AM to 5:29 AM | 548 (2.5%) | 293 (1.5%) |
| 5:30 AM to 5:59 AM | 991 (4.5%) | 192 (1.0%) |
| 6:00 AM to 6:29 AM | 1,713 (7.8%) | 1,181 (6.2%) |
| 6:30 AM to 6:59 AM | 2,859 (13.0%) | 1,459 (7.6%) |
| 7:00 AM to 7:29 AM | 3,515 (16.0%) | 3,077 (16.1%) |
| 7:30 AM to 7:59 AM | 3,269 (14.8%) | 3,426 (17.9%) |
| 8:00 AM to 8:29 AM | 2,279 (10.3%) | 2,983 (15.6%) |
| 8:30 AM to 8:59 AM | 1,633 (7.4%) | 1,253 (6.6%) |
| 9:00 AM to 9:59 AM | 1,347 (6.1%) | 1,584 (8.3%) |
| 10:00 AM to 10:59 AM | 765 (3.5%) | 804 (4.2%) |
| 11:00 AM to 11:59 AM | 164 (0.7%) | 312 (1.6%) |
| 12:00 PM to 3:59 PM | 1,182 (5.4%) | 1,192 (6.2%) |
| 4:00 PM to 11:59 PM | 1,132 (5.1%) | 822 (4.3%) |
| Total | 22,044 (100.0%) | 19,122 (100.0%) |
Housing Occupancy in Edmond
Occupancy by Ownership in Edmond
Of the total 35,985 dwellings in Edmond, owner-occupied units account for 25,293 (70.3%), while renter-occupied units make up 10,692 (29.7%).
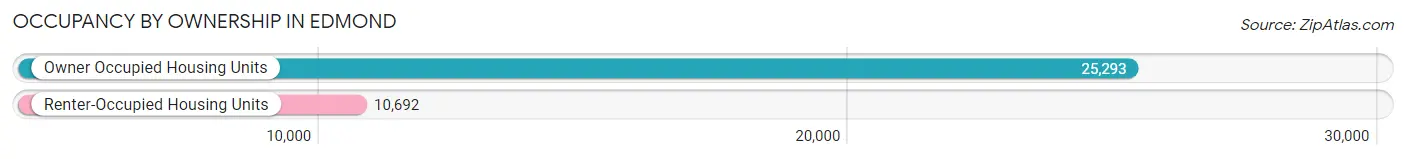
| Occupancy | # Housing Units | % Housing Units |
| Owner Occupied Housing Units | 25,293 | 70.3% |
| Renter-Occupied Housing Units | 10,692 | 29.7% |
| Total Occupied Housing Units | 35,985 | 100.0% |
Occupancy by Household Size in Edmond
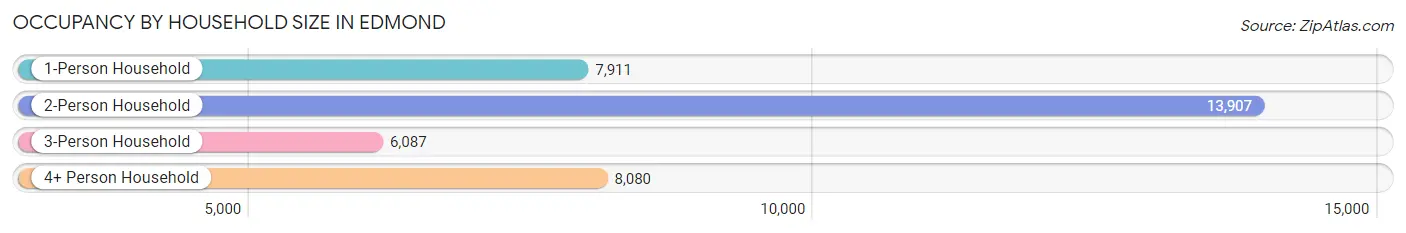
| Household Size | # Housing Units | % Housing Units |
| 1-Person Household | 7,911 | 22.0% |
| 2-Person Household | 13,907 | 38.7% |
| 3-Person Household | 6,087 | 16.9% |
| 4+ Person Household | 8,080 | 22.5% |
| Total Housing Units | 35,985 | 100.0% |
Occupancy by Ownership by Household Size in Edmond
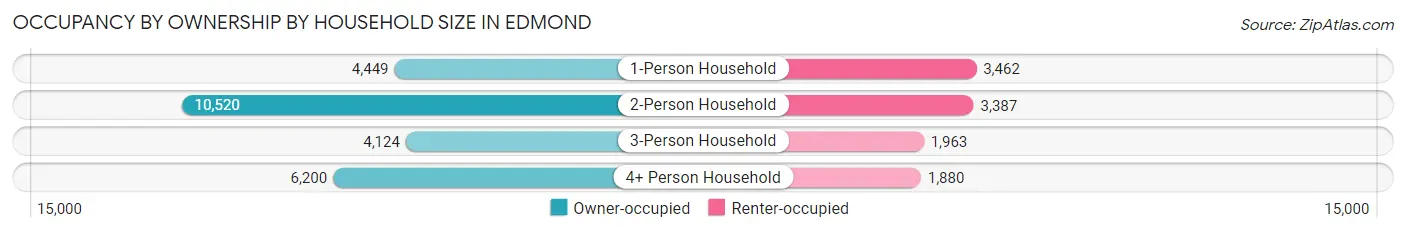
| Household Size | Owner-occupied | Renter-occupied |
| 1-Person Household | 4,449 (56.2%) | 3,462 (43.8%) |
| 2-Person Household | 10,520 (75.6%) | 3,387 (24.3%) |
| 3-Person Household | 4,124 (67.7%) | 1,963 (32.3%) |
| 4+ Person Household | 6,200 (76.7%) | 1,880 (23.3%) |
| Total Housing Units | 25,293 (70.3%) | 10,692 (29.7%) |
Occupancy by Educational Attainment in Edmond
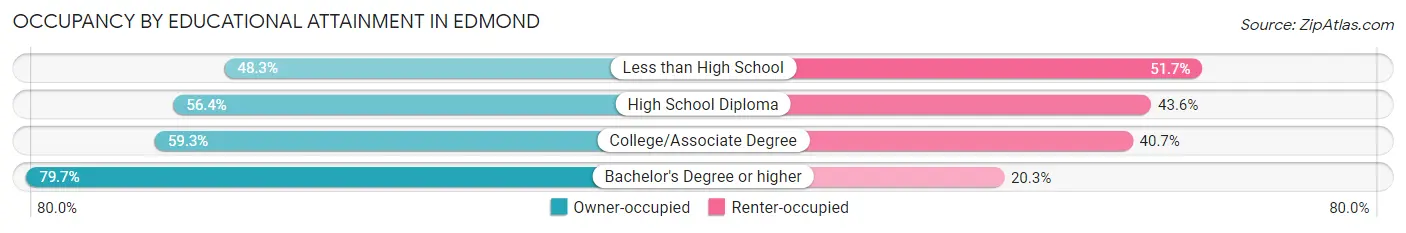
| Household Size | Owner-occupied | Renter-occupied |
| Less than High School | 448 (48.3%) | 480 (51.7%) |
| High School Diploma | 2,388 (56.4%) | 1,847 (43.6%) |
| College/Associate Degree | 6,157 (59.3%) | 4,220 (40.7%) |
| Bachelor's Degree or higher | 16,300 (79.7%) | 4,145 (20.3%) |
Occupancy by Age of Householder in Edmond
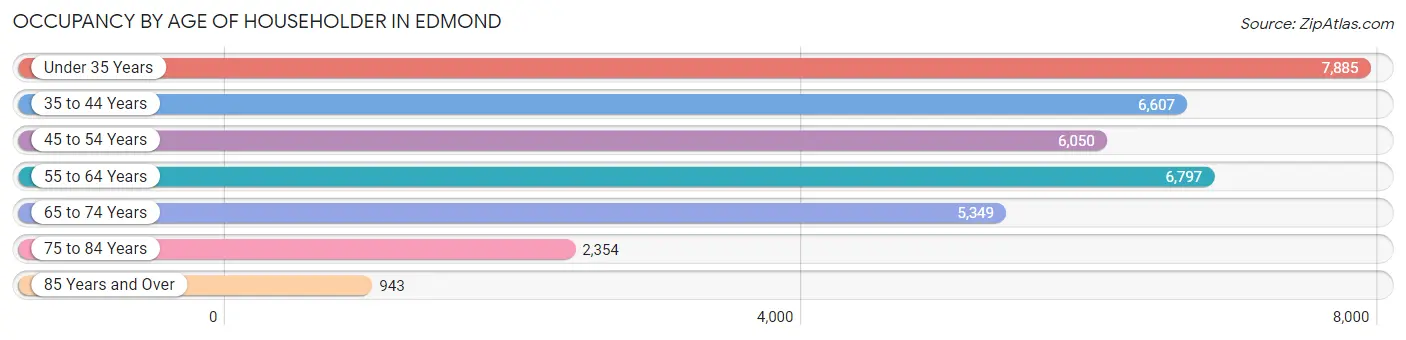
| Age Bracket | # Households | % Households |
| Under 35 Years | 7,885 | 21.9% |
| 35 to 44 Years | 6,607 | 18.4% |
| 45 to 54 Years | 6,050 | 16.8% |
| 55 to 64 Years | 6,797 | 18.9% |
| 65 to 74 Years | 5,349 | 14.9% |
| 75 to 84 Years | 2,354 | 6.5% |
| 85 Years and Over | 943 | 2.6% |
| Total | 35,985 | 100.0% |
Housing Finances in Edmond
Median Income by Occupancy in Edmond
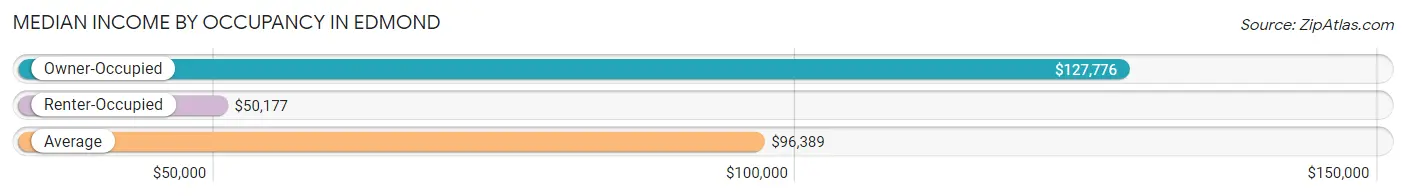
| Occupancy Type | # Households | Median Income |
| Owner-Occupied | 25,293 (70.3%) | $127,776 |
| Renter-Occupied | 10,692 (29.7%) | $50,177 |
| Average | 35,985 (100.0%) | $96,389 |
Occupancy by Householder Income Bracket in Edmond
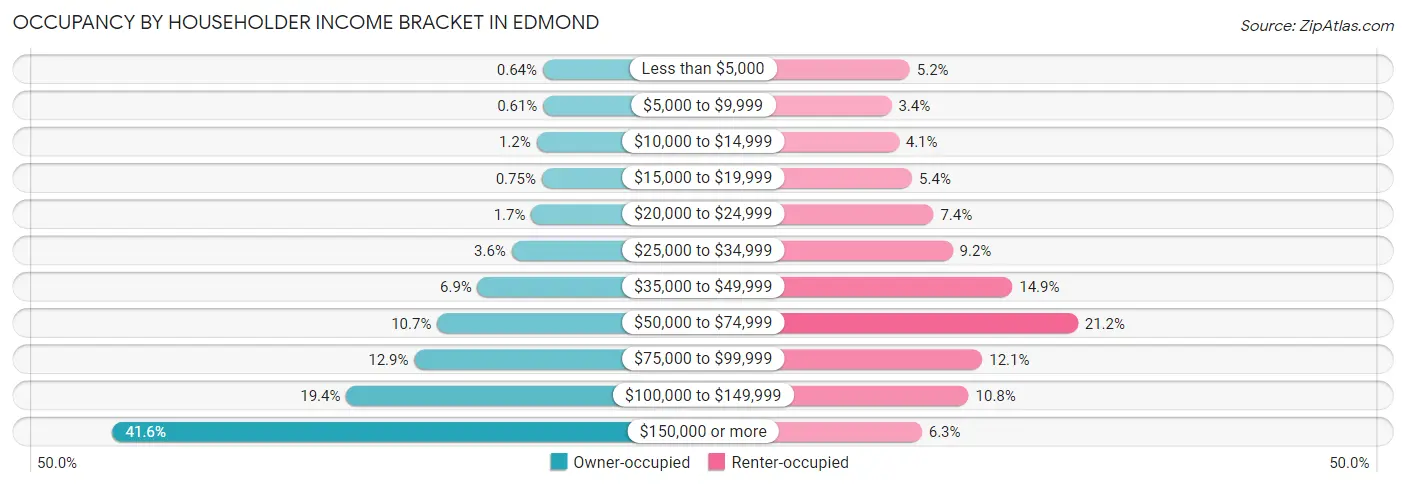
| Income Bracket | Owner-occupied | Renter-occupied |
| Less than $5,000 | 161 (0.6%) | 553 (5.2%) |
| $5,000 to $9,999 | 154 (0.6%) | 366 (3.4%) |
| $10,000 to $14,999 | 313 (1.2%) | 441 (4.1%) |
| $15,000 to $19,999 | 189 (0.7%) | 576 (5.4%) |
| $20,000 to $24,999 | 439 (1.7%) | 793 (7.4%) |
| $25,000 to $34,999 | 913 (3.6%) | 988 (9.2%) |
| $35,000 to $49,999 | 1,732 (6.9%) | 1,596 (14.9%) |
| $50,000 to $74,999 | 2,707 (10.7%) | 2,263 (21.2%) |
| $75,000 to $99,999 | 3,261 (12.9%) | 1,290 (12.1%) |
| $100,000 to $149,999 | 4,897 (19.4%) | 1,151 (10.8%) |
| $150,000 or more | 10,527 (41.6%) | 675 (6.3%) |
| Total | 25,293 (100.0%) | 10,692 (100.0%) |
Monthly Housing Cost Tiers in Edmond
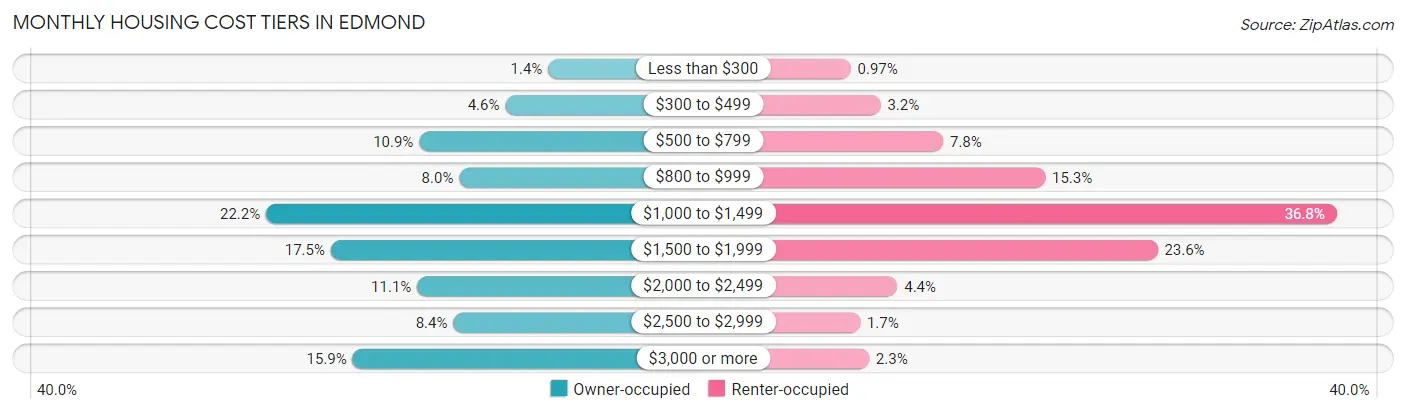
| Monthly Cost | Owner-occupied | Renter-occupied |
| Less than $300 | 363 (1.4%) | 104 (1.0%) |
| $300 to $499 | 1,163 (4.6%) | 339 (3.2%) |
| $500 to $799 | 2,766 (10.9%) | 832 (7.8%) |
| $800 to $999 | 2,020 (8.0%) | 1,635 (15.3%) |
| $1,000 to $1,499 | 5,621 (22.2%) | 3,931 (36.8%) |
| $1,500 to $1,999 | 4,414 (17.4%) | 2,520 (23.6%) |
| $2,000 to $2,499 | 2,806 (11.1%) | 471 (4.4%) |
| $2,500 to $2,999 | 2,132 (8.4%) | 177 (1.7%) |
| $3,000 or more | 4,008 (15.9%) | 248 (2.3%) |
| Total | 25,293 (100.0%) | 10,692 (100.0%) |
Physical Housing Characteristics in Edmond
Housing Structures in Edmond
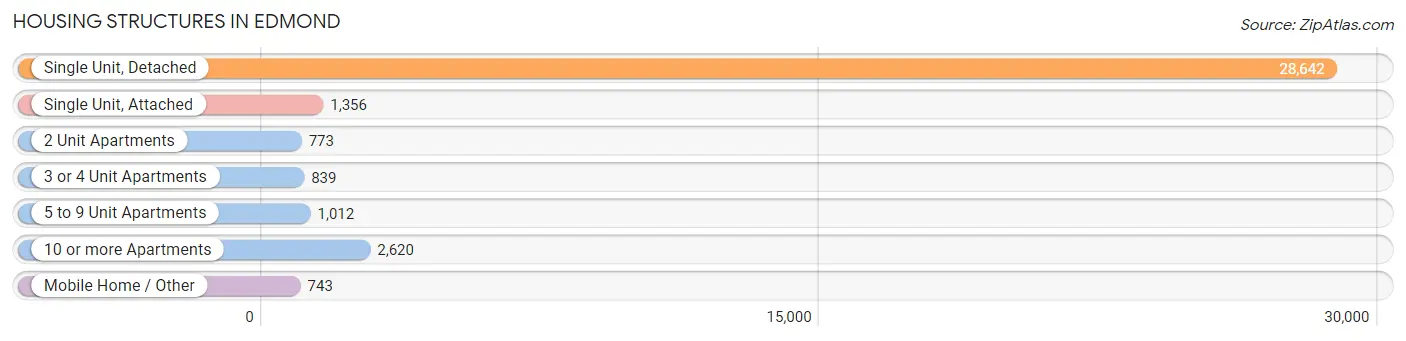
| Structure Type | # Housing Units | % Housing Units |
| Single Unit, Detached | 28,642 | 79.6% |
| Single Unit, Attached | 1,356 | 3.8% |
| 2 Unit Apartments | 773 | 2.1% |
| 3 or 4 Unit Apartments | 839 | 2.3% |
| 5 to 9 Unit Apartments | 1,012 | 2.8% |
| 10 or more Apartments | 2,620 | 7.3% |
| Mobile Home / Other | 743 | 2.1% |
| Total | 35,985 | 100.0% |
Housing Structures by Occupancy in Edmond
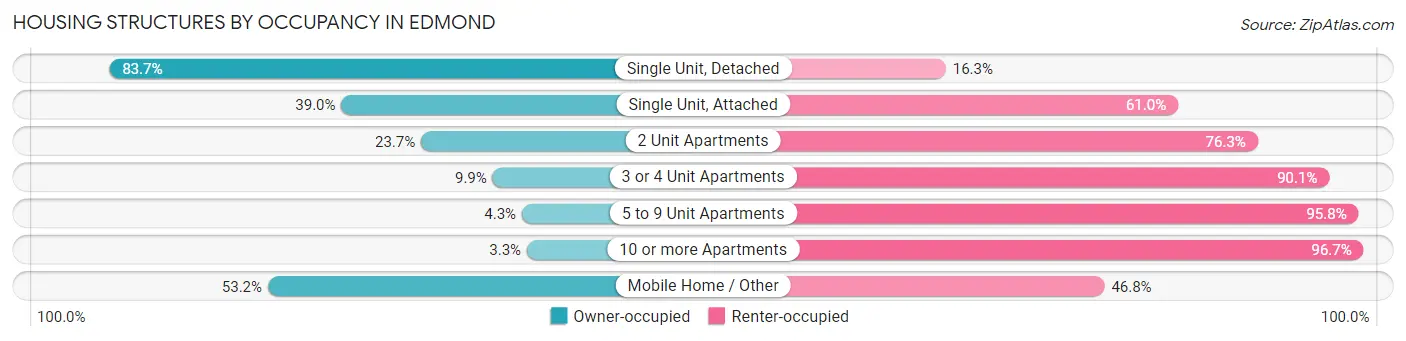
| Structure Type | Owner-occupied | Renter-occupied |
| Single Unit, Detached | 23,974 (83.7%) | 4,668 (16.3%) |
| Single Unit, Attached | 529 (39.0%) | 827 (61.0%) |
| 2 Unit Apartments | 183 (23.7%) | 590 (76.3%) |
| 3 or 4 Unit Apartments | 83 (9.9%) | 756 (90.1%) |
| 5 to 9 Unit Apartments | 43 (4.3%) | 969 (95.8%) |
| 10 or more Apartments | 86 (3.3%) | 2,534 (96.7%) |
| Mobile Home / Other | 395 (53.2%) | 348 (46.8%) |
| Total | 25,293 (70.3%) | 10,692 (29.7%) |
Housing Structures by Number of Rooms in Edmond
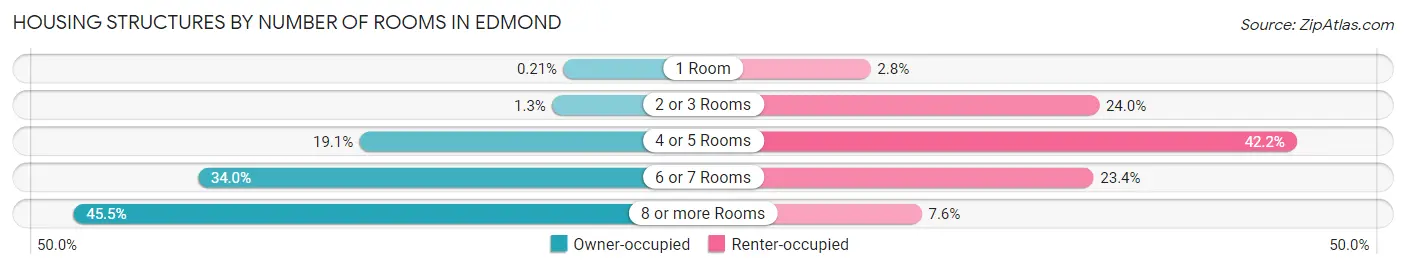
| Number of Rooms | Owner-occupied | Renter-occupied |
| 1 Room | 54 (0.2%) | 301 (2.8%) |
| 2 or 3 Rooms | 315 (1.3%) | 2,562 (24.0%) |
| 4 or 5 Rooms | 4,824 (19.1%) | 4,516 (42.2%) |
| 6 or 7 Rooms | 8,594 (34.0%) | 2,506 (23.4%) |
| 8 or more Rooms | 11,506 (45.5%) | 807 (7.5%) |
| Total | 25,293 (100.0%) | 10,692 (100.0%) |
Housing Structure by Heating Type in Edmond
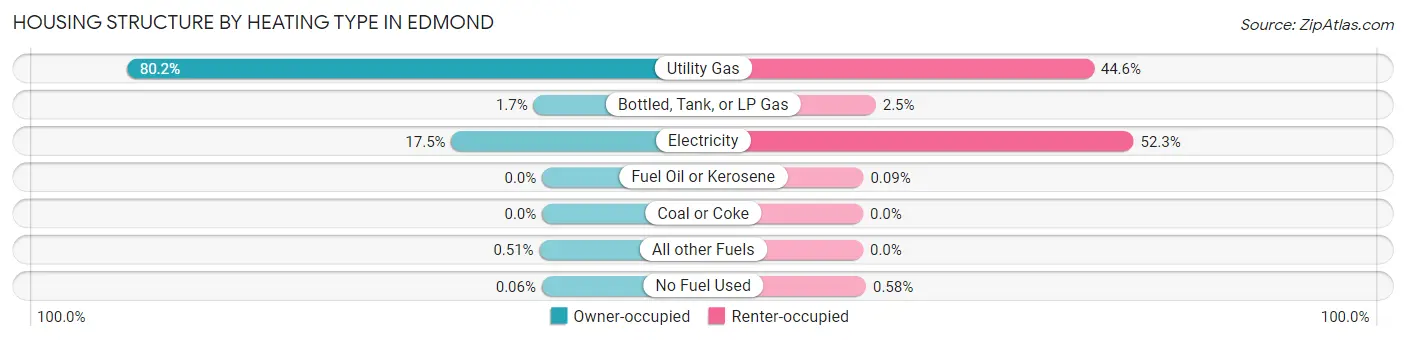
| Heating Type | Owner-occupied | Renter-occupied |
| Utility Gas | 20,294 (80.2%) | 4,768 (44.6%) |
| Bottled, Tank, or LP Gas | 421 (1.7%) | 263 (2.5%) |
| Electricity | 4,433 (17.5%) | 5,589 (52.3%) |
| Fuel Oil or Kerosene | 0 (0.0%) | 10 (0.1%) |
| Coal or Coke | 0 (0.0%) | 0 (0.0%) |
| All other Fuels | 129 (0.5%) | 0 (0.0%) |
| No Fuel Used | 16 (0.1%) | 62 (0.6%) |
| Total | 25,293 (100.0%) | 10,692 (100.0%) |
Household Vehicle Usage in Edmond
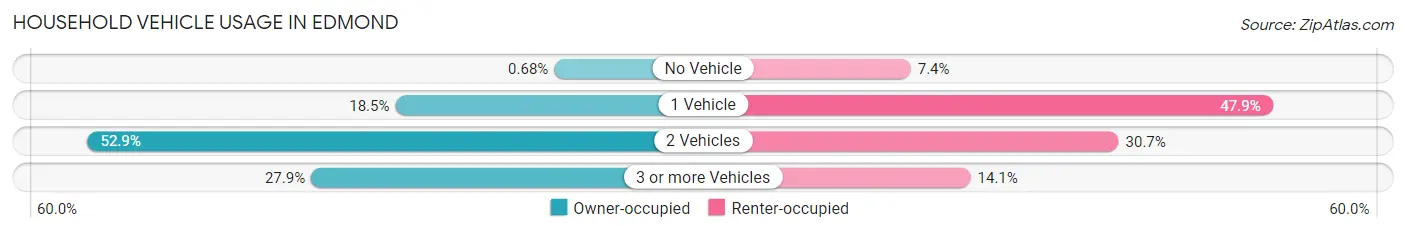
| Vehicles per Household | Owner-occupied | Renter-occupied |
| No Vehicle | 171 (0.7%) | 789 (7.4%) |
| 1 Vehicle | 4,671 (18.5%) | 5,120 (47.9%) |
| 2 Vehicles | 13,389 (52.9%) | 3,278 (30.7%) |
| 3 or more Vehicles | 7,062 (27.9%) | 1,505 (14.1%) |
| Total | 25,293 (100.0%) | 10,692 (100.0%) |
Real Estate & Mortgages in Edmond
Real Estate and Mortgage Overview in Edmond
| Characteristic | Without Mortgage | With Mortgage |
| Housing Units | 8,048 | 17,245 |
| Median Property Value | $295,600 | $310,200 |
| Median Household Income | $105,246 | $7,845 |
| Monthly Housing Costs | $799 | $3,962 |
| Real Estate Taxes | $2,836 | $369 |
Property Value by Mortgage Status in Edmond
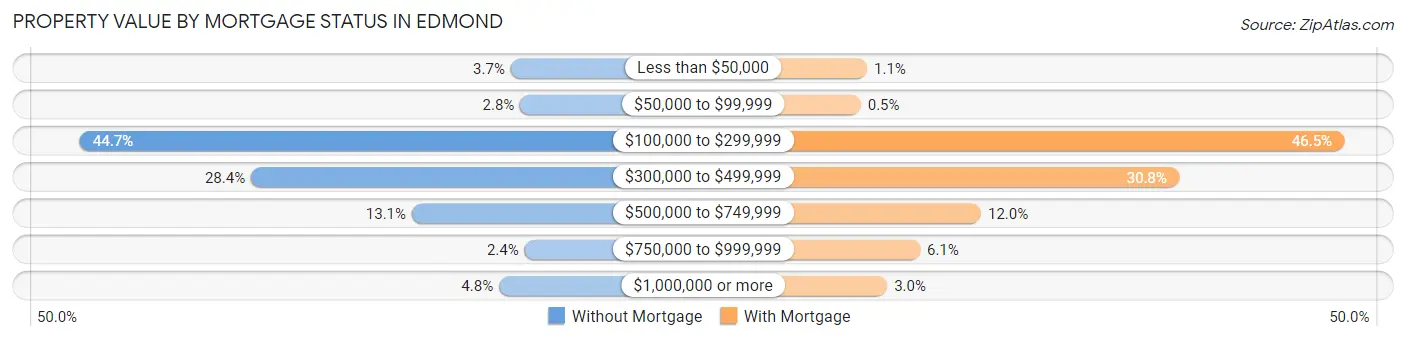
| Property Value | Without Mortgage | With Mortgage |
| Less than $50,000 | 298 (3.7%) | 190 (1.1%) |
| $50,000 to $99,999 | 225 (2.8%) | 86 (0.5%) |
| $100,000 to $299,999 | 3,600 (44.7%) | 8,020 (46.5%) |
| $300,000 to $499,999 | 2,289 (28.4%) | 5,309 (30.8%) |
| $500,000 to $749,999 | 1,056 (13.1%) | 2,061 (11.9%) |
| $750,000 to $999,999 | 192 (2.4%) | 1,059 (6.1%) |
| $1,000,000 or more | 388 (4.8%) | 520 (3.0%) |
| Total | 8,048 (100.0%) | 17,245 (100.0%) |
Household Income by Mortgage Status in Edmond
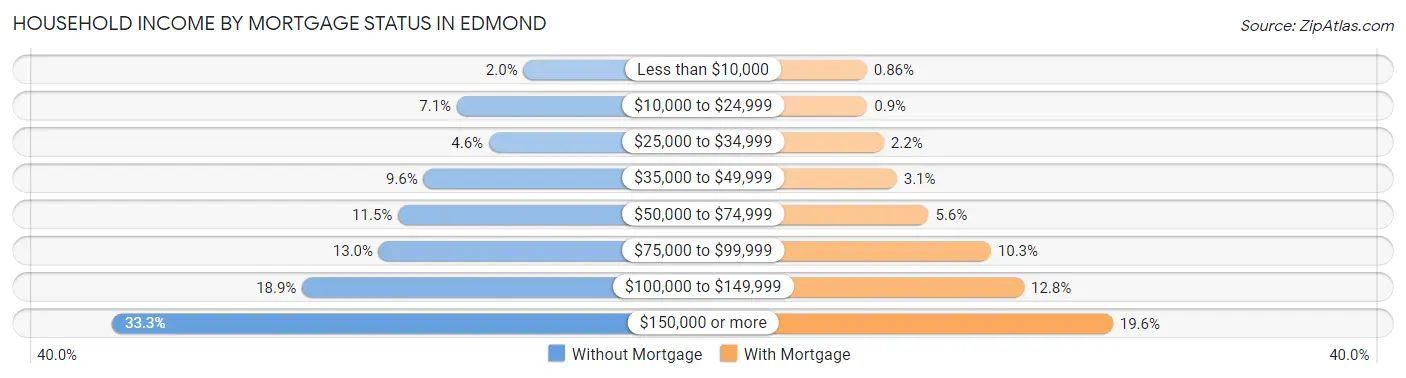
| Household Income | Without Mortgage | With Mortgage |
| Less than $10,000 | 160 (2.0%) | 149 (0.9%) |
| $10,000 to $24,999 | 568 (7.1%) | 155 (0.9%) |
| $25,000 to $34,999 | 372 (4.6%) | 373 (2.2%) |
| $35,000 to $49,999 | 773 (9.6%) | 541 (3.1%) |
| $50,000 to $74,999 | 929 (11.5%) | 959 (5.6%) |
| $75,000 to $99,999 | 1,047 (13.0%) | 1,778 (10.3%) |
| $100,000 to $149,999 | 1,517 (18.9%) | 2,214 (12.8%) |
| $150,000 or more | 2,682 (33.3%) | 3,380 (19.6%) |
| Total | 8,048 (100.0%) | 17,245 (100.0%) |
Property Value to Household Income Ratio in Edmond
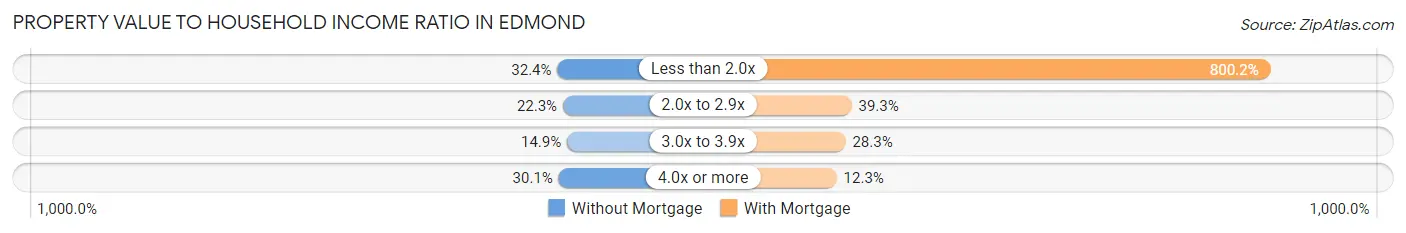
| Value-to-Income Ratio | Without Mortgage | With Mortgage |
| Less than 2.0x | 2,610 (32.4%) | 137,996 (800.2%) |
| 2.0x to 2.9x | 1,798 (22.3%) | 6,768 (39.3%) |
| 3.0x to 3.9x | 1,198 (14.9%) | 4,881 (28.3%) |
| 4.0x or more | 2,420 (30.1%) | 2,116 (12.3%) |
| Total | 8,048 (100.0%) | 17,245 (100.0%) |
Real Estate Taxes by Mortgage Status in Edmond
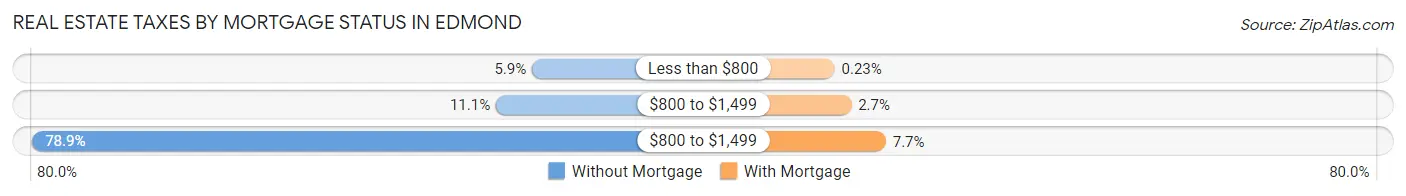
| Property Taxes | Without Mortgage | With Mortgage |
| Less than $800 | 471 (5.9%) | 39 (0.2%) |
| $800 to $1,499 | 895 (11.1%) | 457 (2.6%) |
| $800 to $1,499 | 6,348 (78.9%) | 1,330 (7.7%) |
| Total | 8,048 (100.0%) | 17,245 (100.0%) |
Health & Disability in Edmond
Health Insurance Coverage by Age in Edmond
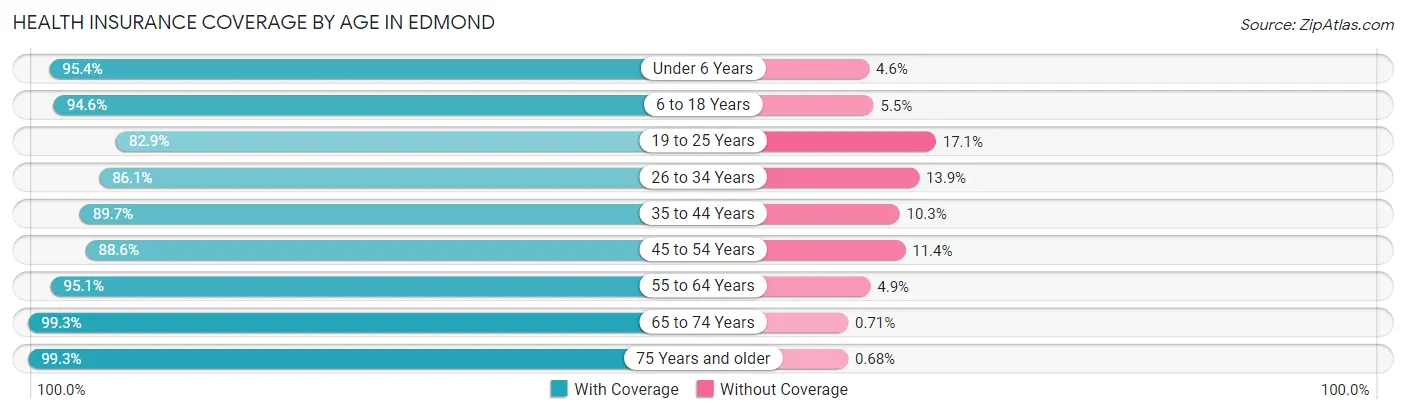
| Age Bracket | With Coverage | Without Coverage |
| Under 6 Years | 7,377 (95.4%) | 357 (4.6%) |
| 6 to 18 Years | 16,535 (94.6%) | 953 (5.4%) |
| 19 to 25 Years | 7,614 (82.9%) | 1,567 (17.1%) |
| 26 to 34 Years | 8,510 (86.1%) | 1,376 (13.9%) |
| 35 to 44 Years | 10,513 (89.7%) | 1,207 (10.3%) |
| 45 to 54 Years | 10,459 (88.6%) | 1,342 (11.4%) |
| 55 to 64 Years | 11,363 (95.1%) | 581 (4.9%) |
| 65 to 74 Years | 8,974 (99.3%) | 64 (0.7%) |
| 75 Years and older | 4,968 (99.3%) | 34 (0.7%) |
| Total | 86,313 (92.0%) | 7,481 (8.0%) |
Health Insurance Coverage by Citizenship Status in Edmond
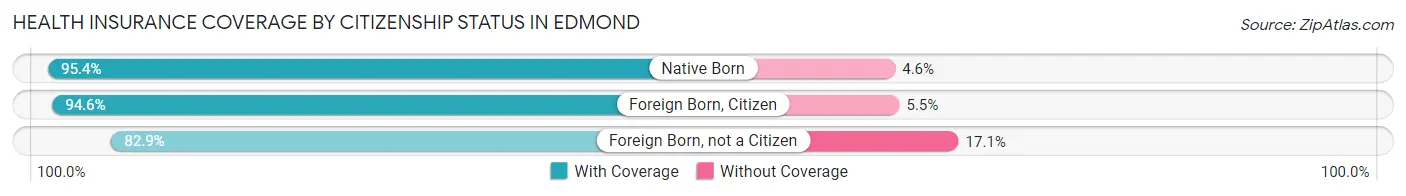
| Citizenship Status | With Coverage | Without Coverage |
| Native Born | 7,377 (95.4%) | 357 (4.6%) |
| Foreign Born, Citizen | 16,535 (94.6%) | 953 (5.4%) |
| Foreign Born, not a Citizen | 7,614 (82.9%) | 1,567 (17.1%) |
Health Insurance Coverage by Household Income in Edmond
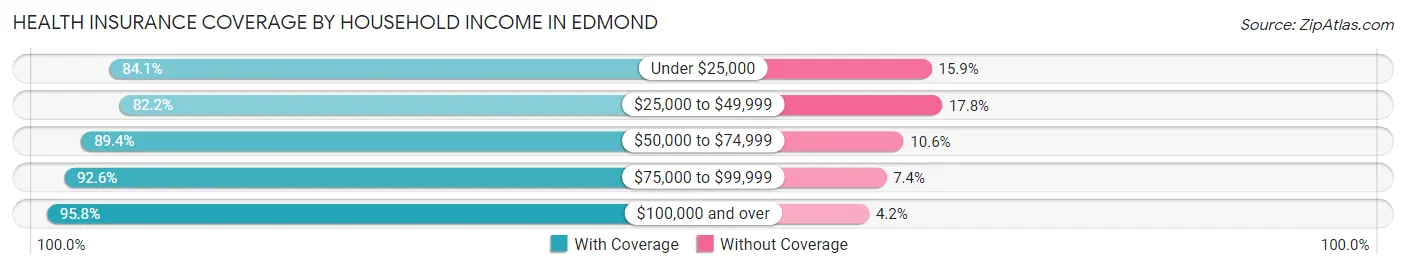
| Household Income | With Coverage | Without Coverage |
| Under $25,000 | 6,358 (84.1%) | 1,200 (15.9%) |
| $25,000 to $49,999 | 8,590 (82.2%) | 1,864 (17.8%) |
| $50,000 to $74,999 | 10,393 (89.4%) | 1,234 (10.6%) |
| $75,000 to $99,999 | 11,147 (92.6%) | 888 (7.4%) |
| $100,000 and over | 48,687 (95.8%) | 2,116 (4.2%) |
Public vs Private Health Insurance Coverage by Age in Edmond
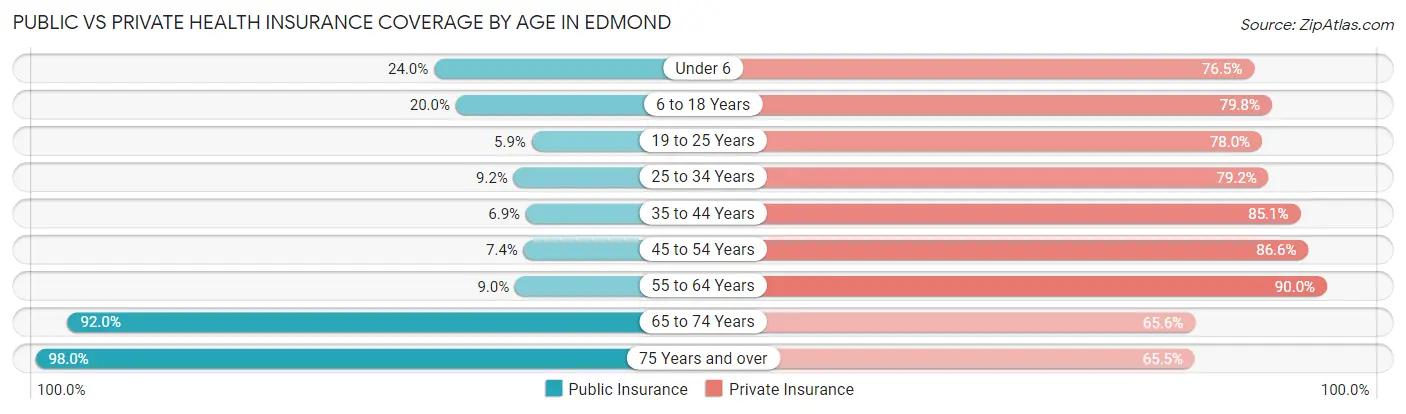
| Age Bracket | Public Insurance | Private Insurance |
| Under 6 | 1,855 (24.0%) | 5,918 (76.5%) |
| 6 to 18 Years | 3,492 (20.0%) | 13,956 (79.8%) |
| 19 to 25 Years | 540 (5.9%) | 7,159 (78.0%) |
| 25 to 34 Years | 911 (9.2%) | 7,833 (79.2%) |
| 35 to 44 Years | 813 (6.9%) | 9,973 (85.1%) |
| 45 to 54 Years | 869 (7.4%) | 10,217 (86.6%) |
| 55 to 64 Years | 1,070 (9.0%) | 10,754 (90.0%) |
| 65 to 74 Years | 8,318 (92.0%) | 5,927 (65.6%) |
| 75 Years and over | 4,901 (98.0%) | 3,278 (65.5%) |
| Total | 22,769 (24.3%) | 75,015 (80.0%) |
Disability Status by Sex by Age in Edmond
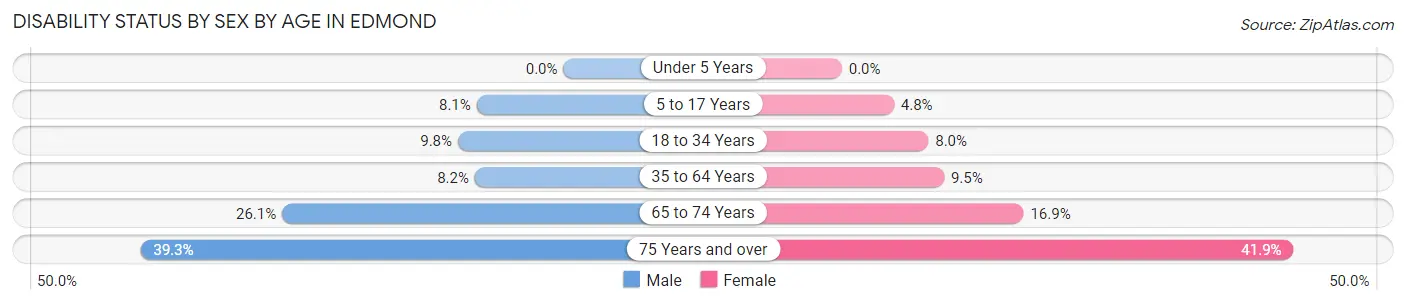
| Age Bracket | Male | Female |
| Under 5 Years | 0 (0.0%) | 0 (0.0%) |
| 5 to 17 Years | 691 (8.1%) | 421 (4.8%) |
| 18 to 34 Years | 984 (9.8%) | 837 (8.0%) |
| 35 to 64 Years | 1,411 (8.2%) | 1,735 (9.5%) |
| 65 to 74 Years | 1,078 (26.1%) | 828 (16.9%) |
| 75 Years and over | 881 (39.3%) | 1,156 (41.9%) |
Disability Class by Sex by Age in Edmond
Disability Class: Hearing Difficulty
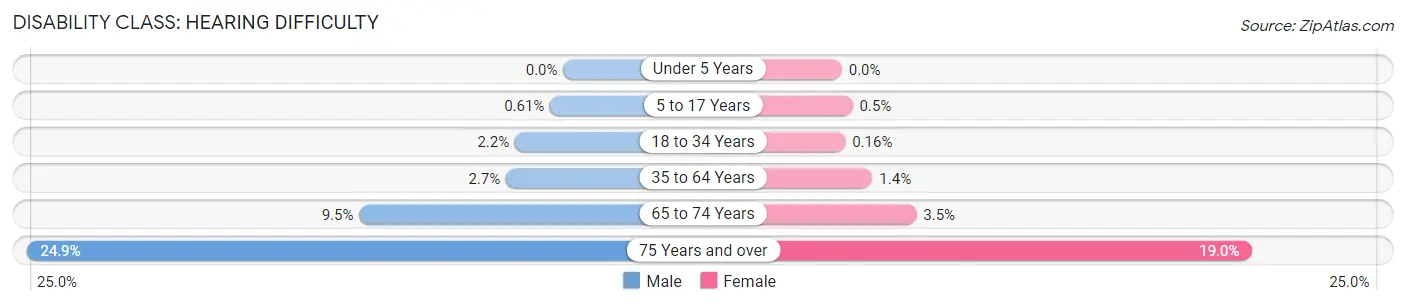
| Age Bracket | Male | Female |
| Under 5 Years | 0 (0.0%) | 0 (0.0%) |
| 5 to 17 Years | 52 (0.6%) | 44 (0.5%) |
| 18 to 34 Years | 225 (2.2%) | 17 (0.2%) |
| 35 to 64 Years | 457 (2.7%) | 259 (1.4%) |
| 65 to 74 Years | 391 (9.5%) | 170 (3.5%) |
| 75 Years and over | 558 (24.9%) | 524 (19.0%) |
Disability Class: Vision Difficulty
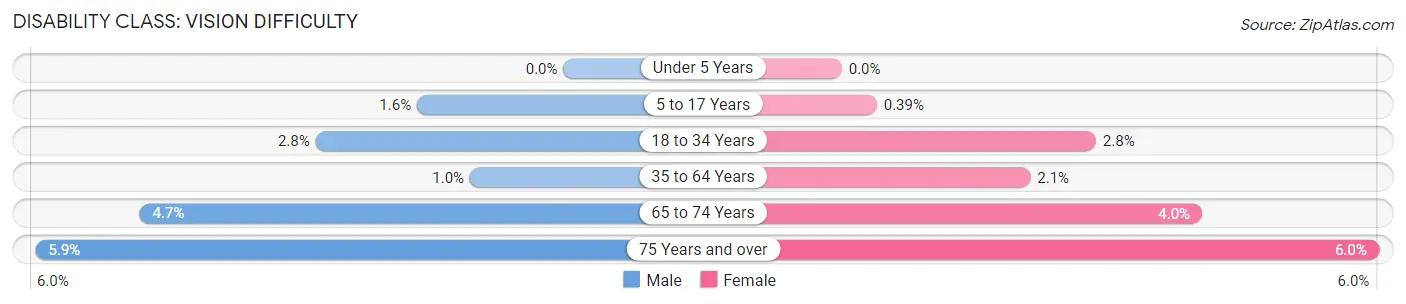
| Age Bracket | Male | Female |
| Under 5 Years | 0 (0.0%) | 0 (0.0%) |
| 5 to 17 Years | 140 (1.6%) | 34 (0.4%) |
| 18 to 34 Years | 277 (2.8%) | 295 (2.8%) |
| 35 to 64 Years | 179 (1.0%) | 385 (2.1%) |
| 65 to 74 Years | 195 (4.7%) | 197 (4.0%) |
| 75 Years and over | 132 (5.9%) | 165 (6.0%) |
Disability Class: Cognitive Difficulty
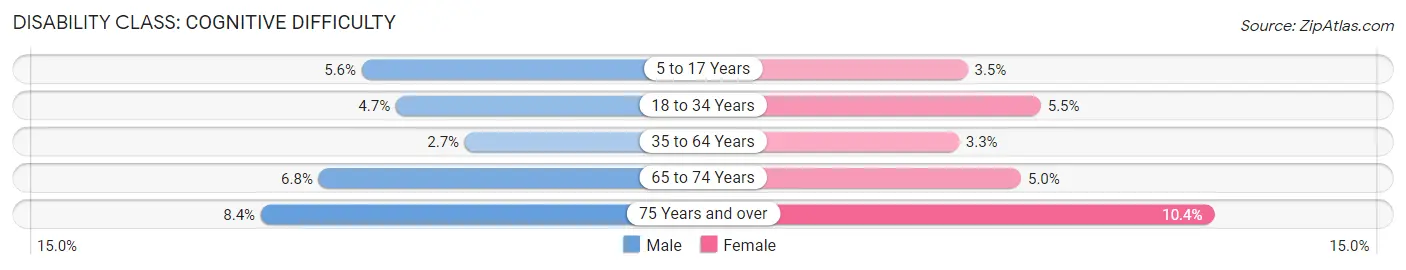
| Age Bracket | Male | Female |
| 5 to 17 Years | 482 (5.6%) | 305 (3.5%) |
| 18 to 34 Years | 468 (4.7%) | 578 (5.5%) |
| 35 to 64 Years | 470 (2.7%) | 596 (3.3%) |
| 65 to 74 Years | 281 (6.8%) | 245 (5.0%) |
| 75 Years and over | 189 (8.4%) | 286 (10.4%) |
Disability Class: Ambulatory Difficulty
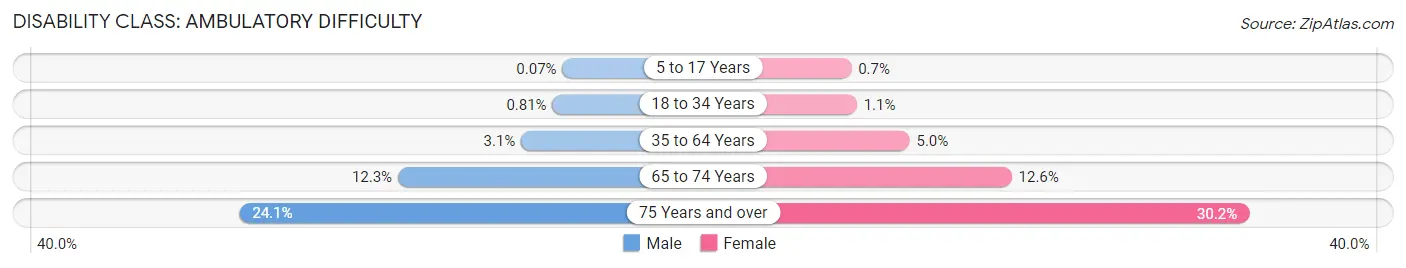
| Age Bracket | Male | Female |
| 5 to 17 Years | 6 (0.1%) | 61 (0.7%) |
| 18 to 34 Years | 81 (0.8%) | 116 (1.1%) |
| 35 to 64 Years | 537 (3.1%) | 921 (5.0%) |
| 65 to 74 Years | 507 (12.3%) | 619 (12.6%) |
| 75 Years and over | 540 (24.1%) | 834 (30.2%) |
Disability Class: Self-Care Difficulty
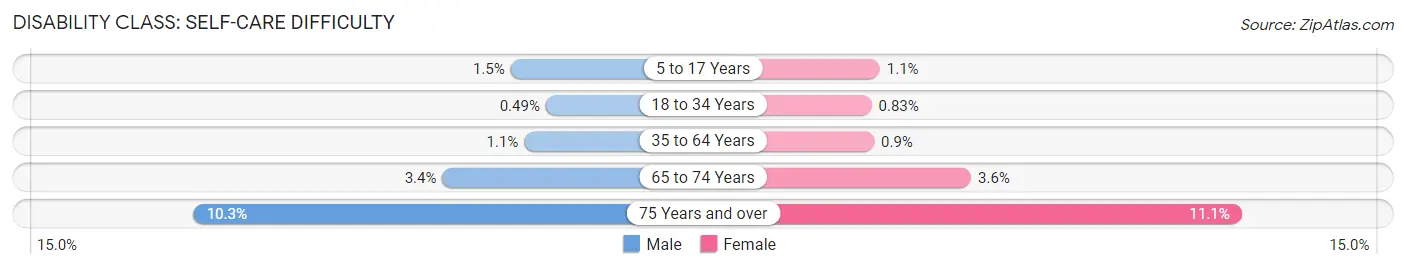
| Age Bracket | Male | Female |
| 5 to 17 Years | 126 (1.5%) | 92 (1.1%) |
| 18 to 34 Years | 49 (0.5%) | 87 (0.8%) |
| 35 to 64 Years | 188 (1.1%) | 164 (0.9%) |
| 65 to 74 Years | 139 (3.4%) | 177 (3.6%) |
| 75 Years and over | 231 (10.3%) | 307 (11.1%) |
Technology Access in Edmond
Computing Device Access in Edmond
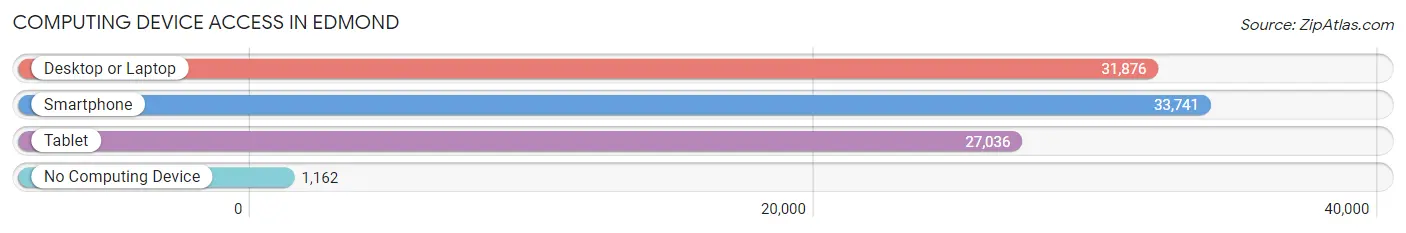
| Device Type | # Households | % Households |
| Desktop or Laptop | 31,876 | 88.6% |
| Smartphone | 33,741 | 93.8% |
| Tablet | 27,036 | 75.1% |
| No Computing Device | 1,162 | 3.2% |
| Total | 35,985 | 100.0% |
Internet Access in Edmond
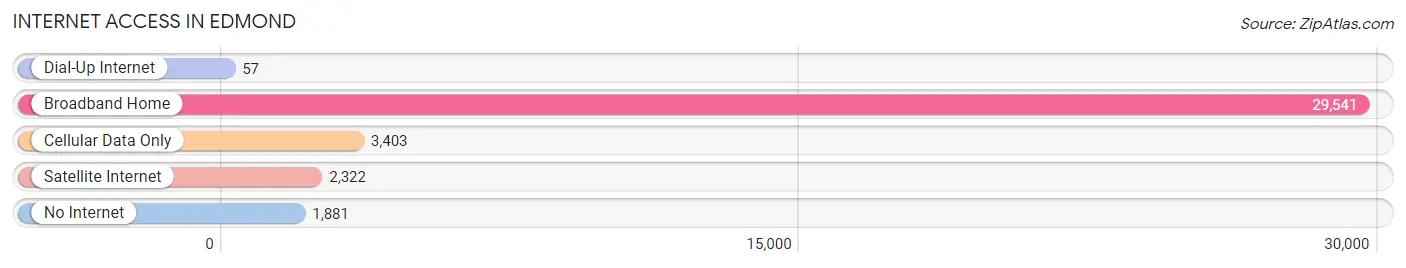
| Internet Type | # Households | % Households |
| Dial-Up Internet | 57 | 0.2% |
| Broadband Home | 29,541 | 82.1% |
| Cellular Data Only | 3,403 | 9.5% |
| Satellite Internet | 2,322 | 6.5% |
| No Internet | 1,881 | 5.2% |
| Total | 35,985 | 100.0% |
Edmond Summary
Edmond, Oklahoma is a city located in Oklahoma County, Oklahoma, United States. It is part of the Oklahoma City metropolitan area and is located just north of Oklahoma City. As of the 2010 census, the population of Edmond was 81,405, making it the sixth largest city in the state.
History
Edmond was founded in 1889 by a group of settlers led by David Lippincott. The group had originally planned to settle in the area of what is now Guthrie, Oklahoma, but were forced to move due to the presence of the Cherokee Nation. The group chose the area of Edmond due to its proximity to the Santa Fe Railroad and the abundance of water from the nearby Cimarron River.
The town was named after Edmond Burdick, a prominent local rancher and businessman. The town was officially incorporated in 1910 and quickly grew in population due to its proximity to Oklahoma City. By the 1920s, Edmond had become a popular destination for tourists and was known for its many parks and recreational activities.
Geography
Edmond is located in central Oklahoma, approximately 15 miles north of Oklahoma City. It is situated in the Sandstone Hills region of the state, which is characterized by rolling hills and prairies. The city is bordered by the Cimarron River to the north and the Canadian River to the south.
Edmond has a total area of 64.2 square miles, of which 63.9 square miles is land and 0.3 square miles is water. The city has a humid subtropical climate, with hot, humid summers and mild winters.
Economy
Edmond’s economy is largely based on the service industry, with many residents employed in retail, healthcare, and education. The city is also home to several large employers, including the University of Central Oklahoma, the Oklahoma State University Medical Center, and the Oklahoma City National Memorial.
Edmond is also home to several major shopping centers, including the University Town Center, the Edmond Marketplace, and the Edmond Crossing Shopping Center. The city is also home to several large employers, including the University of Central Oklahoma, the Oklahoma State University Medical Center, and the Oklahoma City National Memorial.
Demographics
As of the 2010 census, the population of Edmond was 81,405, with a population density of 1,269.7 people per square mile. The racial makeup of the city was 79.2% White, 8.2% African American, 4.2% Native American, 2.7% Asian, 0.1% Pacific Islander, and 4.7% from other races. Hispanic or Latino of any race were 8.7% of the population.
The median income for a household in Edmond was $60,945, and the median income for a family was $71,845. The per capita income for the city was $30,945. About 6.2% of families and 8.7% of the population were below the poverty line, including 10.2% of those under age 18 and 6.2% of those age 65 or over.
Common Questions
What is Per Capita Income in Edmond?
Per Capita income in Edmond is $53,381.
What is the Median Family Income in Edmond?
Median Family Income in Edmond is $124,204.
What is the Median Household income in Edmond?
Median Household Income in Edmond is $96,389.
What is Income or Wage Gap in Edmond?
Income or Wage Gap in Edmond is 40.6%.
Women in Edmond earn 59.4 cents for every dollar earned by a man.
What is Family Income Deficit in Edmond?
Family Income Deficit in Edmond is $13,270.
Families that are below poverty line in Edmond earn $13,270 less on average than the poverty threshold level.
What is Inequality or Gini Index in Edmond?
Inequality or Gini Index in Edmond is 0.48.
What is the Total Population of Edmond?
Total Population of Edmond is 94,503.
What is the Total Male Population of Edmond?
Total Male Population of Edmond is 46,014.
What is the Total Female Population of Edmond?
Total Female Population of Edmond is 48,489.
What is the Ratio of Males per 100 Females in Edmond?
There are 94.90 Males per 100 Females in Edmond.
What is the Ratio of Females per 100 Males in Edmond?
There are 105.38 Females per 100 Males in Edmond.
What is the Median Population Age in Edmond?
Median Population Age in Edmond is 37.3 Years.
What is the Average Family Size in Edmond
Average Family Size in Edmond is 3.0 People.
What is the Average Household Size in Edmond
Average Household Size in Edmond is 2.6 People.
How Large is the Labor Force in Edmond?
There are 48,908 People in the Labor Forcein in Edmond.
What is the Percentage of People in the Labor Force in Edmond?
66.5% of People are in the Labor Force in Edmond.
What is the Unemployment Rate in Edmond?
Unemployment Rate in Edmond is 3.5%.