Grove, OK Map & Demographics
Grove Map
Grove Overview
$38,198
PER CAPITA INCOME
$66,386
AVG FAMILY INCOME
$56,469
AVG HOUSEHOLD INCOME
46.1%
WAGE / INCOME GAP [ % ]
53.9¢/ $1
WAGE / INCOME GAP [ $ ]
0.49
INEQUALITY / GINI INDEX
7,012
TOTAL POPULATION
3,451
MALE POPULATION
3,561
FEMALE POPULATION
96.91
MALES / 100 FEMALES
103.19
FEMALES / 100 MALES
46.9
MEDIAN AGE
2.8
AVG FAMILY SIZE
2.3
AVG HOUSEHOLD SIZE
2,937
LABOR FORCE [ PEOPLE ]
51.8%
PERCENT IN LABOR FORCE
1.4%
UNEMPLOYMENT RATE
Grove Zip Codes
Grove Area Codes
Income in Grove
Income Overview in Grove
Per Capita Income in Grove is $38,198, while median incomes of families and households are $66,386 and $56,469 respectively.
| Characteristic | Number | Measure |
| Per Capita Income | 7,012 | $38,198 |
| Median Family Income | 1,966 | $66,386 |
| Mean Family Income | 1,966 | $98,441 |
| Median Household Income | 2,921 | $56,469 |
| Mean Household Income | 2,921 | $85,855 |
| Income Deficit | 1,966 | $0 |
| Wage / Income Gap (%) | 7,012 | 46.09% |
| Wage / Income Gap ($) | 7,012 | 53.91¢ per $1 |
| Gini / Inequality Index | 7,012 | 0.49 |
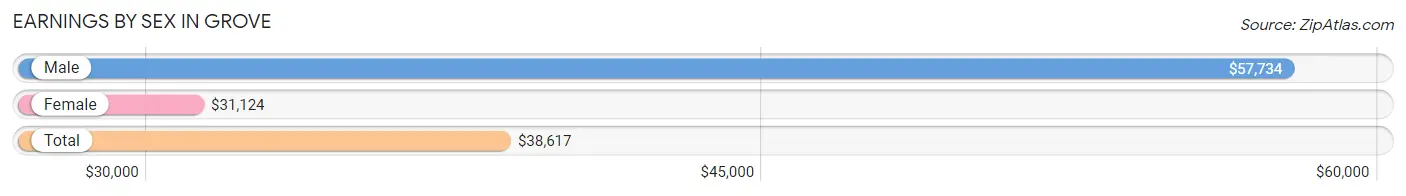
Earnings by Sex in Grove
Average Earnings in Grove are $38,617, $57,734 for men and $31,124 for women, a difference of 46.1%.
| Sex | Number | Average Earnings |
| Male | 1,552 (50.6%) | $57,734 |
| Female | 1,514 (49.4%) | $31,124 |
| Total | 3,066 (100.0%) | $38,617 |
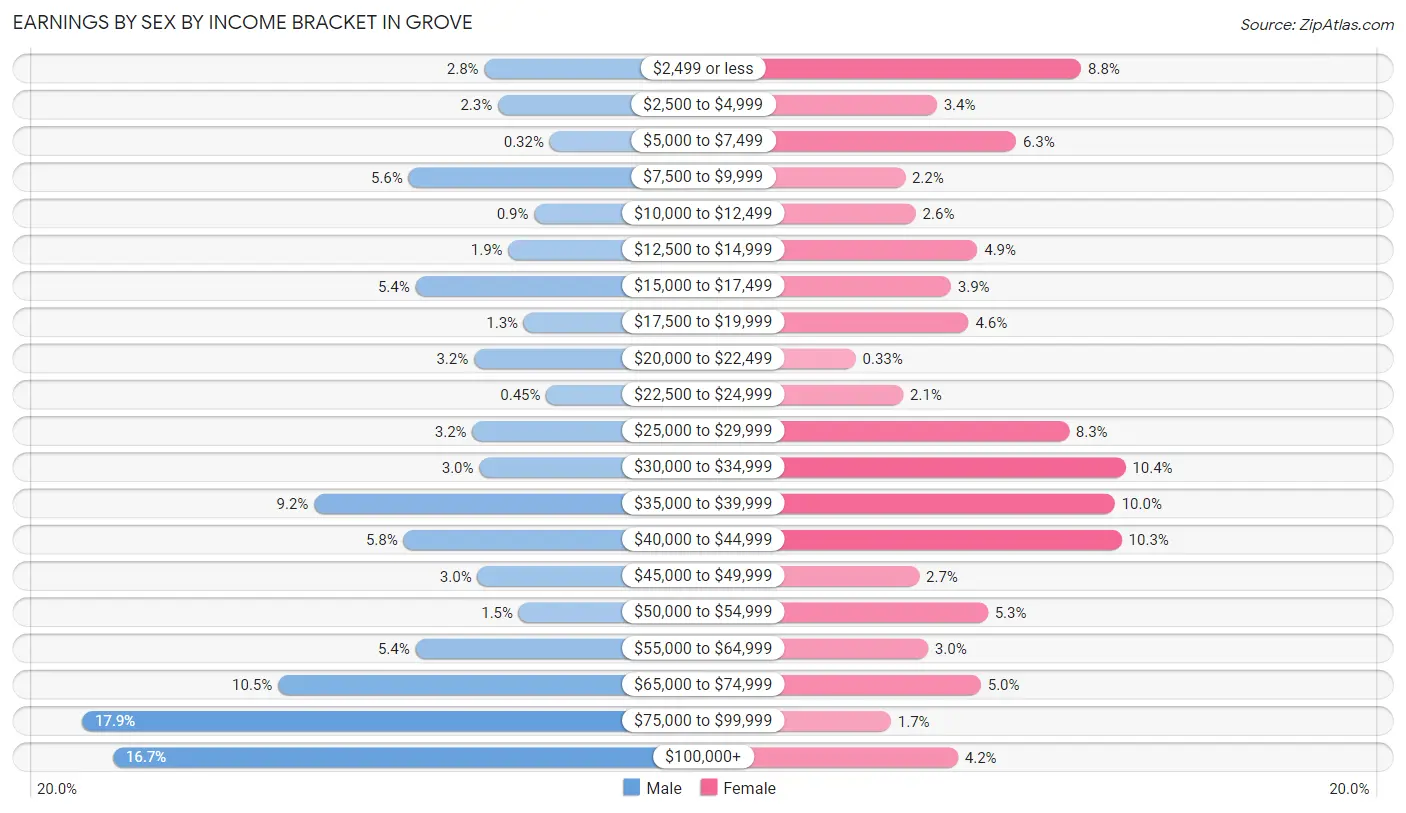
Earnings by Sex by Income Bracket in Grove
The most common earnings brackets in Grove are $75,000 to $99,999 for men (277 | 17.8%) and $30,000 to $34,999 for women (158 | 10.4%).
| Income | Male | Female |
| $2,499 or less | 43 (2.8%) | 133 (8.8%) |
| $2,500 to $4,999 | 35 (2.3%) | 51 (3.4%) |
| $5,000 to $7,499 | 5 (0.3%) | 96 (6.3%) |
| $7,500 to $9,999 | 87 (5.6%) | 33 (2.2%) |
| $10,000 to $12,499 | 14 (0.9%) | 39 (2.6%) |
| $12,500 to $14,999 | 29 (1.9%) | 74 (4.9%) |
| $15,000 to $17,499 | 83 (5.3%) | 59 (3.9%) |
| $17,500 to $19,999 | 20 (1.3%) | 69 (4.6%) |
| $20,000 to $22,499 | 49 (3.2%) | 5 (0.3%) |
| $22,500 to $24,999 | 7 (0.4%) | 32 (2.1%) |
| $25,000 to $29,999 | 50 (3.2%) | 126 (8.3%) |
| $30,000 to $34,999 | 46 (3.0%) | 158 (10.4%) |
| $35,000 to $39,999 | 142 (9.1%) | 152 (10.0%) |
| $40,000 to $44,999 | 90 (5.8%) | 156 (10.3%) |
| $45,000 to $49,999 | 47 (3.0%) | 41 (2.7%) |
| $50,000 to $54,999 | 23 (1.5%) | 80 (5.3%) |
| $55,000 to $64,999 | 83 (5.3%) | 46 (3.0%) |
| $65,000 to $74,999 | 163 (10.5%) | 76 (5.0%) |
| $75,000 to $99,999 | 277 (17.8%) | 25 (1.7%) |
| $100,000+ | 259 (16.7%) | 63 (4.2%) |
| Total | 1,552 (100.0%) | 1,514 (100.0%) |
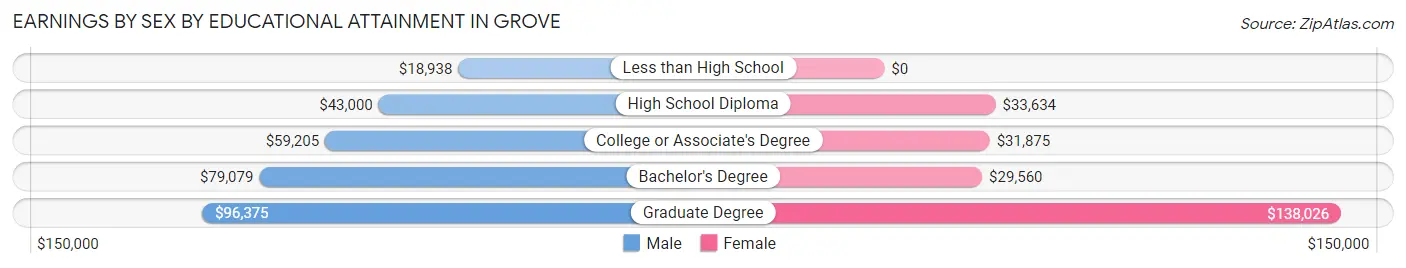
Earnings by Sex by Educational Attainment in Grove
Average earnings in Grove are $60,500 for men and $32,808 for women, a difference of 45.8%. Men with an educational attainment of graduate degree enjoy the highest average annual earnings of $96,375, while those with less than high school education earn the least with $18,938. Women with an educational attainment of graduate degree earn the most with the average annual earnings of $138,026, while those with bachelor's degree education have the smallest earnings of $29,560.
| Educational Attainment | Male Income | Female Income |
| Less than High School | $18,938 | $0 |
| High School Diploma | $43,000 | $33,634 |
| College or Associate's Degree | $59,205 | $31,875 |
| Bachelor's Degree | $79,079 | $29,560 |
| Graduate Degree | $96,375 | $138,026 |
| Total | $60,500 | $32,808 |
Family Income in Grove
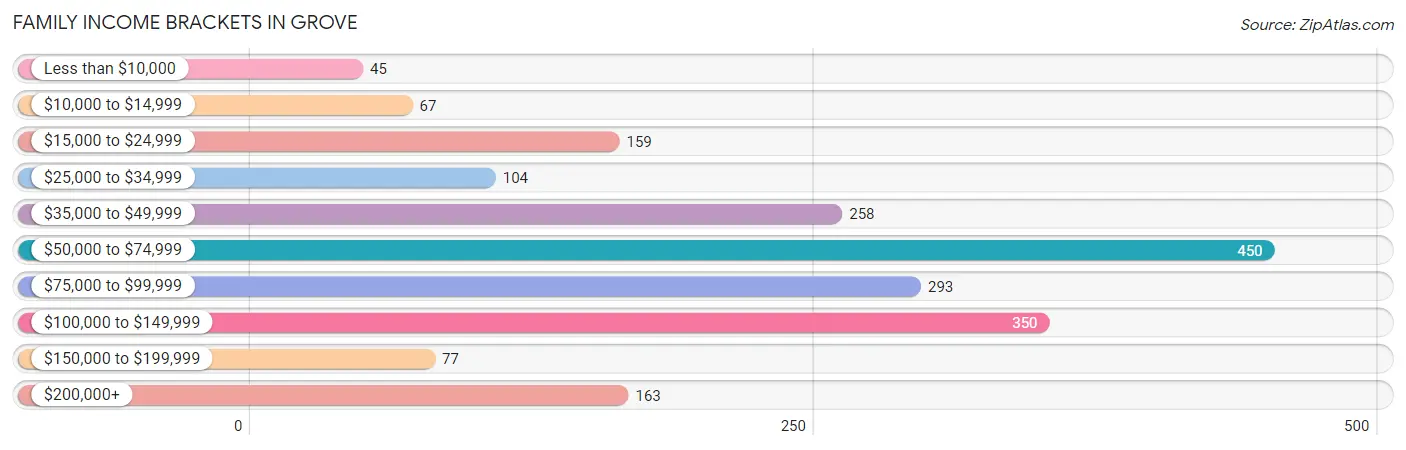
Family Income Brackets in Grove
According to the Grove family income data, there are 450 families falling into the $50,000 to $74,999 income range, which is the most common income bracket and makes up 22.9% of all families. Conversely, the less than $10,000 income bracket is the least frequent group with only 45 families (2.3%) belonging to this category.
| Income Bracket | # Families | % Families |
| Less than $10,000 | 45 | 2.3% |
| $10,000 to $14,999 | 67 | 3.4% |
| $15,000 to $24,999 | 159 | 8.1% |
| $25,000 to $34,999 | 104 | 5.3% |
| $35,000 to $49,999 | 258 | 13.1% |
| $50,000 to $74,999 | 450 | 22.9% |
| $75,000 to $99,999 | 293 | 14.9% |
| $100,000 to $149,999 | 350 | 17.8% |
| $150,000 to $199,999 | 77 | 3.9% |
| $200,000+ | 163 | 8.3% |
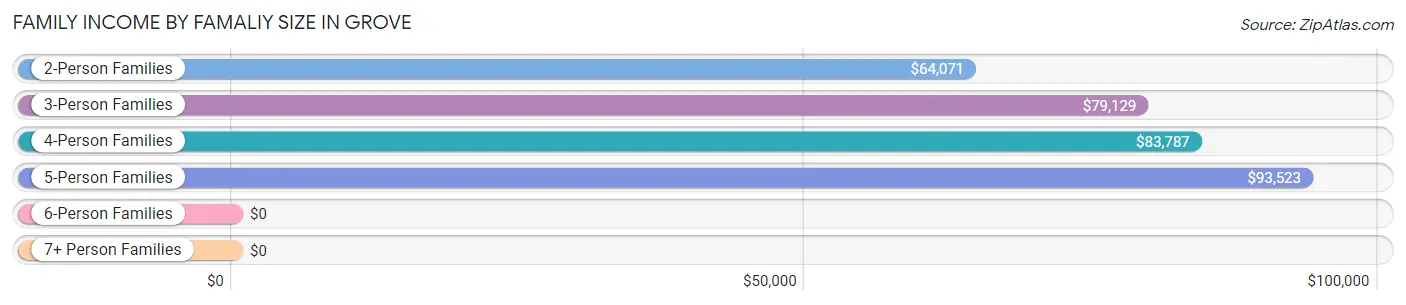
Family Income by Famaliy Size in Grove
5-person families (252 | 12.8%) account for the highest median family income in Grove with $93,523 per family, while 2-person families (1,267 | 64.4%) have the highest median income of $32,036 per family member.
| Income Bracket | # Families | Median Income |
| 2-Person Families | 1,267 (64.4%) | $64,071 |
| 3-Person Families | 155 (7.9%) | $79,129 |
| 4-Person Families | 211 (10.7%) | $83,787 |
| 5-Person Families | 252 (12.8%) | $93,523 |
| 6-Person Families | 40 (2.0%) | $0 |
| 7+ Person Families | 41 (2.1%) | $0 |
| Total | 1,966 (100.0%) | $66,386 |
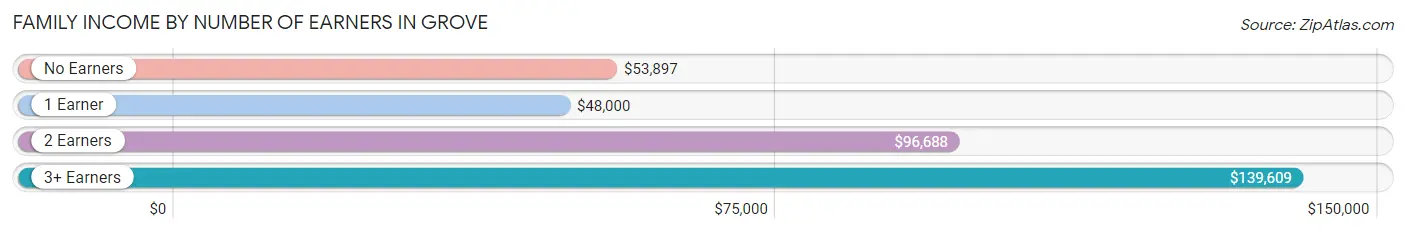
Family Income by Number of Earners in Grove
The median family income in Grove is $66,386, with families comprising 3+ earners (121) having the highest median family income of $139,609, while families with 1 earner (612) have the lowest median family income of $48,000, accounting for 6.1% and 31.1% of families, respectively.
| Number of Earners | # Families | Median Income |
| No Earners | 555 (28.2%) | $53,897 |
| 1 Earner | 612 (31.1%) | $48,000 |
| 2 Earners | 678 (34.5%) | $96,688 |
| 3+ Earners | 121 (6.1%) | $139,609 |
| Total | 1,966 (100.0%) | $66,386 |
Household Income in Grove
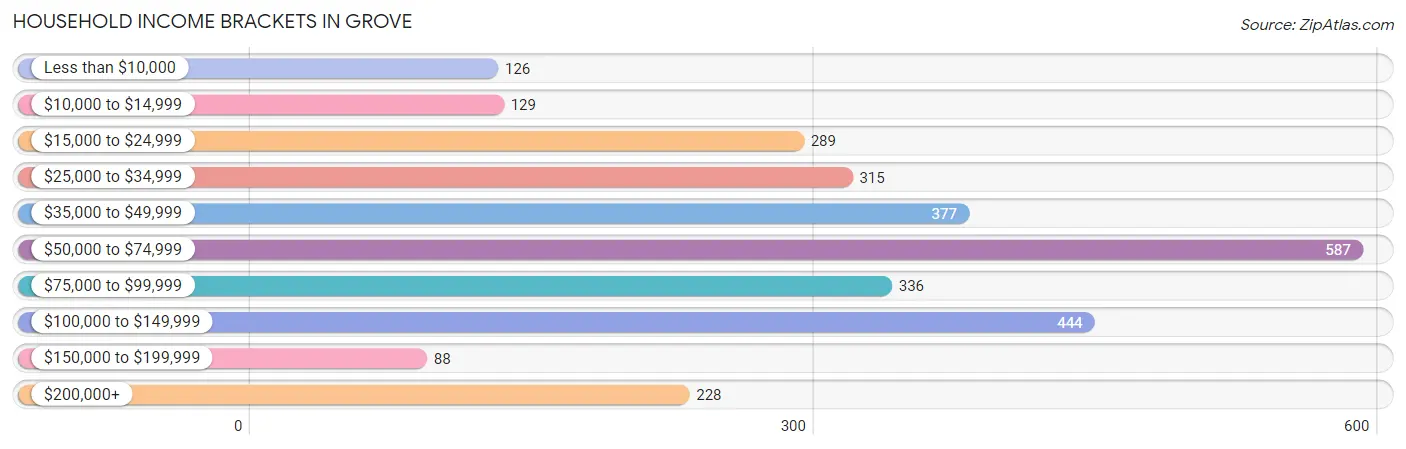
Household Income Brackets in Grove
With 587 households falling in the category, the $50,000 to $74,999 income range is the most frequent in Grove, accounting for 20.1% of all households. In contrast, only 88 households (3.0%) fall into the $150,000 to $199,999 income bracket, making it the least populous group.
| Income Bracket | # Households | % Households |
| Less than $10,000 | 126 | 4.3% |
| $10,000 to $14,999 | 129 | 4.4% |
| $15,000 to $24,999 | 289 | 9.9% |
| $25,000 to $34,999 | 315 | 10.8% |
| $35,000 to $49,999 | 377 | 12.9% |
| $50,000 to $74,999 | 587 | 20.1% |
| $75,000 to $99,999 | 336 | 11.5% |
| $100,000 to $149,999 | 444 | 15.2% |
| $150,000 to $199,999 | 88 | 3.0% |
| $200,000+ | 228 | 7.8% |
Household Income by Householder Age in Grove
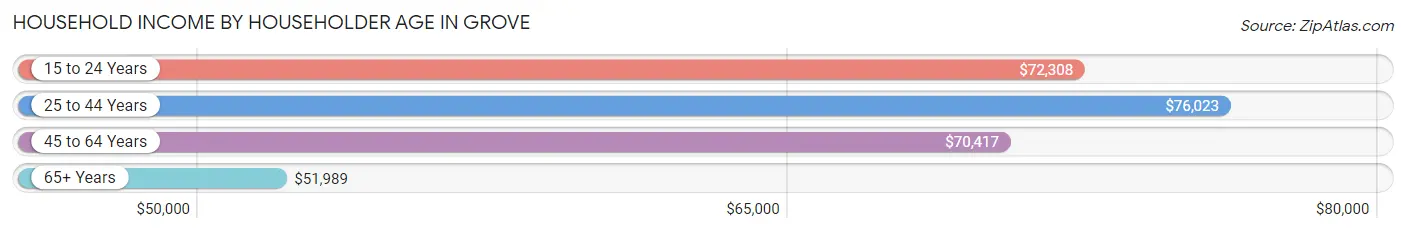
The median household income in Grove is $56,469, with the highest median household income of $76,023 found in the 25 to 44 years age bracket for the primary householder. A total of 686 households (23.5%) fall into this category. Meanwhile, the 65+ years age bracket for the primary householder has the lowest median household income of $51,989, with 1,144 households (39.2%) in this group.
| Income Bracket | # Households | Median Income |
| 15 to 24 Years | 82 (2.8%) | $72,308 |
| 25 to 44 Years | 686 (23.5%) | $76,023 |
| 45 to 64 Years | 1,009 (34.5%) | $70,417 |
| 65+ Years | 1,144 (39.2%) | $51,989 |
| Total | 2,921 (100.0%) | $56,469 |
Poverty in Grove
Income Below Poverty by Sex and Age in Grove
With 16.5% poverty level for males and 20.3% for females among the residents of Grove, 12 to 14 year old males and under 5 year old females are the most vulnerable to poverty, with 63 males (38.4%) and 87 females (64.0%) in their respective age groups living below the poverty level.
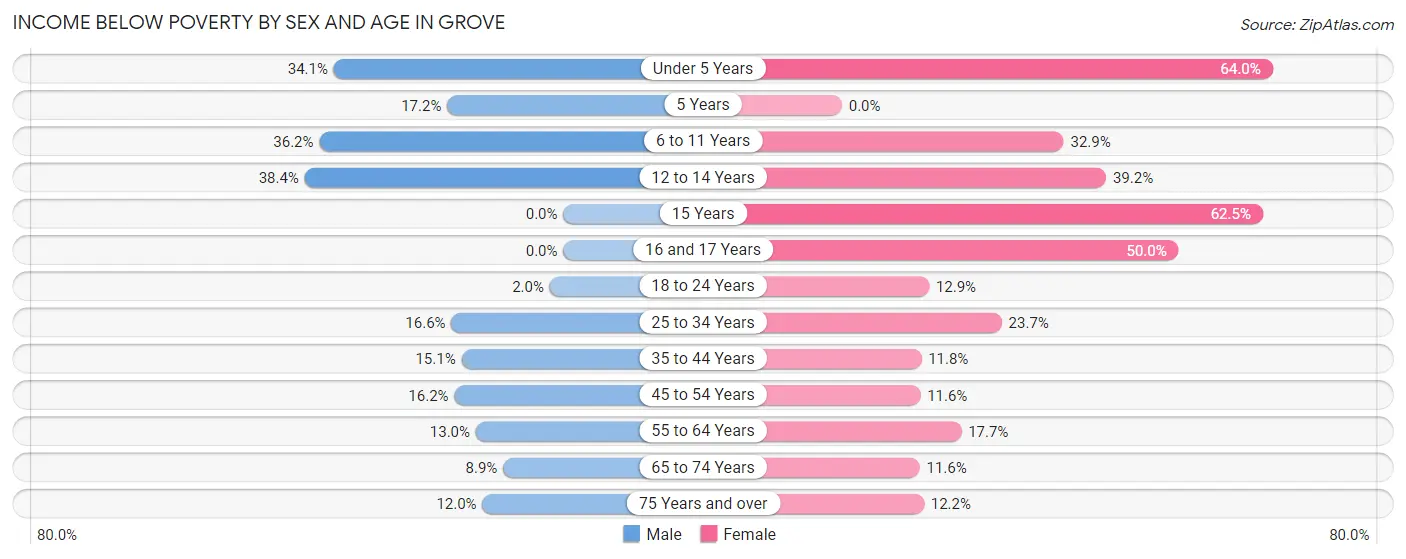
| Age Bracket | Male | Female |
| Under 5 Years | 45 (34.1%) | 87 (64.0%) |
| 5 Years | 5 (17.2%) | 0 (0.0%) |
| 6 to 11 Years | 125 (36.2%) | 81 (32.9%) |
| 12 to 14 Years | 63 (38.4%) | 51 (39.2%) |
| 15 Years | 0 (0.0%) | 25 (62.5%) |
| 16 and 17 Years | 0 (0.0%) | 28 (50.0%) |
| 18 to 24 Years | 4 (2.0%) | 22 (12.9%) |
| 25 to 34 Years | 54 (16.6%) | 99 (23.7%) |
| 35 to 44 Years | 51 (15.1%) | 52 (11.8%) |
| 45 to 54 Years | 56 (16.2%) | 44 (11.6%) |
| 55 to 64 Years | 69 (13.0%) | 114 (17.7%) |
| 65 to 74 Years | 47 (8.9%) | 44 (11.6%) |
| 75 Years and over | 40 (12.0%) | 47 (12.2%) |
| Total | 559 (16.5%) | 694 (20.3%) |
Income Above Poverty by Sex and Age in Grove
According to the poverty statistics in Grove, males aged 15 years and females aged 5 years are the age groups that are most secure financially, with 100.0% of males and 100.0% of females in these age groups living above the poverty line.
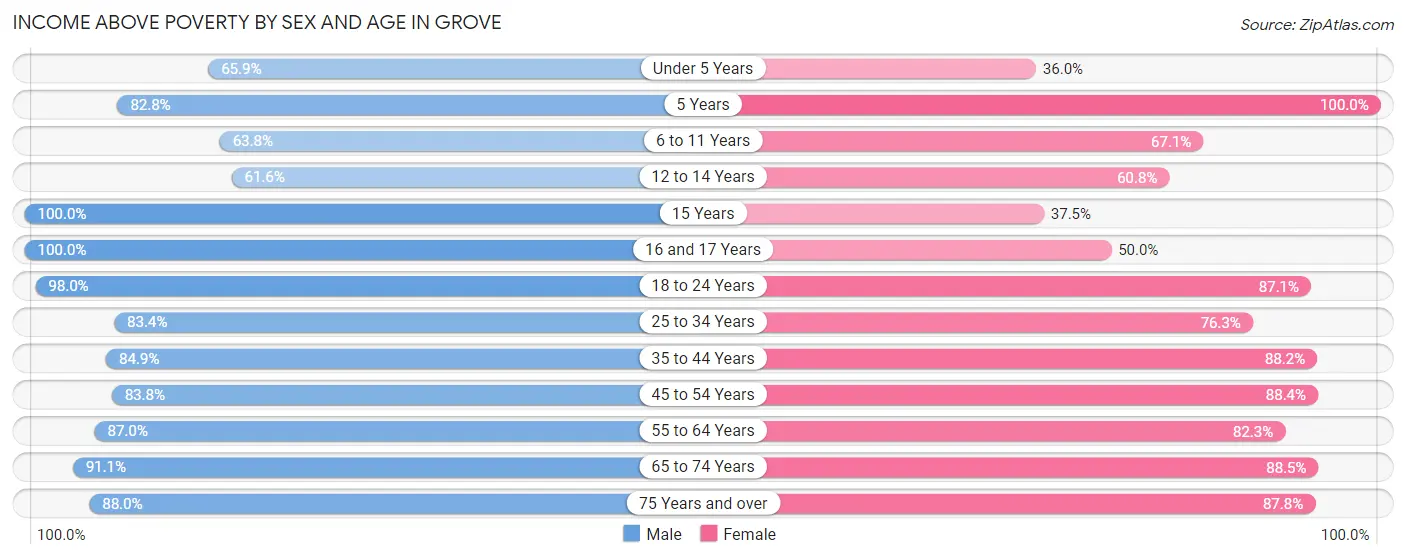
| Age Bracket | Male | Female |
| Under 5 Years | 87 (65.9%) | 49 (36.0%) |
| 5 Years | 24 (82.8%) | 4 (100.0%) |
| 6 to 11 Years | 220 (63.8%) | 165 (67.1%) |
| 12 to 14 Years | 101 (61.6%) | 79 (60.8%) |
| 15 Years | 73 (100.0%) | 15 (37.5%) |
| 16 and 17 Years | 54 (100.0%) | 28 (50.0%) |
| 18 to 24 Years | 195 (98.0%) | 148 (87.1%) |
| 25 to 34 Years | 271 (83.4%) | 318 (76.3%) |
| 35 to 44 Years | 286 (84.9%) | 389 (88.2%) |
| 45 to 54 Years | 290 (83.8%) | 334 (88.4%) |
| 55 to 64 Years | 462 (87.0%) | 529 (82.3%) |
| 65 to 74 Years | 479 (91.1%) | 337 (88.4%) |
| 75 Years and over | 293 (88.0%) | 339 (87.8%) |
| Total | 2,835 (83.5%) | 2,734 (79.7%) |
Income Below Poverty Among Married-Couple Families in Grove
The poverty statistics for married-couple families in Grove show that 12.5% or 187 of the total 1,495 families live below the poverty line. Families with 3 or 4 children have the highest poverty rate of 44.3%, comprising of 89 families. On the other hand, families with no children have the lowest poverty rate of 6.6%, which includes 68 families.
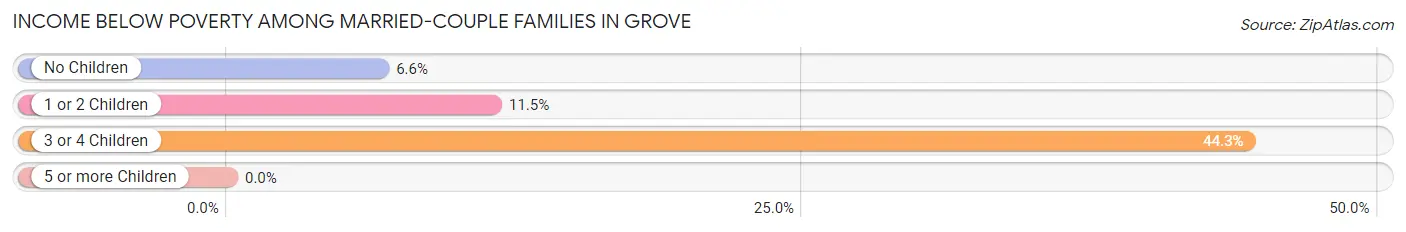
| Children | Above Poverty | Below Poverty |
| No Children | 965 (93.4%) | 68 (6.6%) |
| 1 or 2 Children | 231 (88.5%) | 30 (11.5%) |
| 3 or 4 Children | 112 (55.7%) | 89 (44.3%) |
| 5 or more Children | 0 (0.0%) | 0 (0.0%) |
| Total | 1,308 (87.5%) | 187 (12.5%) |
Income Below Poverty Among Single-Parent Households in Grove
According to the poverty data in Grove, 9.1% or 17 single-father households and 23.5% or 67 single-mother households are living below the poverty line. Among single-father households, those with 1 or 2 children have the highest poverty rate, with 10 households (100.0%) experiencing poverty. Likewise, among single-mother households, those with 5 or more children have the highest poverty rate, with 7 households (100.0%) falling below the poverty line.
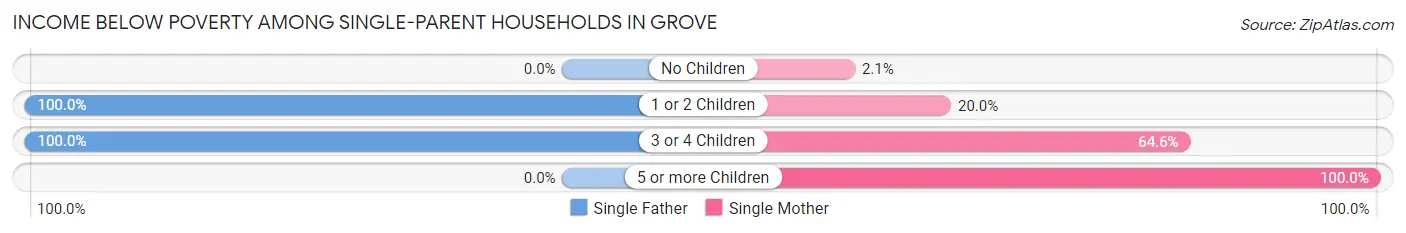
| Children | Single Father | Single Mother |
| No Children | 0 (0.0%) | 2 (2.1%) |
| 1 or 2 Children | 10 (100.0%) | 27 (20.0%) |
| 3 or 4 Children | 7 (100.0%) | 31 (64.6%) |
| 5 or more Children | 0 (0.0%) | 7 (100.0%) |
| Total | 17 (9.1%) | 67 (23.5%) |
Income Below Poverty Among Married-Couple vs Single-Parent Households in Grove
The poverty data for Grove shows that 187 of the married-couple family households (12.5%) and 84 of the single-parent households (17.8%) are living below the poverty level. Within the married-couple family households, those with 3 or 4 children have the highest poverty rate, with 89 households (44.3%) falling below the poverty line. Among the single-parent households, those with 5 or more children have the highest poverty rate, with 7 household (100.0%) living below poverty.
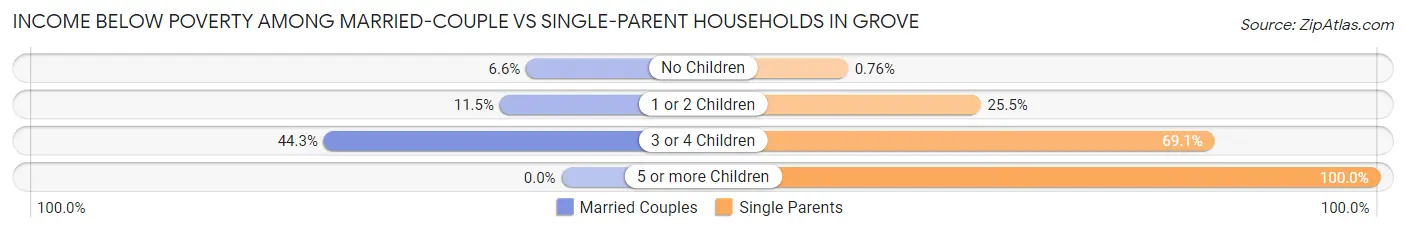
| Children | Married-Couple Families | Single-Parent Households |
| No Children | 68 (6.6%) | 2 (0.8%) |
| 1 or 2 Children | 30 (11.5%) | 37 (25.5%) |
| 3 or 4 Children | 89 (44.3%) | 38 (69.1%) |
| 5 or more Children | 0 (0.0%) | 7 (100.0%) |
| Total | 187 (12.5%) | 84 (17.8%) |
Race in Grove
The most populous races in Grove are White / Caucasian (5,193 | 74.1%), Two or more Races (808 | 11.5%), and Native / Alaskan (786 | 11.2%).
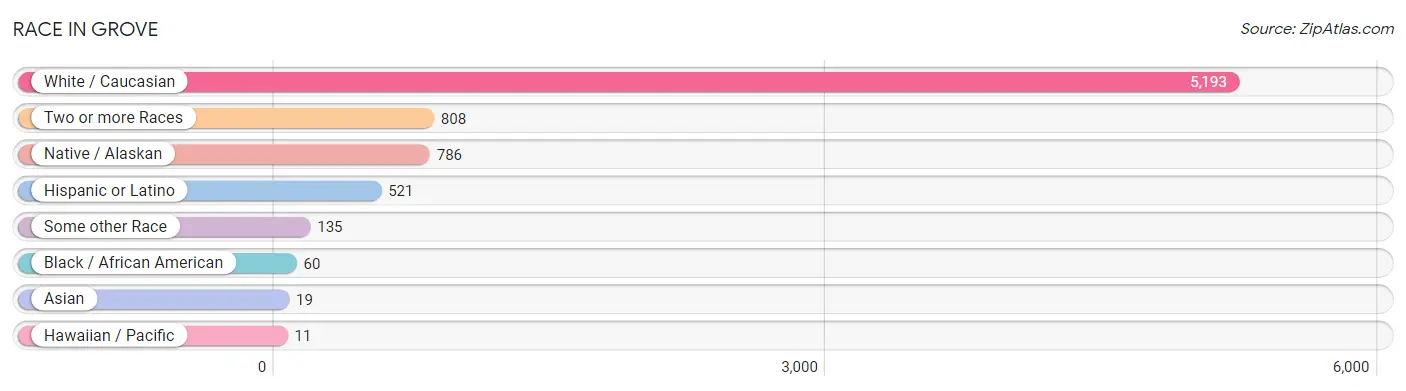
| Race | # Population | % Population |
| Asian | 19 | 0.3% |
| Black / African American | 60 | 0.9% |
| Hawaiian / Pacific | 11 | 0.2% |
| Hispanic or Latino | 521 | 7.4% |
| Native / Alaskan | 786 | 11.2% |
| White / Caucasian | 5,193 | 74.1% |
| Two or more Races | 808 | 11.5% |
| Some other Race | 135 | 1.9% |
| Total | 7,012 | 100.0% |
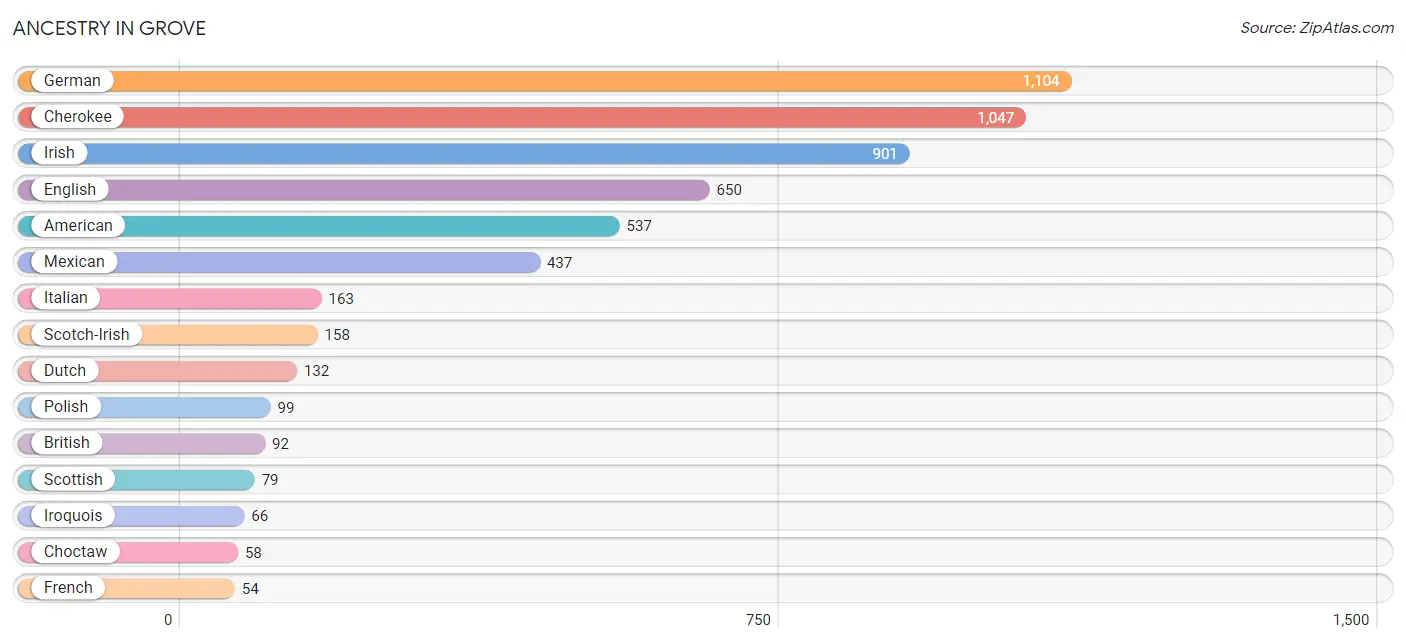
Ancestry in Grove
The most populous ancestries reported in Grove are German (1,104 | 15.7%), Cherokee (1,047 | 14.9%), Irish (901 | 12.9%), English (650 | 9.3%), and American (537 | 7.7%), together accounting for 60.5% of all Grove residents.
| Ancestry | # Population | % Population |
| American | 537 | 7.7% |
| Belgian | 27 | 0.4% |
| British | 92 | 1.3% |
| Canadian | 4 | 0.1% |
| Central American | 24 | 0.3% |
| Cherokee | 1,047 | 14.9% |
| Choctaw | 58 | 0.8% |
| Colombian | 13 | 0.2% |
| Comanche | 19 | 0.3% |
| Creek | 22 | 0.3% |
| Czech | 21 | 0.3% |
| Danish | 20 | 0.3% |
| Dutch | 132 | 1.9% |
| Eastern European | 14 | 0.2% |
| English | 650 | 9.3% |
| European | 14 | 0.2% |
| French | 54 | 0.8% |
| French Canadian | 20 | 0.3% |
| German | 1,104 | 15.7% |
| Honduran | 11 | 0.2% |
| Indian (Asian) | 6 | 0.1% |
| Iranian | 36 | 0.5% |
| Irish | 901 | 12.9% |
| Iroquois | 66 | 0.9% |
| Italian | 163 | 2.3% |
| Korean | 29 | 0.4% |
| Mexican | 437 | 6.2% |
| Mexican American Indian | 17 | 0.2% |
| Native Hawaiian | 11 | 0.2% |
| Northern European | 12 | 0.2% |
| Norwegian | 34 | 0.5% |
| Polish | 99 | 1.4% |
| Russian | 10 | 0.1% |
| Salvadoran | 13 | 0.2% |
| Scotch-Irish | 158 | 2.2% |
| Scottish | 79 | 1.1% |
| South African | 19 | 0.3% |
| South American | 13 | 0.2% |
| Spaniard | 25 | 0.4% |
| Spanish | 22 | 0.3% |
| Subsaharan African | 19 | 0.3% |
| Swedish | 53 | 0.8% |
| Swiss | 18 | 0.3% |
| Ukrainian | 1 | 0.0% |
| Welsh | 13 | 0.2% | View All 45 Rows |
Immigrants in Grove
The most numerous immigrant groups reported in Grove came from Central America (74 | 1.1%), Latin America (74 | 1.1%), Mexico (74 | 1.1%), Asia (55 | 0.8%), and Iran (36 | 0.5%), together accounting for 4.5% of all Grove residents.
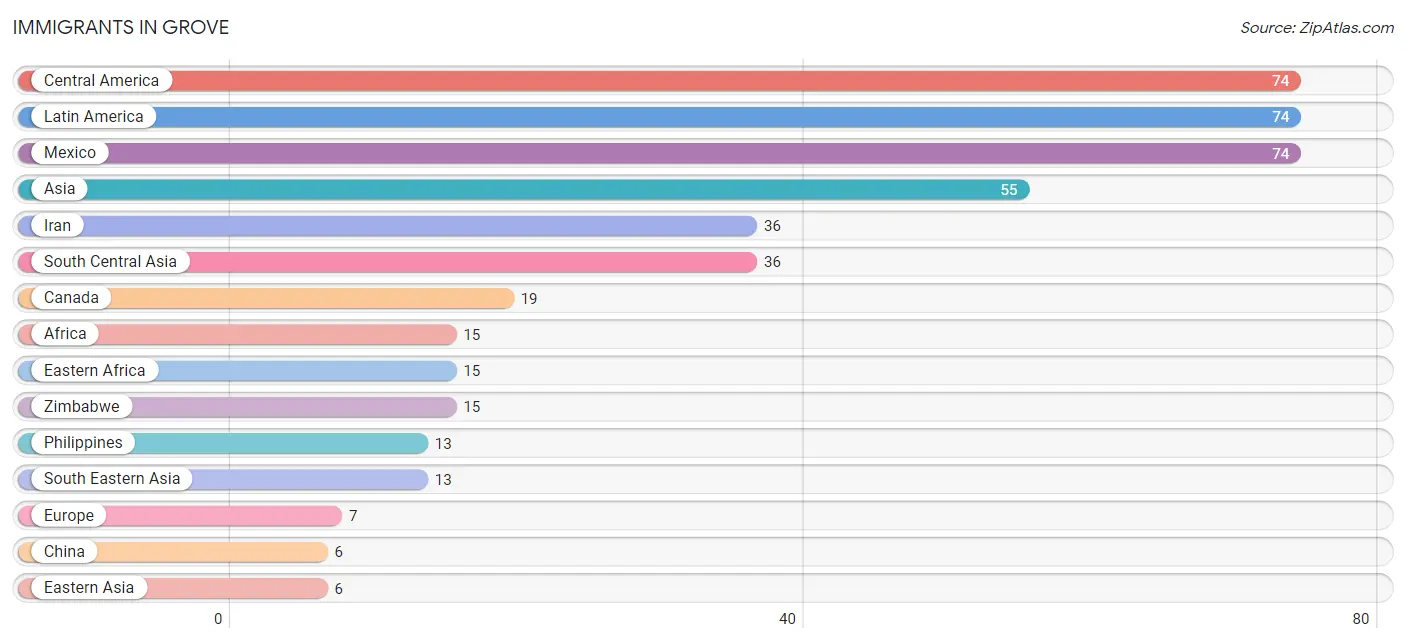
| Immigration Origin | # Population | % Population |
| Africa | 15 | 0.2% |
| Asia | 55 | 0.8% |
| Canada | 19 | 0.3% |
| Central America | 74 | 1.1% |
| China | 6 | 0.1% |
| Eastern Africa | 15 | 0.2% |
| Eastern Asia | 6 | 0.1% |
| Eastern Europe | 1 | 0.0% |
| England | 4 | 0.1% |
| Europe | 7 | 0.1% |
| Germany | 1 | 0.0% |
| Iran | 36 | 0.5% |
| Italy | 1 | 0.0% |
| Latin America | 74 | 1.1% |
| Mexico | 74 | 1.1% |
| Northern Europe | 4 | 0.1% |
| Philippines | 13 | 0.2% |
| South Central Asia | 36 | 0.5% |
| South Eastern Asia | 13 | 0.2% |
| Southern Europe | 1 | 0.0% |
| Ukraine | 1 | 0.0% |
| Western Europe | 1 | 0.0% |
| Zimbabwe | 15 | 0.2% | View All 23 Rows |
Sex and Age in Grove
Sex and Age in Grove
The most populous age groups in Grove are 70 to 74 Years (399 | 11.6%) for men and 60 to 64 Years (358 | 10.1%) for women.
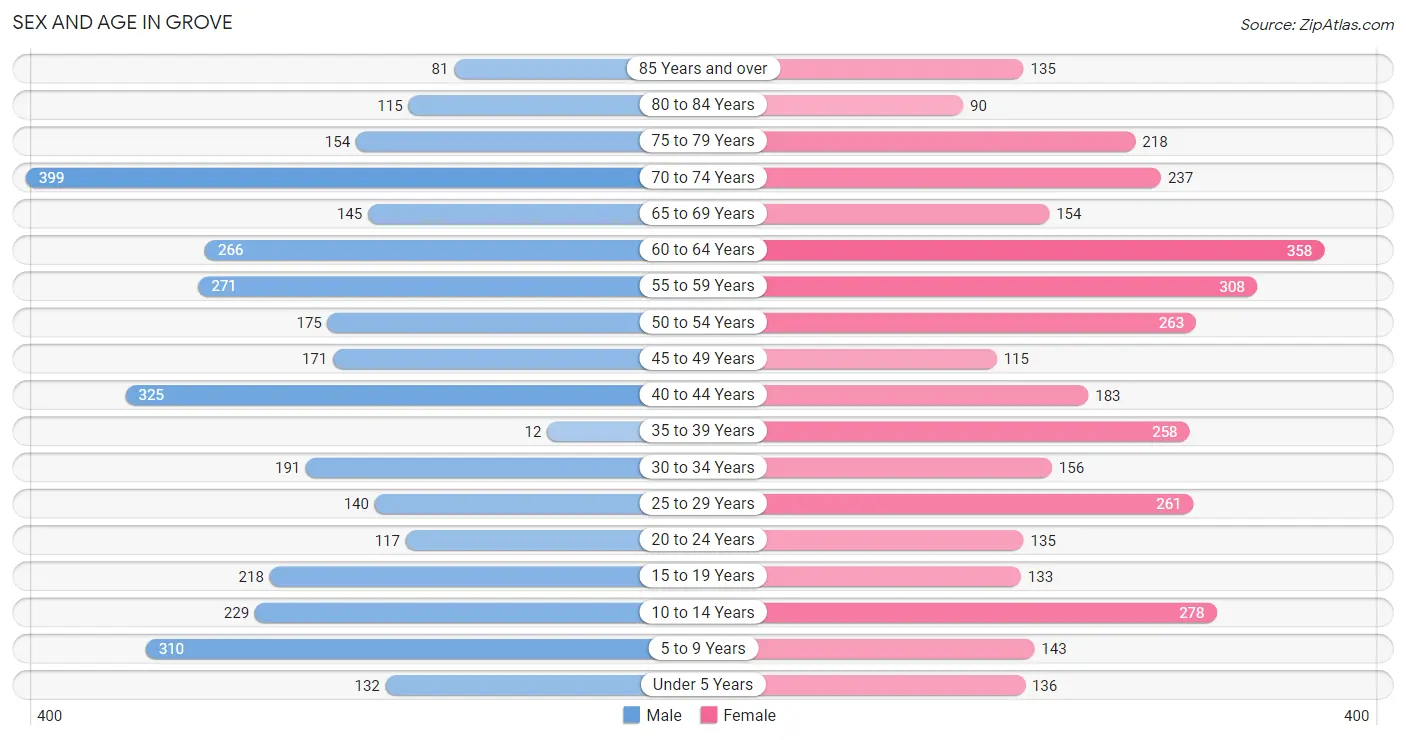
| Age Bracket | Male | Female |
| Under 5 Years | 132 (3.8%) | 136 (3.8%) |
| 5 to 9 Years | 310 (9.0%) | 143 (4.0%) |
| 10 to 14 Years | 229 (6.6%) | 278 (7.8%) |
| 15 to 19 Years | 218 (6.3%) | 133 (3.7%) |
| 20 to 24 Years | 117 (3.4%) | 135 (3.8%) |
| 25 to 29 Years | 140 (4.1%) | 261 (7.3%) |
| 30 to 34 Years | 191 (5.5%) | 156 (4.4%) |
| 35 to 39 Years | 12 (0.4%) | 258 (7.2%) |
| 40 to 44 Years | 325 (9.4%) | 183 (5.1%) |
| 45 to 49 Years | 171 (5.0%) | 115 (3.2%) |
| 50 to 54 Years | 175 (5.1%) | 263 (7.4%) |
| 55 to 59 Years | 271 (7.9%) | 308 (8.6%) |
| 60 to 64 Years | 266 (7.7%) | 358 (10.1%) |
| 65 to 69 Years | 145 (4.2%) | 154 (4.3%) |
| 70 to 74 Years | 399 (11.6%) | 237 (6.7%) |
| 75 to 79 Years | 154 (4.5%) | 218 (6.1%) |
| 80 to 84 Years | 115 (3.3%) | 90 (2.5%) |
| 85 Years and over | 81 (2.4%) | 135 (3.8%) |
| Total | 3,451 (100.0%) | 3,561 (100.0%) |
Families and Households in Grove
Median Family Size in Grove
The median family size in Grove is 2.83 persons per family, with single female/mother families (285 | 14.5%) accounting for the largest median family size of 3.23 persons per family. On the other hand, single male/father families (186 | 9.5%) represent the smallest median family size with 2.01 persons per family.
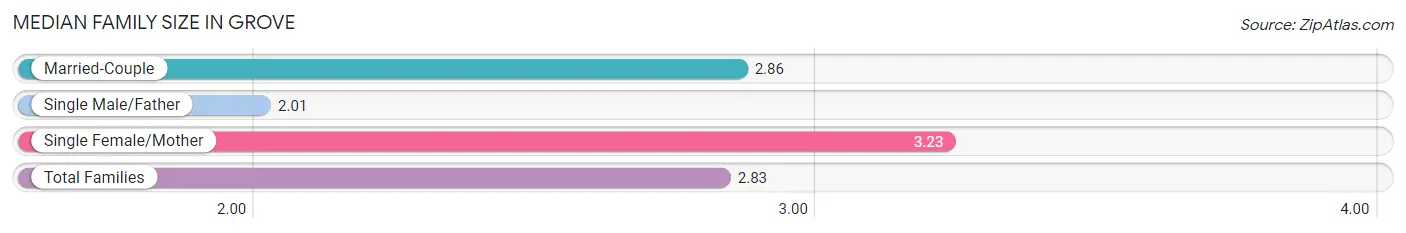
| Family Type | # Families | Family Size |
| Married-Couple | 1,495 (76.0%) | 2.86 |
| Single Male/Father | 186 (9.5%) | 2.01 |
| Single Female/Mother | 285 (14.5%) | 3.23 |
| Total Families | 1,966 (100.0%) | 2.83 |
Median Household Size in Grove
The median household size in Grove is 2.34 persons per household, with single female/mother households (285 | 9.8%) accounting for the largest median household size of 3.44 persons per household. non-family households (955 | 32.7%) represent the smallest median household size with 1.22 persons per household.
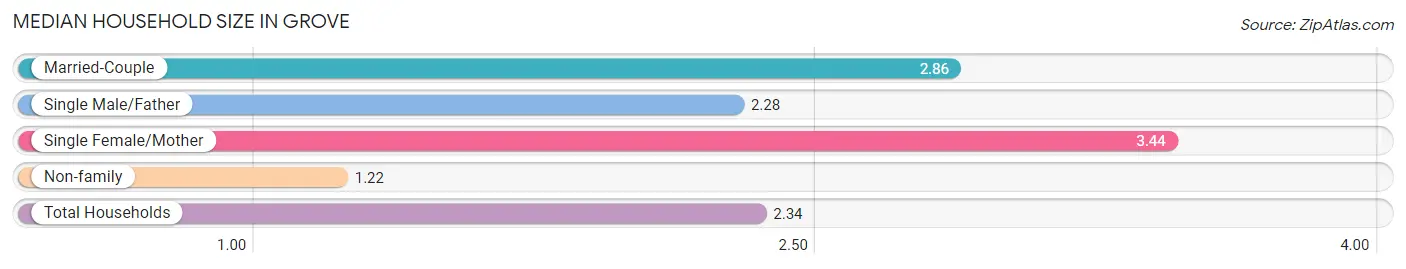
| Household Type | # Households | Household Size |
| Married-Couple | 1,495 (51.2%) | 2.86 |
| Single Male/Father | 186 (6.4%) | 2.28 |
| Single Female/Mother | 285 (9.8%) | 3.44 |
| Non-family | 955 (32.7%) | 1.22 |
| Total Households | 2,921 (100.0%) | 2.34 |
Household Size by Marriage Status in Grove
Out of a total of 2,921 households in Grove, 1,966 (67.3%) are family households, while 955 (32.7%) are nonfamily households. The most numerous type of family households are 2-person households, comprising 1,211, and the most common type of nonfamily households are 1-person households, comprising 753.
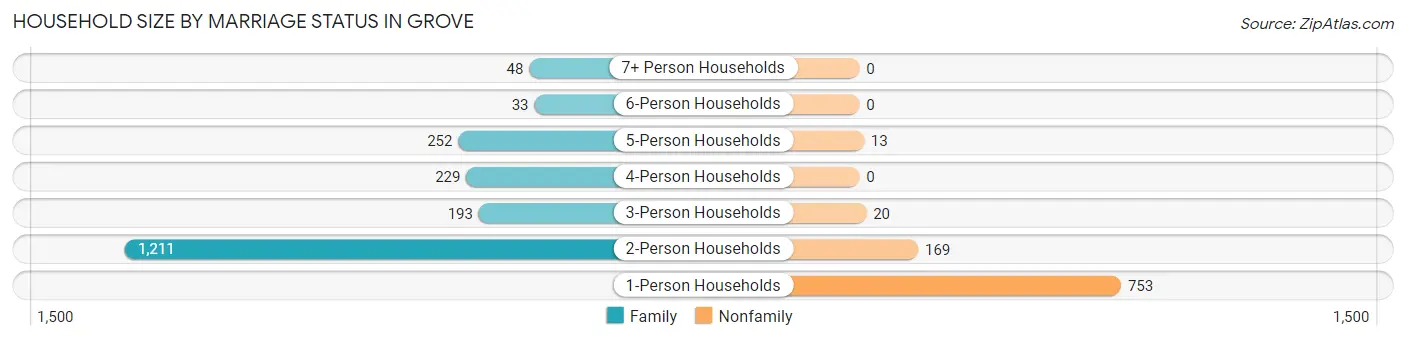
| Household Size | Family Households | Nonfamily Households |
| 1-Person Households | - | 753 (25.8%) |
| 2-Person Households | 1,211 (41.5%) | 169 (5.8%) |
| 3-Person Households | 193 (6.6%) | 20 (0.7%) |
| 4-Person Households | 229 (7.8%) | 0 (0.0%) |
| 5-Person Households | 252 (8.6%) | 13 (0.4%) |
| 6-Person Households | 33 (1.1%) | 0 (0.0%) |
| 7+ Person Households | 48 (1.6%) | 0 (0.0%) |
| Total | 1,966 (67.3%) | 955 (32.7%) |
Female Fertility in Grove
Fertility by Age in Grove
Average fertility rate in Grove is 30.0 births per 1,000 women. Women in the age bracket of 20 to 34 years have the highest fertility rate with 69.0 births per 1,000 women. Women in the age bracket of 20 to 34 years acount for 100.0% of all women with births.
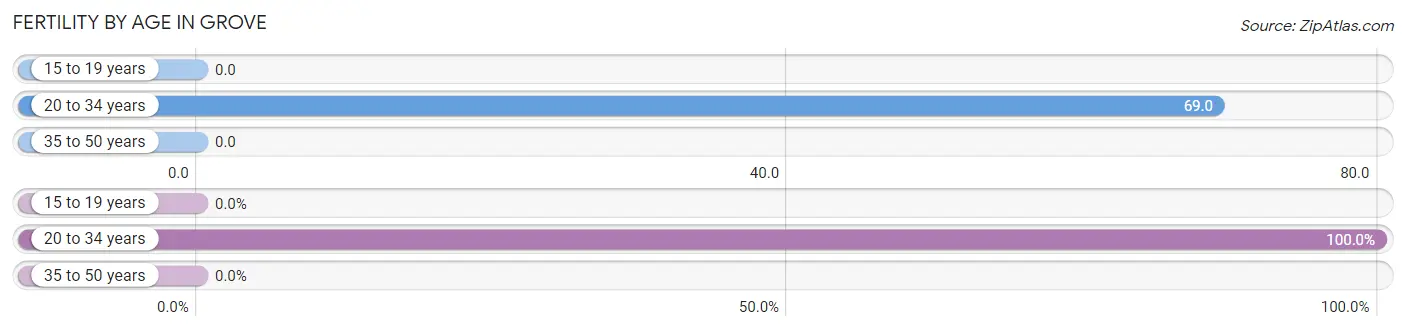
| Age Bracket | Women with Births | Births / 1,000 Women |
| 15 to 19 years | 0 (0.0%) | 0.0 |
| 20 to 34 years | 38 (100.0%) | 69.0 |
| 35 to 50 years | 0 (0.0%) | 0.0 |
| Total | 38 (100.0%) | 30.0 |
Fertility by Age by Marriage Status in Grove
86.8% of women with births (38) in Grove are married. The highest percentage of unmarried women with births falls into 20 to 34 years age bracket with 13.2% of them unmarried at the time of birth, while the lowest percentage of unmarried women with births belong to 20 to 34 years age bracket with 13.2% of them unmarried.
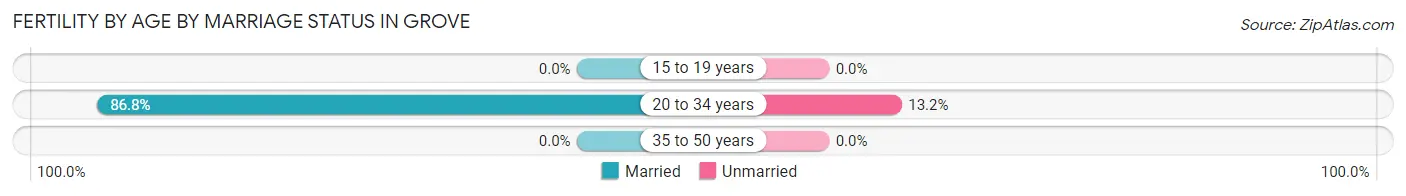
| Age Bracket | Married | Unmarried |
| 15 to 19 years | 0 (0.0%) | 0 (0.0%) |
| 20 to 34 years | 33 (86.8%) | 5 (13.2%) |
| 35 to 50 years | 0 (0.0%) | 0 (0.0%) |
| Total | 33 (86.8%) | 5 (13.2%) |
Fertility by Education in Grove
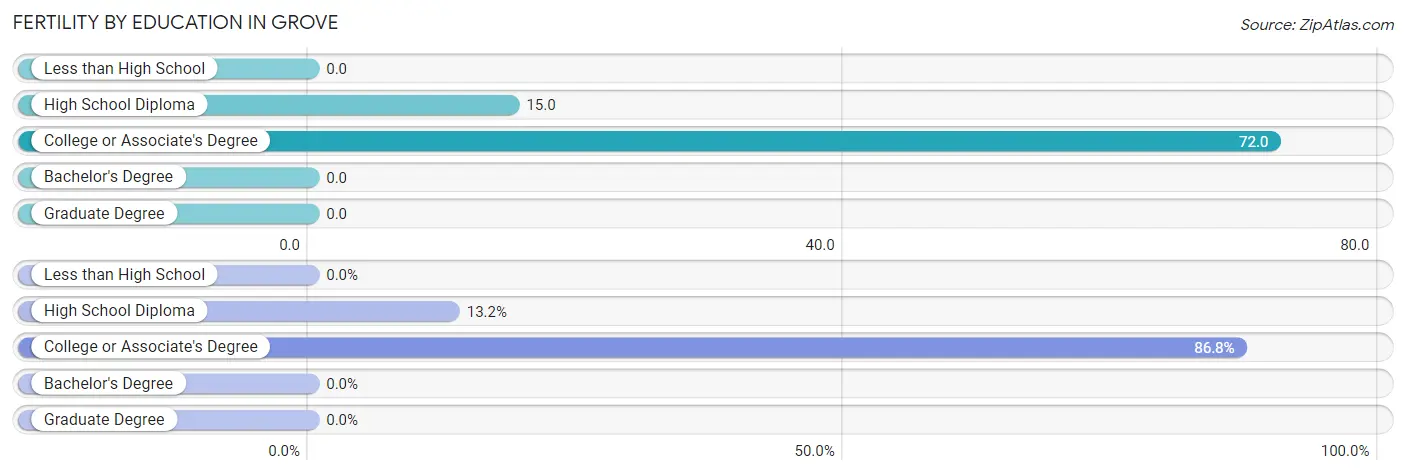
| Educational Attainment | Women with Births | Births / 1,000 Women |
| Less than High School | 0 (0.0%) | 0.0 |
| High School Diploma | 5 (13.2%) | 15.0 |
| College or Associate's Degree | 33 (86.8%) | 72.0 |
| Bachelor's Degree | 0 (0.0%) | 0.0 |
| Graduate Degree | 0 (0.0%) | 0.0 |
| Total | 38 (100.0%) | 30.0 |
Fertility by Education by Marriage Status in Grove
13.2% of women with births in Grove are unmarried. Women with the educational attainment of college or associate's degree are most likely to be married with 100.0% of them married at childbirth, while women with the educational attainment of high school diploma are least likely to be married with 100.0% of them unmarried at childbirth.
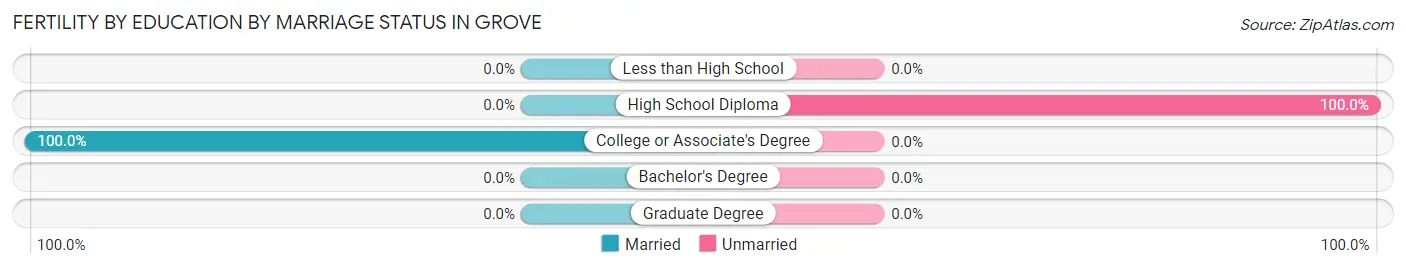
| Educational Attainment | Married | Unmarried |
| Less than High School | 0 (0.0%) | 0 (0.0%) |
| High School Diploma | 0 (0.0%) | 5 (100.0%) |
| College or Associate's Degree | 33 (100.0%) | 0 (0.0%) |
| Bachelor's Degree | 0 (0.0%) | 0 (0.0%) |
| Graduate Degree | 0 (0.0%) | 0 (0.0%) |
| Total | 33 (86.8%) | 5 (13.2%) |
Employment Characteristics in Grove
Employment by Class of Employer in Grove
Among the 2,843 employed individuals in Grove, private company employees (1,587 | 55.8%), self-employed (incorporated) (292 | 10.3%), and self-employed (not incorporated) (266 | 9.4%) make up the most common classes of employment.
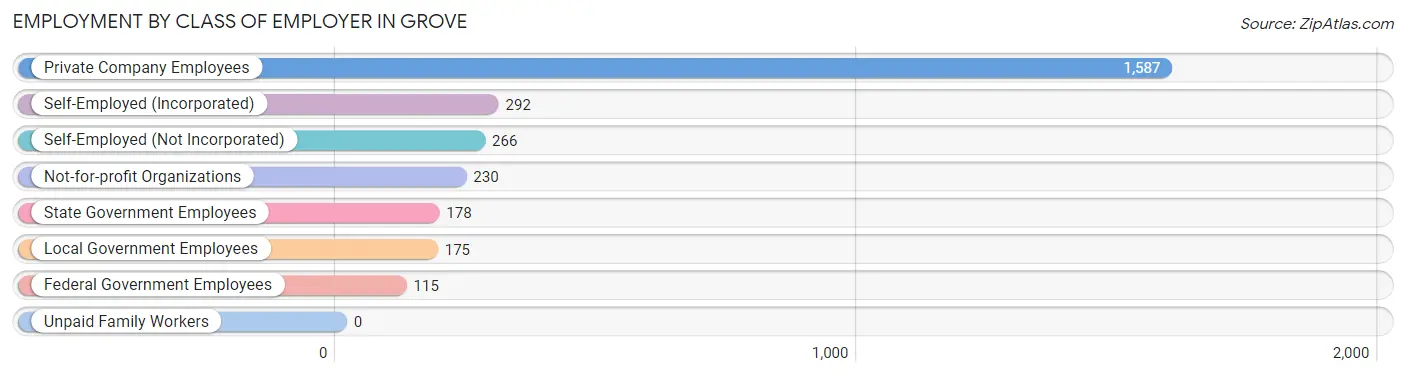
| Employer Class | # Employees | % Employees |
| Private Company Employees | 1,587 | 55.8% |
| Self-Employed (Incorporated) | 292 | 10.3% |
| Self-Employed (Not Incorporated) | 266 | 9.4% |
| Not-for-profit Organizations | 230 | 8.1% |
| Local Government Employees | 175 | 6.2% |
| State Government Employees | 178 | 6.3% |
| Federal Government Employees | 115 | 4.1% |
| Unpaid Family Workers | 0 | 0.0% |
| Total | 2,843 | 100.0% |
Employment Status by Age in Grove
According to the labor force statistics for Grove, out of the total population over 16 years of age (5,669), 51.8% or 2,937 individuals are in the labor force, with 1.4% or 41 of them unemployed. The age group with the highest labor force participation rate is 30 to 34 years, with 84.1% or 292 individuals in the labor force. Within the labor force, the 16 to 19 years age range has the highest percentage of unemployed individuals, with 39.8% or 41 of them being unemployed.
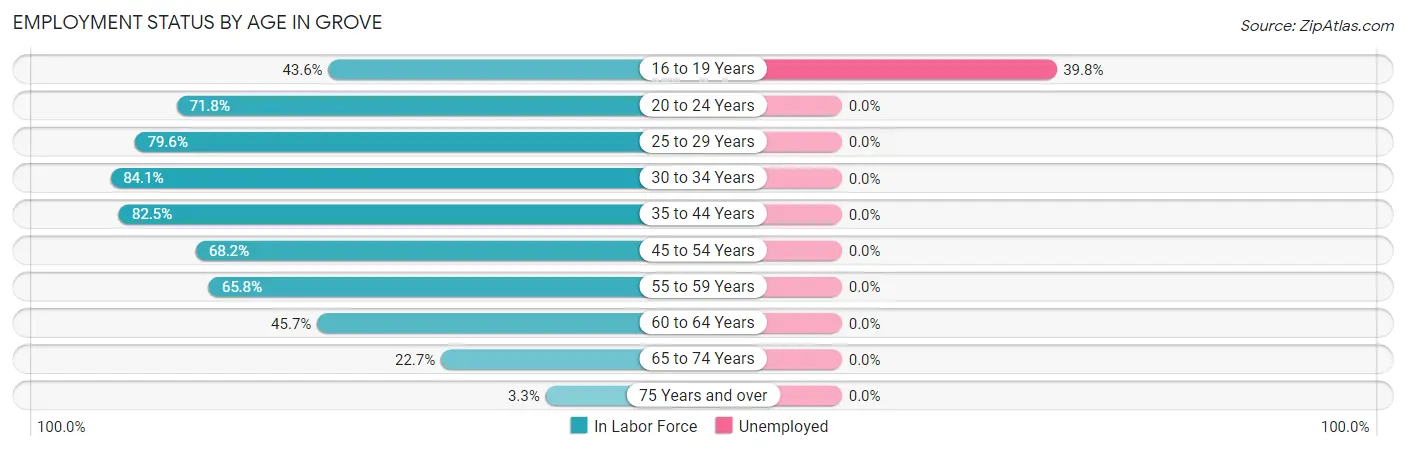
| Age Bracket | In Labor Force | Unemployed |
| 16 to 19 Years | 103 (43.6%) | 41 (39.8%) |
| 20 to 24 Years | 181 (71.8%) | 0 (0.0%) |
| 25 to 29 Years | 319 (79.6%) | 0 (0.0%) |
| 30 to 34 Years | 292 (84.1%) | 0 (0.0%) |
| 35 to 44 Years | 642 (82.5%) | 0 (0.0%) |
| 45 to 54 Years | 494 (68.2%) | 0 (0.0%) |
| 55 to 59 Years | 381 (65.8%) | 0 (0.0%) |
| 60 to 64 Years | 285 (45.7%) | 0 (0.0%) |
| 65 to 74 Years | 212 (22.7%) | 0 (0.0%) |
| 75 Years and over | 26 (3.3%) | 0 (0.0%) |
| Total | 2,937 (51.8%) | 41 (1.4%) |
Employment Status by Educational Attainment in Grove
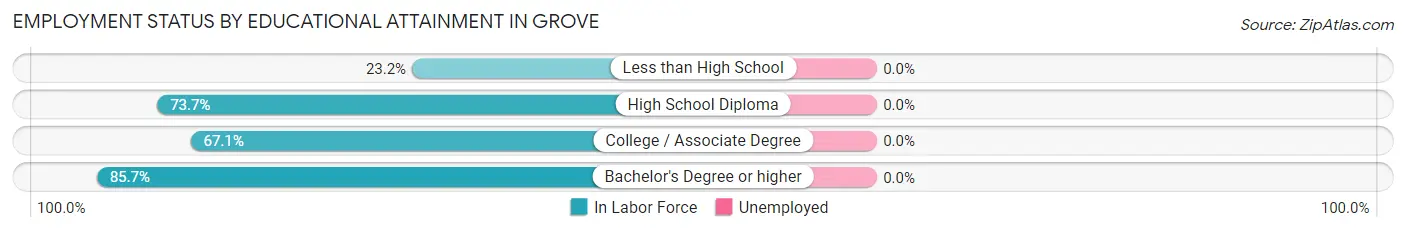
| Educational Attainment | In Labor Force | Unemployed |
| Less than High School | 72 (23.2%) | 0 (0.0%) |
| High School Diploma | 692 (73.7%) | 0 (0.0%) |
| College / Associate Degree | 862 (67.1%) | 0 (0.0%) |
| Bachelor's Degree or higher | 787 (85.7%) | 0 (0.0%) |
| Total | 2,414 (69.9%) | 0 (0.0%) |
Employment Occupations by Sex in Grove
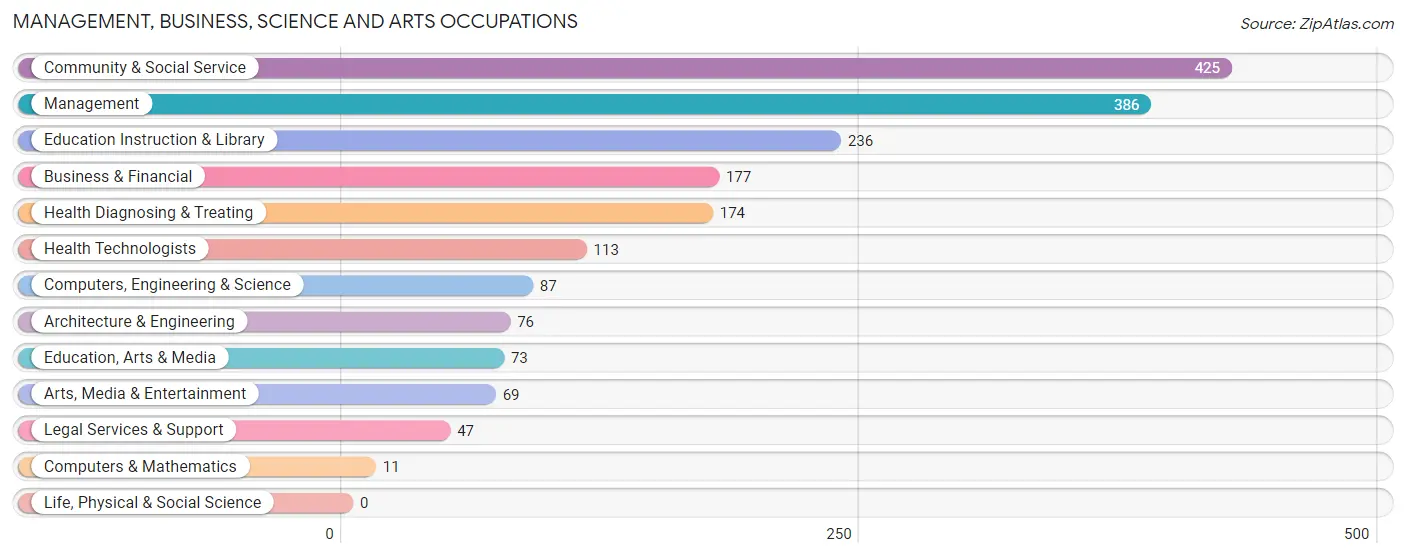
Management, Business, Science and Arts Occupations
The most common Management, Business, Science and Arts occupations in Grove are Community & Social Service (425 | 14.7%), Management (386 | 13.3%), Education Instruction & Library (236 | 8.2%), Business & Financial (177 | 6.1%), and Health Diagnosing & Treating (174 | 6.0%).
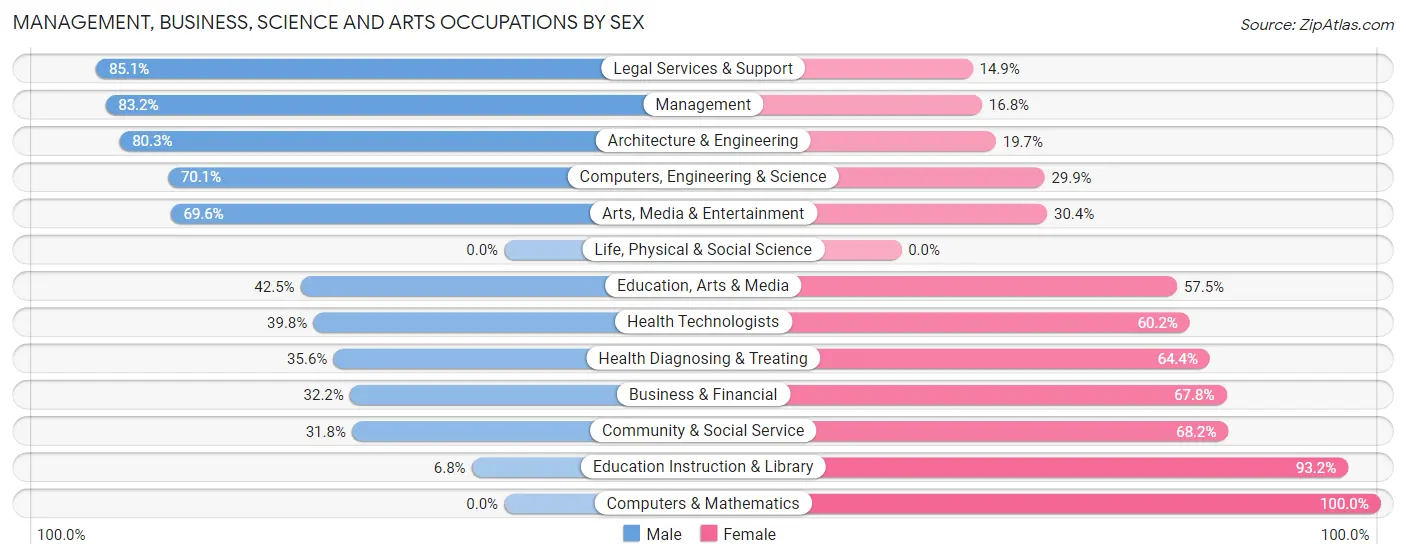
Management, Business, Science and Arts Occupations by Sex
Within the Management, Business, Science and Arts occupations in Grove, the most male-oriented occupations are Legal Services & Support (85.1%), Management (83.2%), and Architecture & Engineering (80.3%), while the most female-oriented occupations are Computers & Mathematics (100.0%), Education Instruction & Library (93.2%), and Community & Social Service (68.2%).
| Occupation | Male | Female |
| Management | 321 (83.2%) | 65 (16.8%) |
| Business & Financial | 57 (32.2%) | 120 (67.8%) |
| Computers, Engineering & Science | 61 (70.1%) | 26 (29.9%) |
| Computers & Mathematics | 0 (0.0%) | 11 (100.0%) |
| Architecture & Engineering | 61 (80.3%) | 15 (19.7%) |
| Life, Physical & Social Science | 0 (0.0%) | 0 (0.0%) |
| Community & Social Service | 135 (31.8%) | 290 (68.2%) |
| Education, Arts & Media | 31 (42.5%) | 42 (57.5%) |
| Legal Services & Support | 40 (85.1%) | 7 (14.9%) |
| Education Instruction & Library | 16 (6.8%) | 220 (93.2%) |
| Arts, Media & Entertainment | 48 (69.6%) | 21 (30.4%) |
| Health Diagnosing & Treating | 62 (35.6%) | 112 (64.4%) |
| Health Technologists | 45 (39.8%) | 68 (60.2%) |
| Total (Category) | 636 (50.9%) | 613 (49.1%) |
| Total (Overall) | 1,465 (50.6%) | 1,429 (49.4%) |
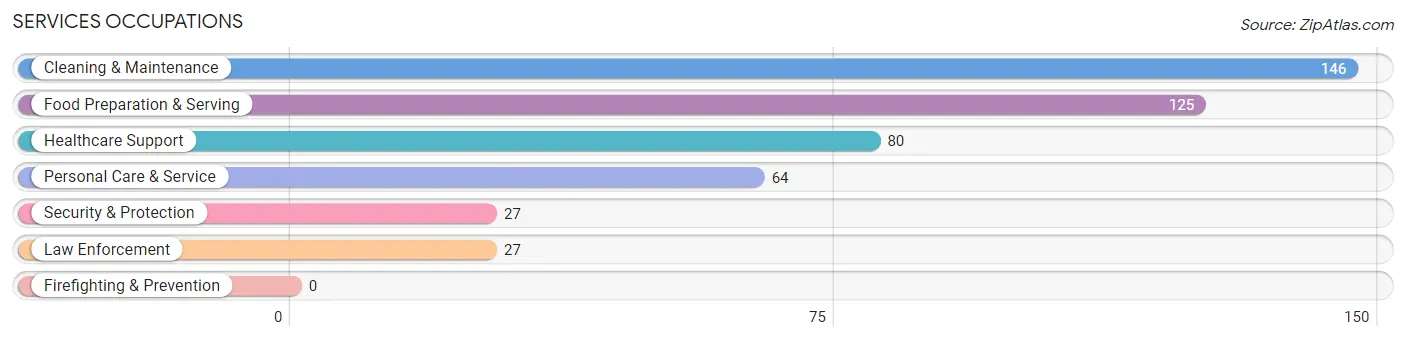
Services Occupations
The most common Services occupations in Grove are Cleaning & Maintenance (146 | 5.0%), Food Preparation & Serving (125 | 4.3%), Healthcare Support (80 | 2.8%), Personal Care & Service (64 | 2.2%), and Security & Protection (27 | 0.9%).
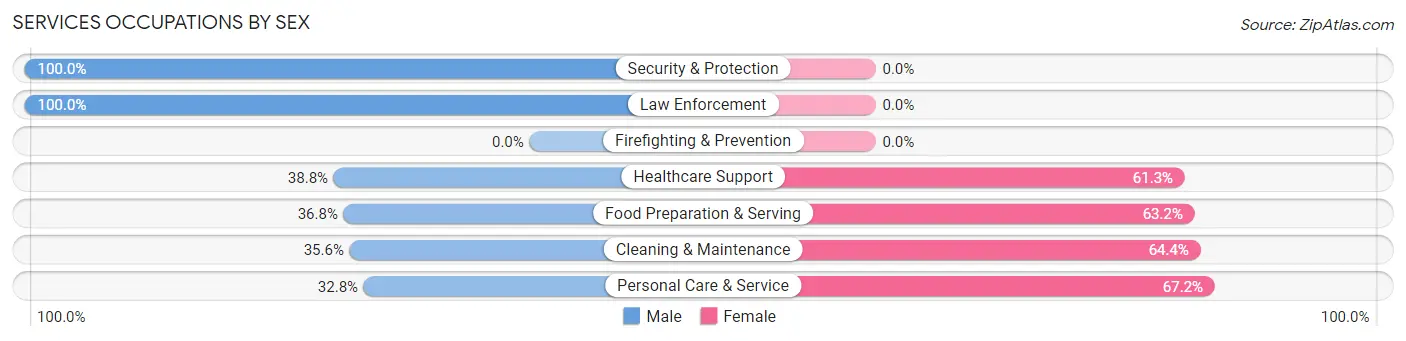
Services Occupations by Sex
Within the Services occupations in Grove, the most male-oriented occupations are Security & Protection (100.0%), Law Enforcement (100.0%), and Healthcare Support (38.8%), while the most female-oriented occupations are Personal Care & Service (67.2%), Cleaning & Maintenance (64.4%), and Food Preparation & Serving (63.2%).
| Occupation | Male | Female |
| Healthcare Support | 31 (38.8%) | 49 (61.3%) |
| Security & Protection | 27 (100.0%) | 0 (0.0%) |
| Firefighting & Prevention | 0 (0.0%) | 0 (0.0%) |
| Law Enforcement | 27 (100.0%) | 0 (0.0%) |
| Food Preparation & Serving | 46 (36.8%) | 79 (63.2%) |
| Cleaning & Maintenance | 52 (35.6%) | 94 (64.4%) |
| Personal Care & Service | 21 (32.8%) | 43 (67.2%) |
| Total (Category) | 177 (40.1%) | 265 (60.0%) |
| Total (Overall) | 1,465 (50.6%) | 1,429 (49.4%) |
Sales and Office Occupations
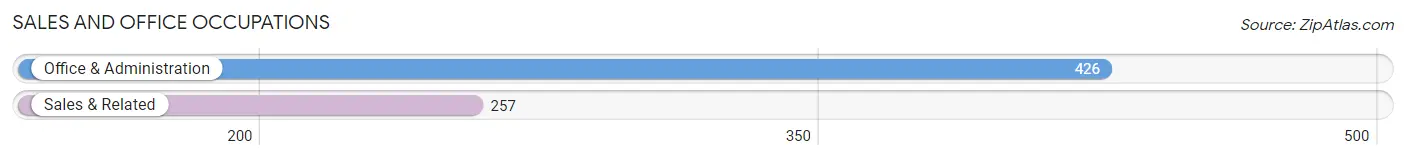
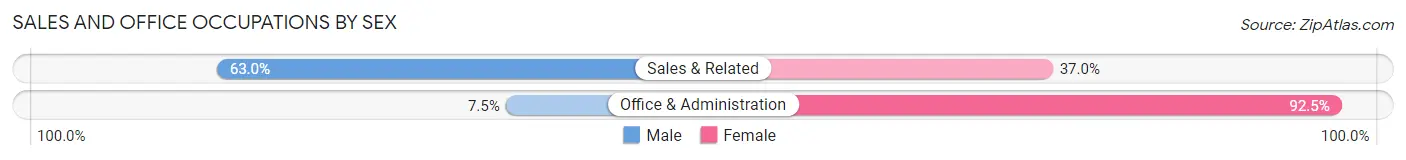
The most common Sales and Office occupations in Grove are Office & Administration (426 | 14.7%), and Sales & Related (257 | 8.9%).
Sales and Office Occupations by Sex
| Occupation | Male | Female |
| Sales & Related | 162 (63.0%) | 95 (37.0%) |
| Office & Administration | 32 (7.5%) | 394 (92.5%) |
| Total (Category) | 194 (28.4%) | 489 (71.6%) |
| Total (Overall) | 1,465 (50.6%) | 1,429 (49.4%) |
Natural Resources, Construction and Maintenance Occupations
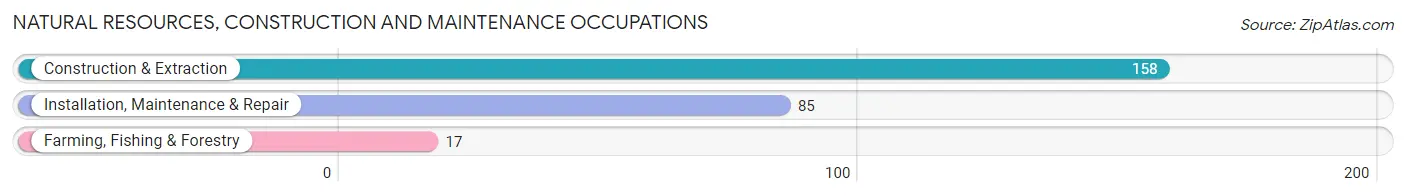
The most common Natural Resources, Construction and Maintenance occupations in Grove are Construction & Extraction (158 | 5.5%), Installation, Maintenance & Repair (85 | 2.9%), and Farming, Fishing & Forestry (17 | 0.6%).
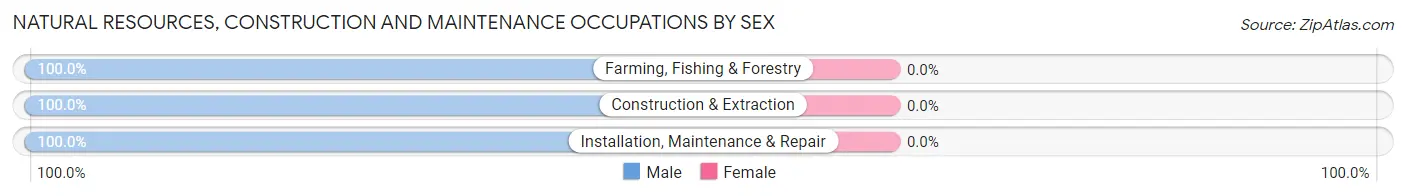
Natural Resources, Construction and Maintenance Occupations by Sex
| Occupation | Male | Female |
| Farming, Fishing & Forestry | 17 (100.0%) | 0 (0.0%) |
| Construction & Extraction | 158 (100.0%) | 0 (0.0%) |
| Installation, Maintenance & Repair | 85 (100.0%) | 0 (0.0%) |
| Total (Category) | 260 (100.0%) | 0 (0.0%) |
| Total (Overall) | 1,465 (50.6%) | 1,429 (49.4%) |
Production, Transportation and Moving Occupations
The most common Production, Transportation and Moving occupations in Grove are Production (137 | 4.7%), Material Moving (104 | 3.6%), and Transportation (19 | 0.7%).
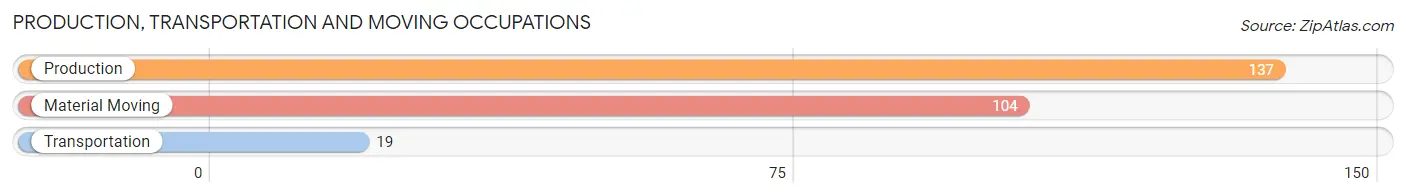
Production, Transportation and Moving Occupations by Sex
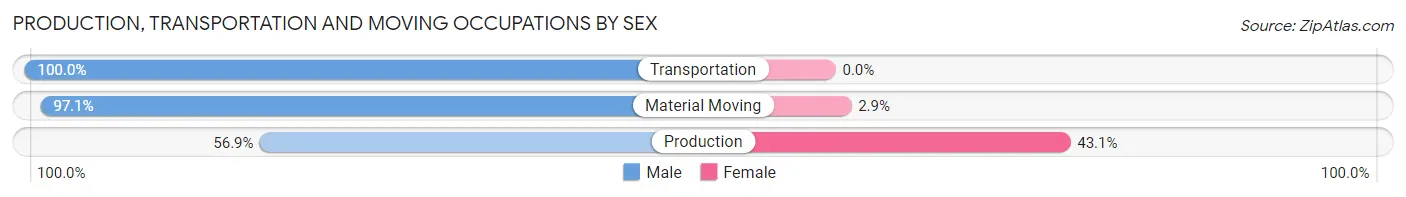
| Occupation | Male | Female |
| Production | 78 (56.9%) | 59 (43.1%) |
| Transportation | 19 (100.0%) | 0 (0.0%) |
| Material Moving | 101 (97.1%) | 3 (2.9%) |
| Total (Category) | 198 (76.1%) | 62 (23.8%) |
| Total (Overall) | 1,465 (50.6%) | 1,429 (49.4%) |
Employment Industries by Sex in Grove
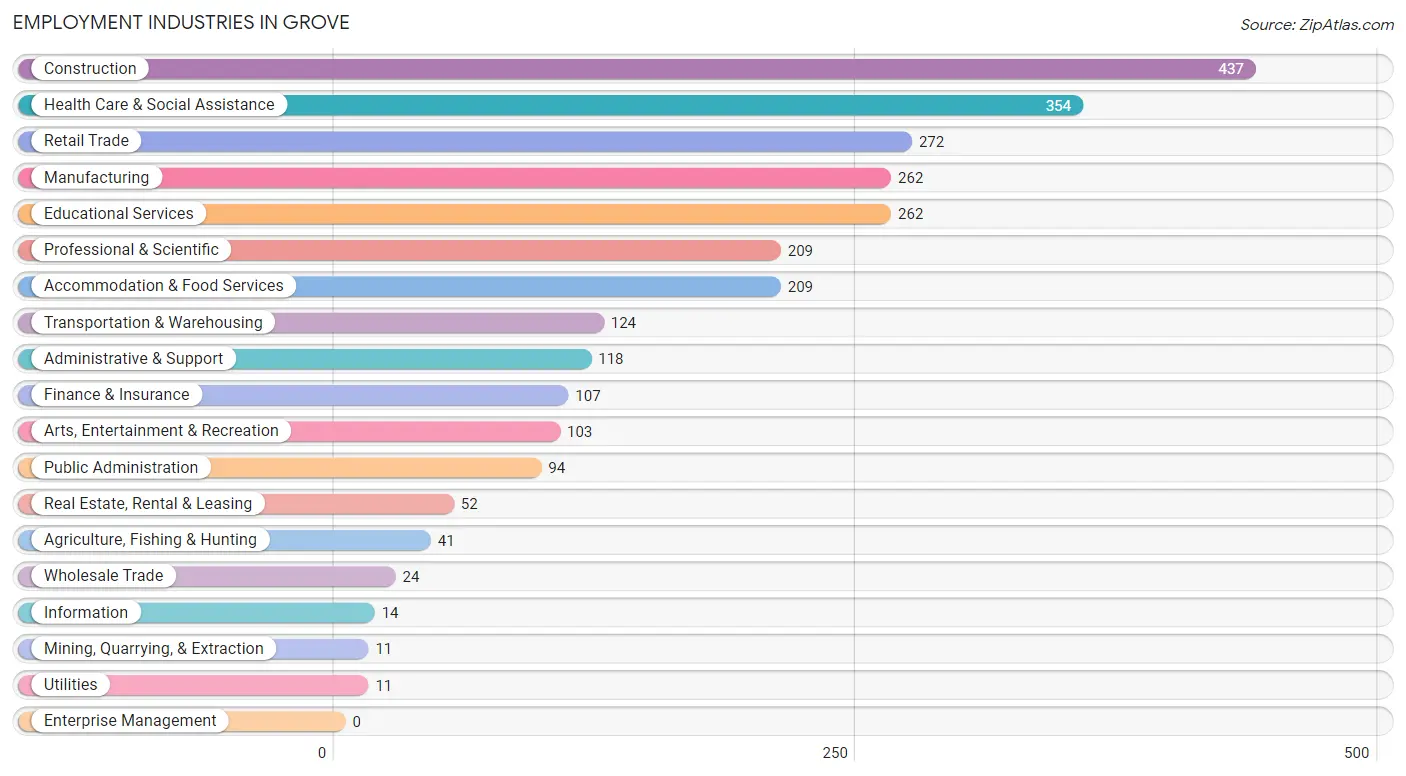
Employment Industries in Grove
The major employment industries in Grove include Construction (437 | 15.1%), Health Care & Social Assistance (354 | 12.2%), Retail Trade (272 | 9.4%), Manufacturing (262 | 9.0%), and Educational Services (262 | 9.0%).
Employment Industries by Sex in Grove
The Grove industries that see more men than women are Mining, Quarrying, & Extraction (100.0%), Utilities (100.0%), and Information (100.0%), whereas the industries that tend to have a higher number of women are Educational Services (93.9%), Health Care & Social Assistance (71.8%), and Real Estate, Rental & Leasing (63.5%).
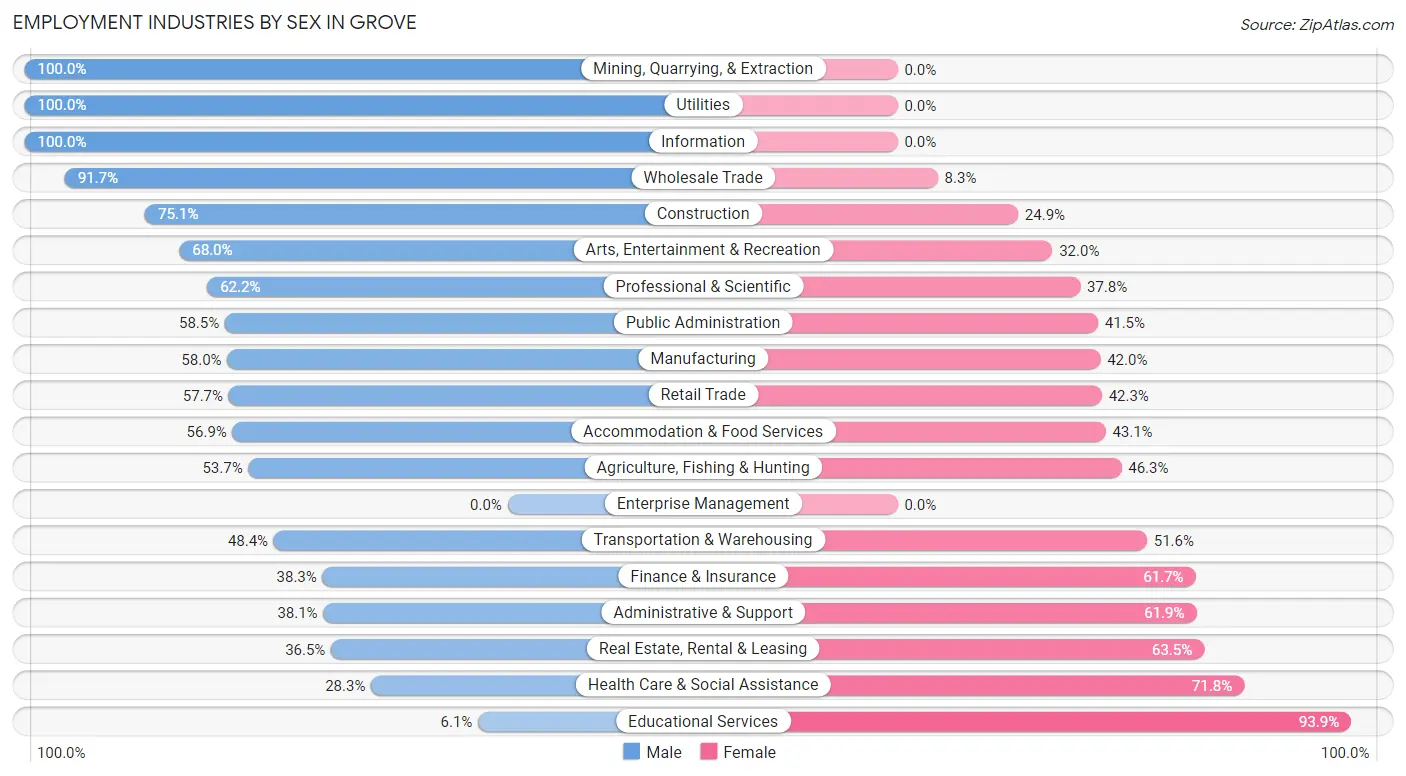
| Industry | Male | Female |
| Agriculture, Fishing & Hunting | 22 (53.7%) | 19 (46.3%) |
| Mining, Quarrying, & Extraction | 11 (100.0%) | 0 (0.0%) |
| Construction | 328 (75.1%) | 109 (24.9%) |
| Manufacturing | 152 (58.0%) | 110 (42.0%) |
| Wholesale Trade | 22 (91.7%) | 2 (8.3%) |
| Retail Trade | 157 (57.7%) | 115 (42.3%) |
| Transportation & Warehousing | 60 (48.4%) | 64 (51.6%) |
| Utilities | 11 (100.0%) | 0 (0.0%) |
| Information | 14 (100.0%) | 0 (0.0%) |
| Finance & Insurance | 41 (38.3%) | 66 (61.7%) |
| Real Estate, Rental & Leasing | 19 (36.5%) | 33 (63.5%) |
| Professional & Scientific | 130 (62.2%) | 79 (37.8%) |
| Enterprise Management | 0 (0.0%) | 0 (0.0%) |
| Administrative & Support | 45 (38.1%) | 73 (61.9%) |
| Educational Services | 16 (6.1%) | 246 (93.9%) |
| Health Care & Social Assistance | 100 (28.2%) | 254 (71.8%) |
| Arts, Entertainment & Recreation | 70 (68.0%) | 33 (32.0%) |
| Accommodation & Food Services | 119 (56.9%) | 90 (43.1%) |
| Public Administration | 55 (58.5%) | 39 (41.5%) |
| Total | 1,465 (50.6%) | 1,429 (49.4%) |
Education in Grove
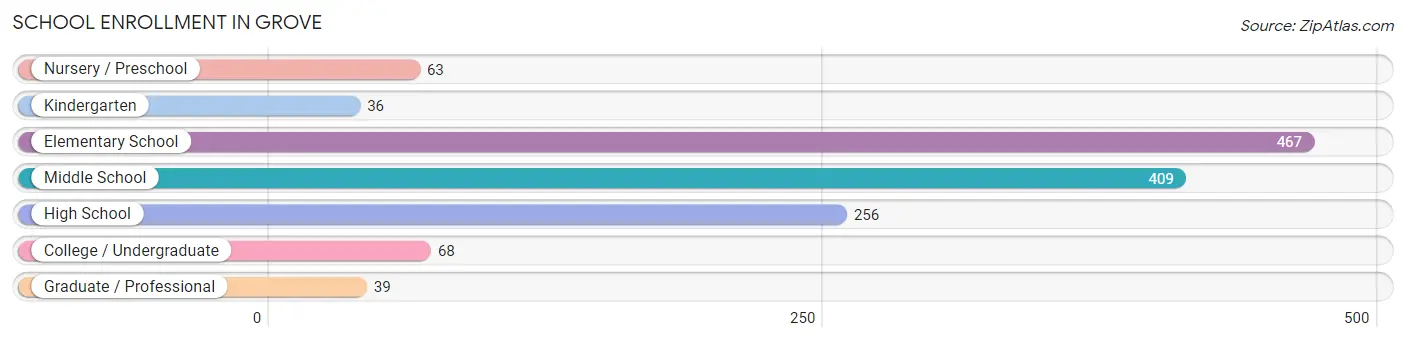
School Enrollment in Grove
The most common levels of schooling among the 1,338 students in Grove are elementary school (467 | 34.9%), middle school (409 | 30.6%), and high school (256 | 19.1%).
| School Level | # Students | % Students |
| Nursery / Preschool | 63 | 4.7% |
| Kindergarten | 36 | 2.7% |
| Elementary School | 467 | 34.9% |
| Middle School | 409 | 30.6% |
| High School | 256 | 19.1% |
| College / Undergraduate | 68 | 5.1% |
| Graduate / Professional | 39 | 2.9% |
| Total | 1,338 | 100.0% |
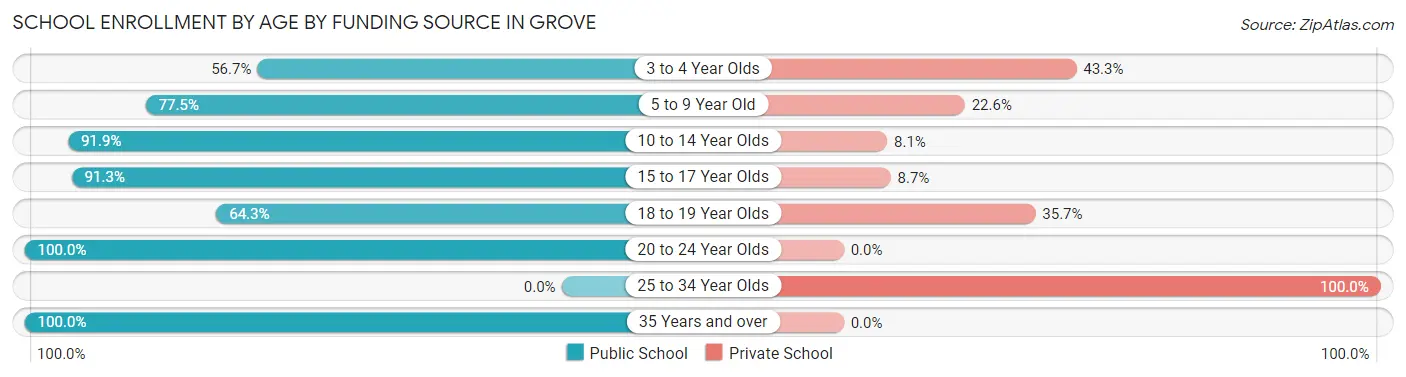
School Enrollment by Age by Funding Source in Grove
Out of a total of 1,338 students who are enrolled in schools in Grove, 213 (15.9%) attend a private institution, while the remaining 1,125 (84.1%) are enrolled in public schools. The age group of 25 to 34 year olds has the highest likelihood of being enrolled in private schools, with 17 (100.0% in the age bracket) enrolled. Conversely, the age group of 20 to 24 year olds has the lowest likelihood of being enrolled in a private school, with 47 (100.0% in the age bracket) attending a public institution.
| Age Bracket | Public School | Private School |
| 3 to 4 Year Olds | 17 (56.7%) | 13 (43.3%) |
| 5 to 9 Year Old | 340 (77.4%) | 99 (22.6%) |
| 10 to 14 Year Olds | 466 (91.9%) | 41 (8.1%) |
| 15 to 17 Year Olds | 188 (91.3%) | 18 (8.7%) |
| 18 to 19 Year Olds | 45 (64.3%) | 25 (35.7%) |
| 20 to 24 Year Olds | 47 (100.0%) | 0 (0.0%) |
| 25 to 34 Year Olds | 0 (0.0%) | 17 (100.0%) |
| 35 Years and over | 22 (100.0%) | 0 (0.0%) |
| Total | 1,125 (84.1%) | 213 (15.9%) |
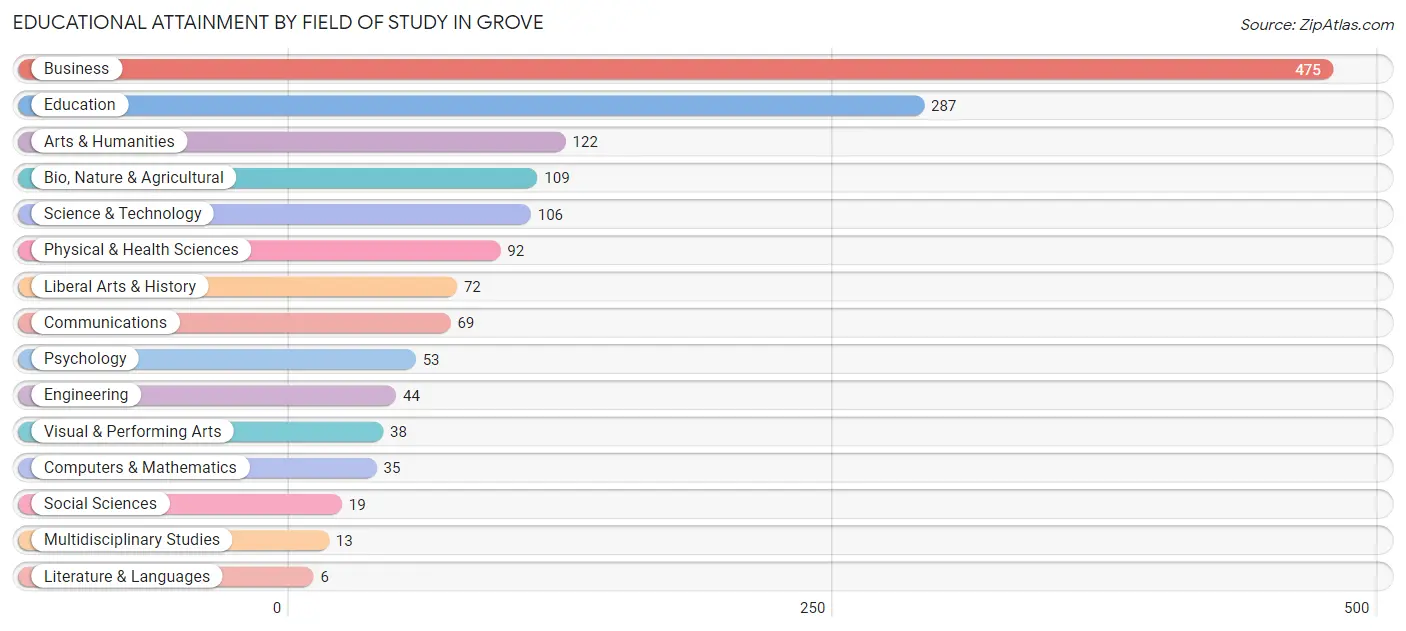
Educational Attainment by Field of Study in Grove
Business (475 | 30.8%), education (287 | 18.6%), arts & humanities (122 | 7.9%), bio, nature & agricultural (109 | 7.1%), and science & technology (106 | 6.9%) are the most common fields of study among 1,540 individuals in Grove who have obtained a bachelor's degree or higher.
| Field of Study | # Graduates | % Graduates |
| Computers & Mathematics | 35 | 2.3% |
| Bio, Nature & Agricultural | 109 | 7.1% |
| Physical & Health Sciences | 92 | 6.0% |
| Psychology | 53 | 3.4% |
| Social Sciences | 19 | 1.2% |
| Engineering | 44 | 2.9% |
| Multidisciplinary Studies | 13 | 0.8% |
| Science & Technology | 106 | 6.9% |
| Business | 475 | 30.8% |
| Education | 287 | 18.6% |
| Literature & Languages | 6 | 0.4% |
| Liberal Arts & History | 72 | 4.7% |
| Visual & Performing Arts | 38 | 2.5% |
| Communications | 69 | 4.5% |
| Arts & Humanities | 122 | 7.9% |
| Total | 1,540 | 100.0% |
Transportation & Commute in Grove
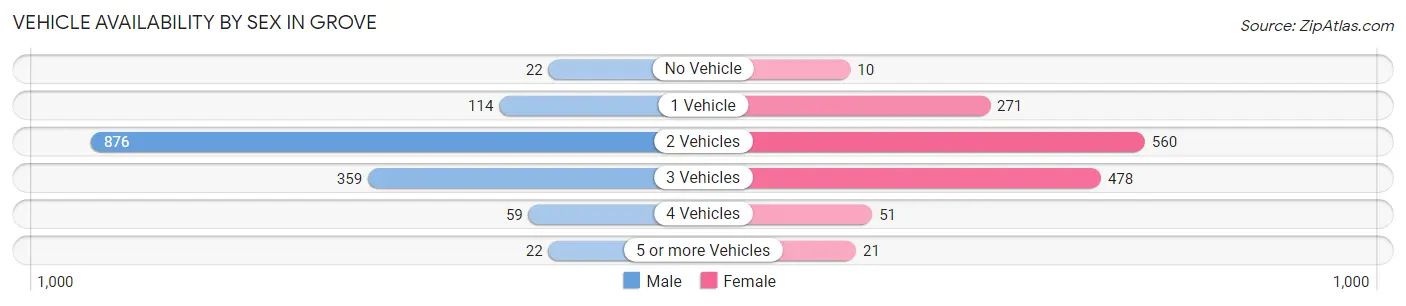
Vehicle Availability by Sex in Grove
The most prevalent vehicle ownership categories in Grove are males with 2 vehicles (876, accounting for 60.3%) and females with 2 vehicles (560, making up 63.0%).
| Vehicles Available | Male | Female |
| No Vehicle | 22 (1.5%) | 10 (0.7%) |
| 1 Vehicle | 114 (7.9%) | 271 (19.5%) |
| 2 Vehicles | 876 (60.3%) | 560 (40.3%) |
| 3 Vehicles | 359 (24.7%) | 478 (34.4%) |
| 4 Vehicles | 59 (4.1%) | 51 (3.7%) |
| 5 or more Vehicles | 22 (1.5%) | 21 (1.5%) |
| Total | 1,452 (100.0%) | 1,391 (100.0%) |
Commute Time in Grove
The most frequently occuring commute durations in Grove are 10 to 14 minutes (717 commuters, 27.6%), 5 to 9 minutes (419 commuters, 16.1%), and 15 to 19 minutes (369 commuters, 14.2%).
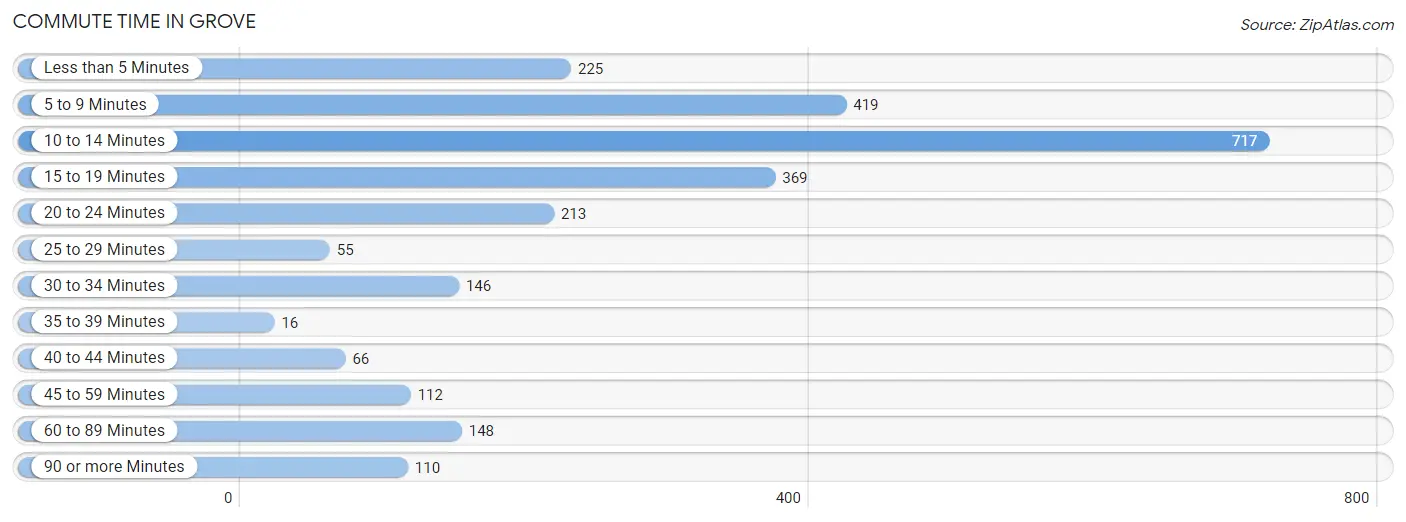
| Commute Time | # Commuters | % Commuters |
| Less than 5 Minutes | 225 | 8.7% |
| 5 to 9 Minutes | 419 | 16.1% |
| 10 to 14 Minutes | 717 | 27.6% |
| 15 to 19 Minutes | 369 | 14.2% |
| 20 to 24 Minutes | 213 | 8.2% |
| 25 to 29 Minutes | 55 | 2.1% |
| 30 to 34 Minutes | 146 | 5.6% |
| 35 to 39 Minutes | 16 | 0.6% |
| 40 to 44 Minutes | 66 | 2.5% |
| 45 to 59 Minutes | 112 | 4.3% |
| 60 to 89 Minutes | 148 | 5.7% |
| 90 or more Minutes | 110 | 4.2% |
Commute Time by Sex in Grove
The most common commute times in Grove are 10 to 14 minutes (363 commuters, 26.2%) for males and 10 to 14 minutes (354 commuters, 29.3%) for females.
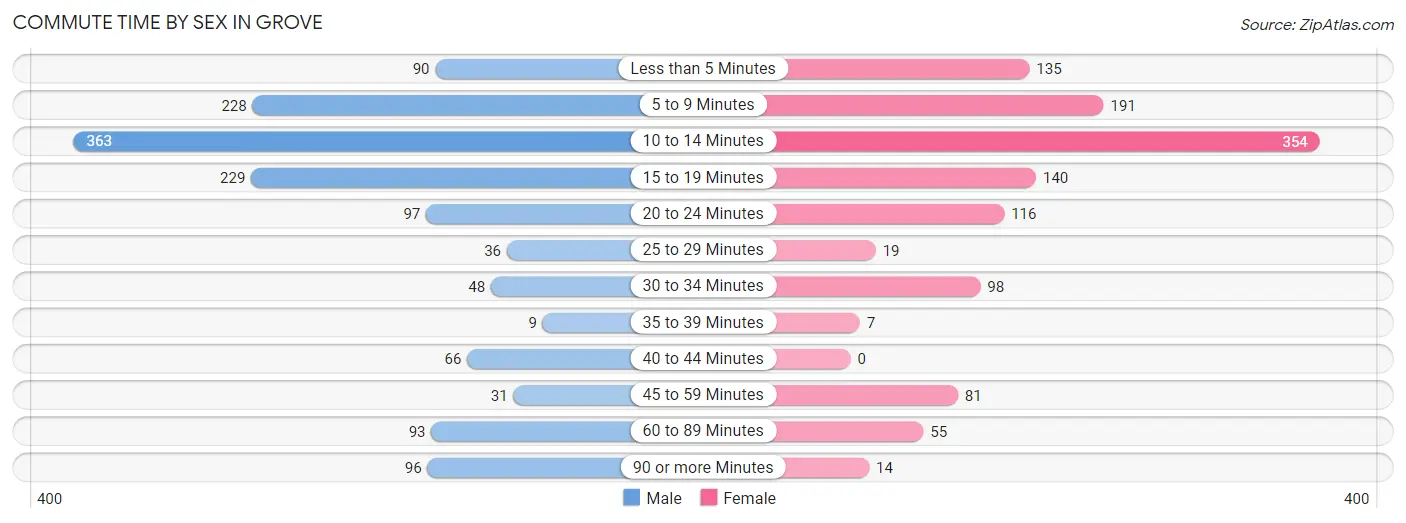
| Commute Time | Male | Female |
| Less than 5 Minutes | 90 (6.5%) | 135 (11.2%) |
| 5 to 9 Minutes | 228 (16.5%) | 191 (15.8%) |
| 10 to 14 Minutes | 363 (26.2%) | 354 (29.3%) |
| 15 to 19 Minutes | 229 (16.5%) | 140 (11.6%) |
| 20 to 24 Minutes | 97 (7.0%) | 116 (9.6%) |
| 25 to 29 Minutes | 36 (2.6%) | 19 (1.6%) |
| 30 to 34 Minutes | 48 (3.5%) | 98 (8.1%) |
| 35 to 39 Minutes | 9 (0.6%) | 7 (0.6%) |
| 40 to 44 Minutes | 66 (4.8%) | 0 (0.0%) |
| 45 to 59 Minutes | 31 (2.2%) | 81 (6.7%) |
| 60 to 89 Minutes | 93 (6.7%) | 55 (4.5%) |
| 90 or more Minutes | 96 (6.9%) | 14 (1.2%) |
Time of Departure to Work by Sex in Grove
The most frequent times of departure to work in Grove are 7:30 AM to 7:59 AM (280, 20.2%) for males and 7:30 AM to 7:59 AM (206, 17.0%) for females.
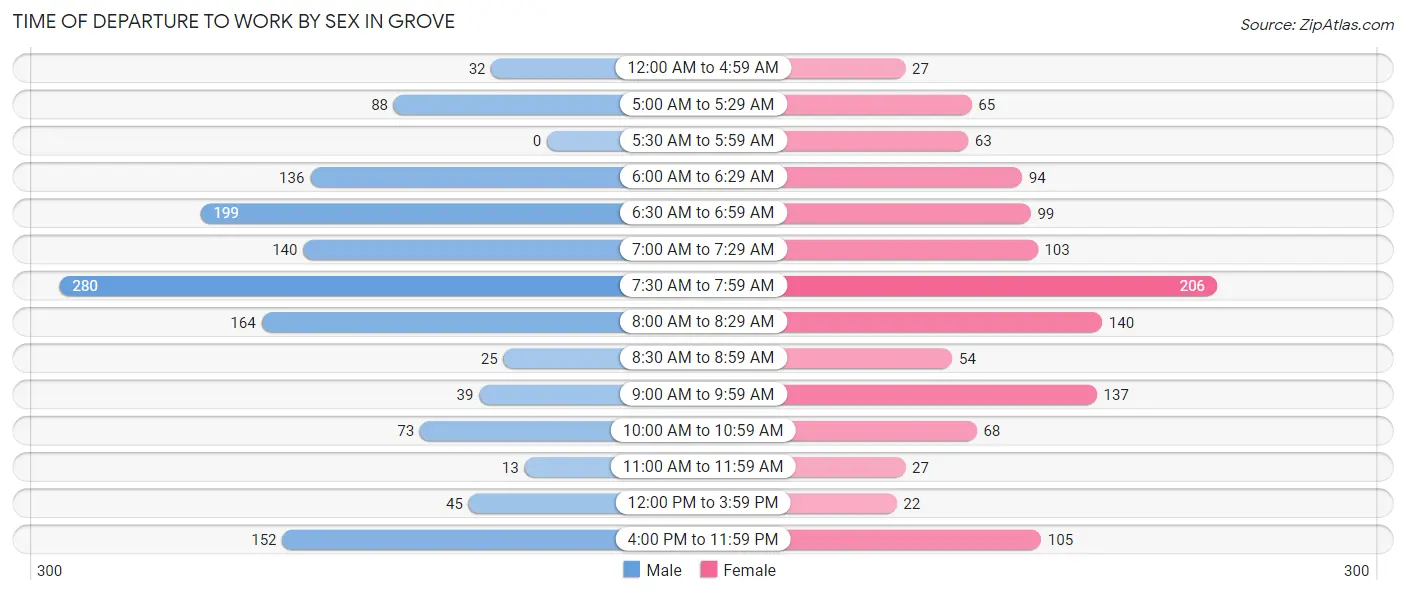
| Time of Departure | Male | Female |
| 12:00 AM to 4:59 AM | 32 (2.3%) | 27 (2.2%) |
| 5:00 AM to 5:29 AM | 88 (6.4%) | 65 (5.4%) |
| 5:30 AM to 5:59 AM | 0 (0.0%) | 63 (5.2%) |
| 6:00 AM to 6:29 AM | 136 (9.8%) | 94 (7.8%) |
| 6:30 AM to 6:59 AM | 199 (14.4%) | 99 (8.2%) |
| 7:00 AM to 7:29 AM | 140 (10.1%) | 103 (8.5%) |
| 7:30 AM to 7:59 AM | 280 (20.2%) | 206 (17.0%) |
| 8:00 AM to 8:29 AM | 164 (11.8%) | 140 (11.6%) |
| 8:30 AM to 8:59 AM | 25 (1.8%) | 54 (4.5%) |
| 9:00 AM to 9:59 AM | 39 (2.8%) | 137 (11.3%) |
| 10:00 AM to 10:59 AM | 73 (5.3%) | 68 (5.6%) |
| 11:00 AM to 11:59 AM | 13 (0.9%) | 27 (2.2%) |
| 12:00 PM to 3:59 PM | 45 (3.3%) | 22 (1.8%) |
| 4:00 PM to 11:59 PM | 152 (11.0%) | 105 (8.7%) |
| Total | 1,386 (100.0%) | 1,210 (100.0%) |
Housing Occupancy in Grove
Occupancy by Ownership in Grove
Of the total 2,921 dwellings in Grove, owner-occupied units account for 1,861 (63.7%), while renter-occupied units make up 1,060 (36.3%).
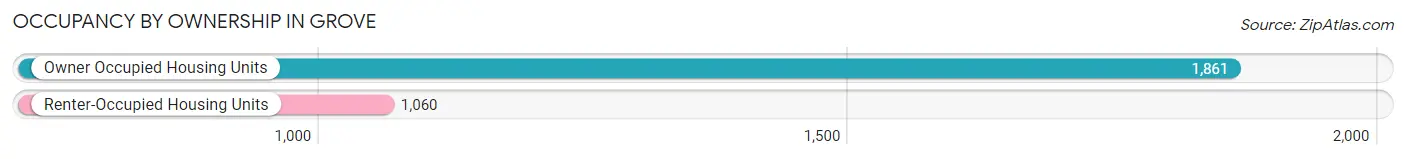
| Occupancy | # Housing Units | % Housing Units |
| Owner Occupied Housing Units | 1,861 | 63.7% |
| Renter-Occupied Housing Units | 1,060 | 36.3% |
| Total Occupied Housing Units | 2,921 | 100.0% |
Occupancy by Household Size in Grove
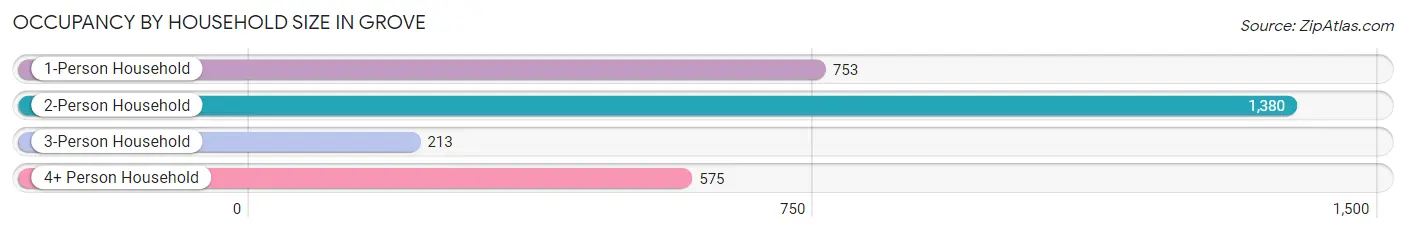
| Household Size | # Housing Units | % Housing Units |
| 1-Person Household | 753 | 25.8% |
| 2-Person Household | 1,380 | 47.2% |
| 3-Person Household | 213 | 7.3% |
| 4+ Person Household | 575 | 19.7% |
| Total Housing Units | 2,921 | 100.0% |
Occupancy by Ownership by Household Size in Grove
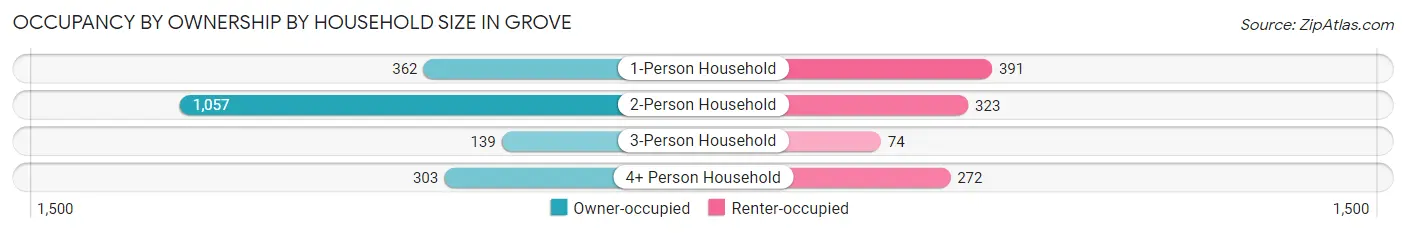
| Household Size | Owner-occupied | Renter-occupied |
| 1-Person Household | 362 (48.1%) | 391 (51.9%) |
| 2-Person Household | 1,057 (76.6%) | 323 (23.4%) |
| 3-Person Household | 139 (65.3%) | 74 (34.7%) |
| 4+ Person Household | 303 (52.7%) | 272 (47.3%) |
| Total Housing Units | 1,861 (63.7%) | 1,060 (36.3%) |
Occupancy by Educational Attainment in Grove
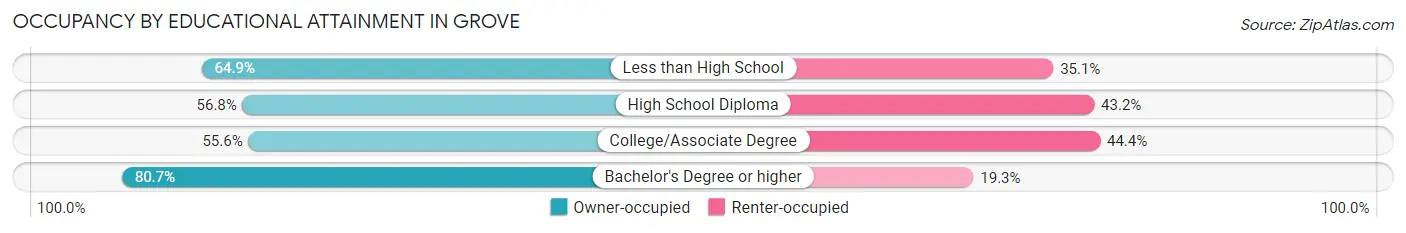
| Household Size | Owner-occupied | Renter-occupied |
| Less than High School | 98 (64.9%) | 53 (35.1%) |
| High School Diploma | 427 (56.8%) | 325 (43.2%) |
| College/Associate Degree | 649 (55.6%) | 518 (44.4%) |
| Bachelor's Degree or higher | 687 (80.7%) | 164 (19.3%) |
Occupancy by Age of Householder in Grove
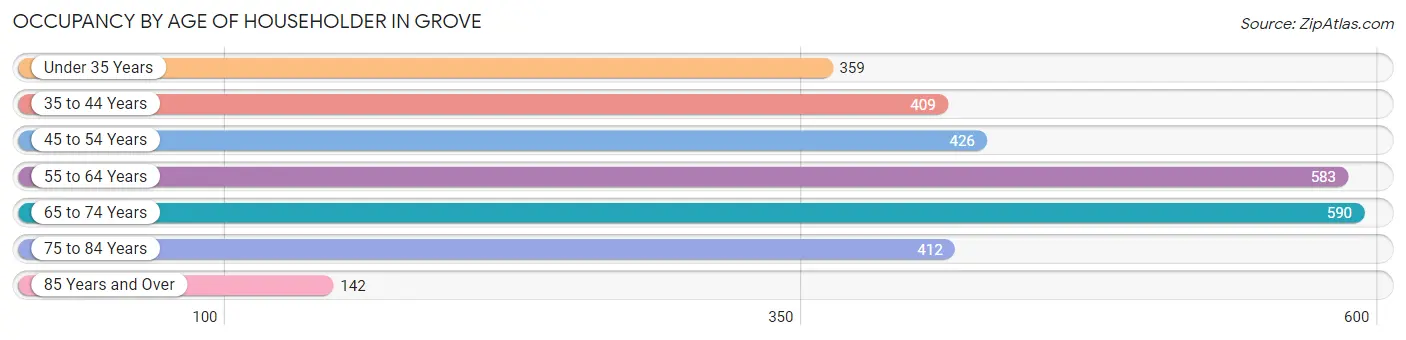
| Age Bracket | # Households | % Households |
| Under 35 Years | 359 | 12.3% |
| 35 to 44 Years | 409 | 14.0% |
| 45 to 54 Years | 426 | 14.6% |
| 55 to 64 Years | 583 | 20.0% |
| 65 to 74 Years | 590 | 20.2% |
| 75 to 84 Years | 412 | 14.1% |
| 85 Years and Over | 142 | 4.9% |
| Total | 2,921 | 100.0% |
Housing Finances in Grove
Median Income by Occupancy in Grove
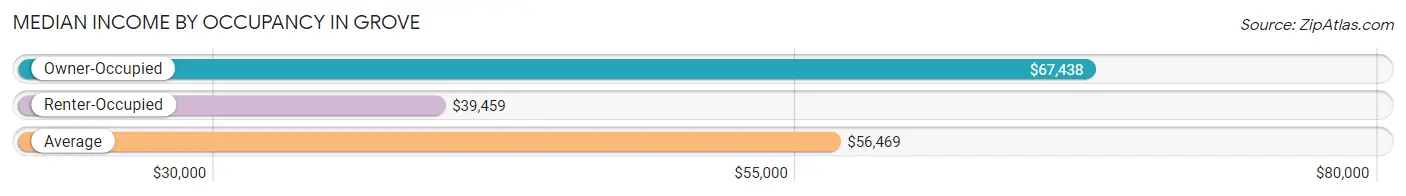
| Occupancy Type | # Households | Median Income |
| Owner-Occupied | 1,861 (63.7%) | $67,438 |
| Renter-Occupied | 1,060 (36.3%) | $39,459 |
| Average | 2,921 (100.0%) | $56,469 |
Occupancy by Householder Income Bracket in Grove
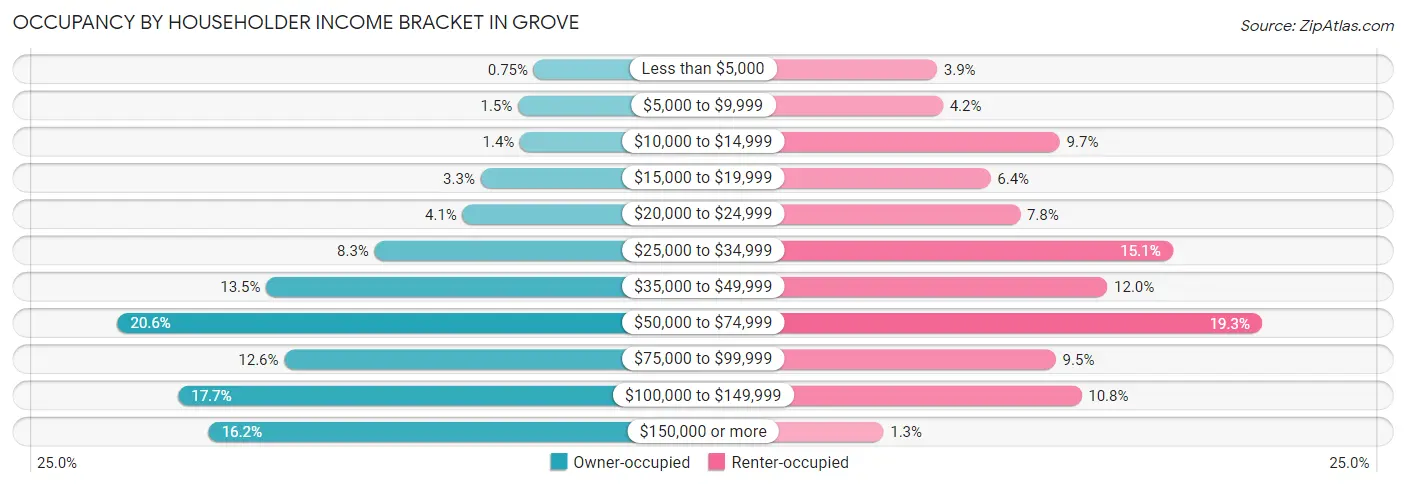
| Income Bracket | Owner-occupied | Renter-occupied |
| Less than $5,000 | 14 (0.7%) | 41 (3.9%) |
| $5,000 to $9,999 | 28 (1.5%) | 44 (4.2%) |
| $10,000 to $14,999 | 26 (1.4%) | 103 (9.7%) |
| $15,000 to $19,999 | 61 (3.3%) | 68 (6.4%) |
| $20,000 to $24,999 | 77 (4.1%) | 83 (7.8%) |
| $25,000 to $34,999 | 155 (8.3%) | 160 (15.1%) |
| $35,000 to $49,999 | 251 (13.5%) | 127 (12.0%) |
| $50,000 to $74,999 | 383 (20.6%) | 205 (19.3%) |
| $75,000 to $99,999 | 235 (12.6%) | 101 (9.5%) |
| $100,000 to $149,999 | 329 (17.7%) | 114 (10.7%) |
| $150,000 or more | 302 (16.2%) | 14 (1.3%) |
| Total | 1,861 (100.0%) | 1,060 (100.0%) |
Monthly Housing Cost Tiers in Grove
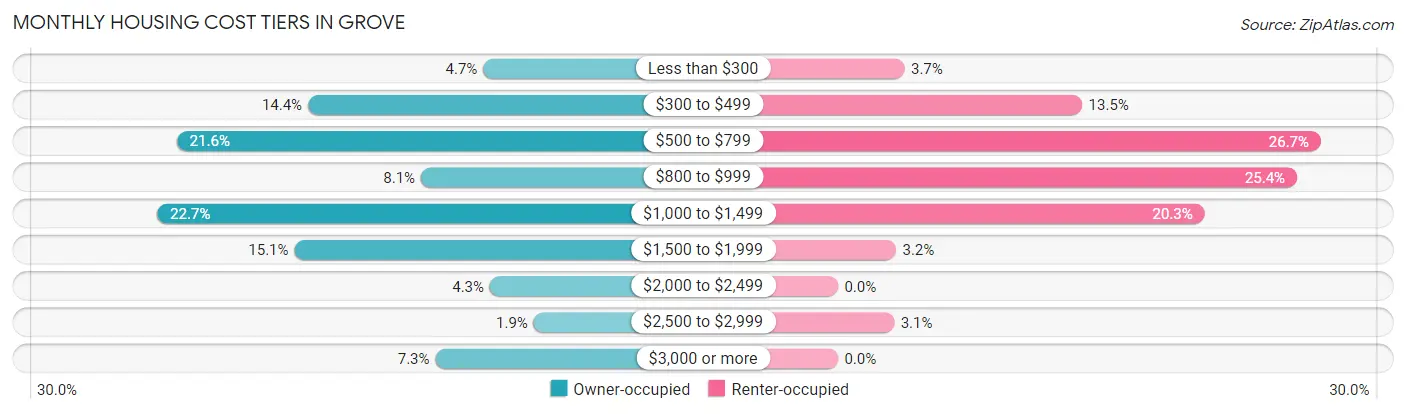
| Monthly Cost | Owner-occupied | Renter-occupied |
| Less than $300 | 87 (4.7%) | 39 (3.7%) |
| $300 to $499 | 267 (14.3%) | 143 (13.5%) |
| $500 to $799 | 402 (21.6%) | 283 (26.7%) |
| $800 to $999 | 151 (8.1%) | 269 (25.4%) |
| $1,000 to $1,499 | 422 (22.7%) | 215 (20.3%) |
| $1,500 to $1,999 | 281 (15.1%) | 34 (3.2%) |
| $2,000 to $2,499 | 80 (4.3%) | 0 (0.0%) |
| $2,500 to $2,999 | 35 (1.9%) | 33 (3.1%) |
| $3,000 or more | 136 (7.3%) | 0 (0.0%) |
| Total | 1,861 (100.0%) | 1,060 (100.0%) |
Physical Housing Characteristics in Grove
Housing Structures in Grove
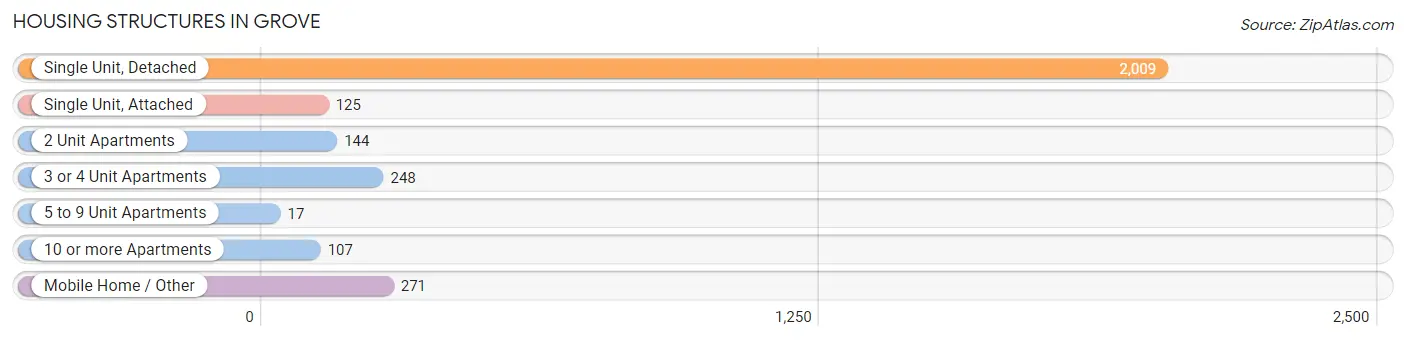
| Structure Type | # Housing Units | % Housing Units |
| Single Unit, Detached | 2,009 | 68.8% |
| Single Unit, Attached | 125 | 4.3% |
| 2 Unit Apartments | 144 | 4.9% |
| 3 or 4 Unit Apartments | 248 | 8.5% |
| 5 to 9 Unit Apartments | 17 | 0.6% |
| 10 or more Apartments | 107 | 3.7% |
| Mobile Home / Other | 271 | 9.3% |
| Total | 2,921 | 100.0% |
Housing Structures by Occupancy in Grove
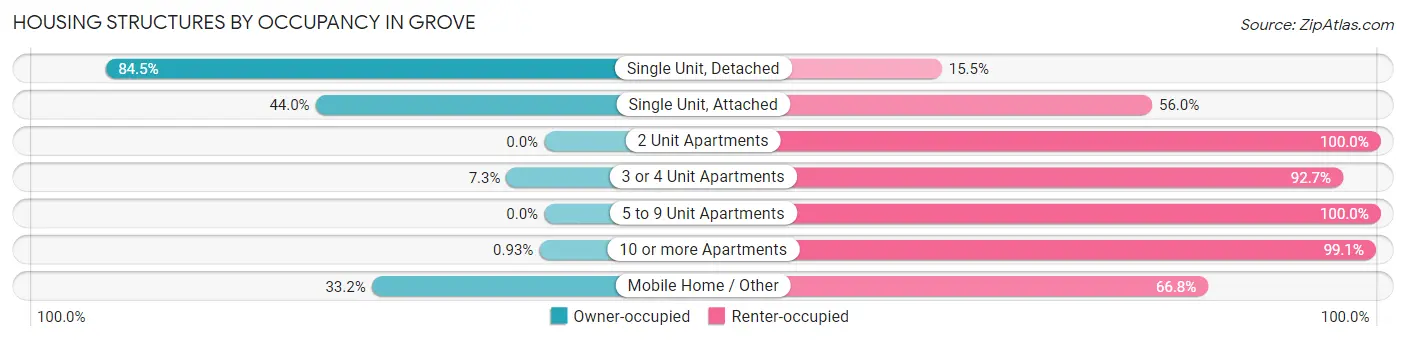
| Structure Type | Owner-occupied | Renter-occupied |
| Single Unit, Detached | 1,697 (84.5%) | 312 (15.5%) |
| Single Unit, Attached | 55 (44.0%) | 70 (56.0%) |
| 2 Unit Apartments | 0 (0.0%) | 144 (100.0%) |
| 3 or 4 Unit Apartments | 18 (7.3%) | 230 (92.7%) |
| 5 to 9 Unit Apartments | 0 (0.0%) | 17 (100.0%) |
| 10 or more Apartments | 1 (0.9%) | 106 (99.1%) |
| Mobile Home / Other | 90 (33.2%) | 181 (66.8%) |
| Total | 1,861 (63.7%) | 1,060 (36.3%) |
Housing Structures by Number of Rooms in Grove
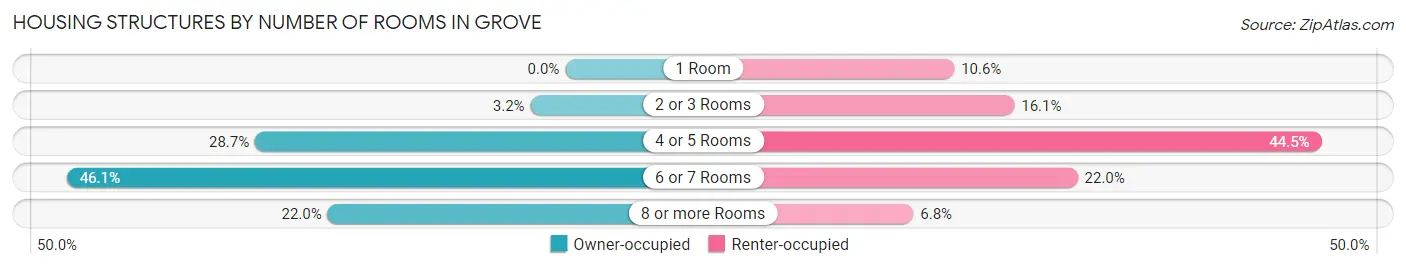
| Number of Rooms | Owner-occupied | Renter-occupied |
| 1 Room | 0 (0.0%) | 112 (10.6%) |
| 2 or 3 Rooms | 60 (3.2%) | 171 (16.1%) |
| 4 or 5 Rooms | 534 (28.7%) | 472 (44.5%) |
| 6 or 7 Rooms | 858 (46.1%) | 233 (22.0%) |
| 8 or more Rooms | 409 (22.0%) | 72 (6.8%) |
| Total | 1,861 (100.0%) | 1,060 (100.0%) |
Housing Structure by Heating Type in Grove
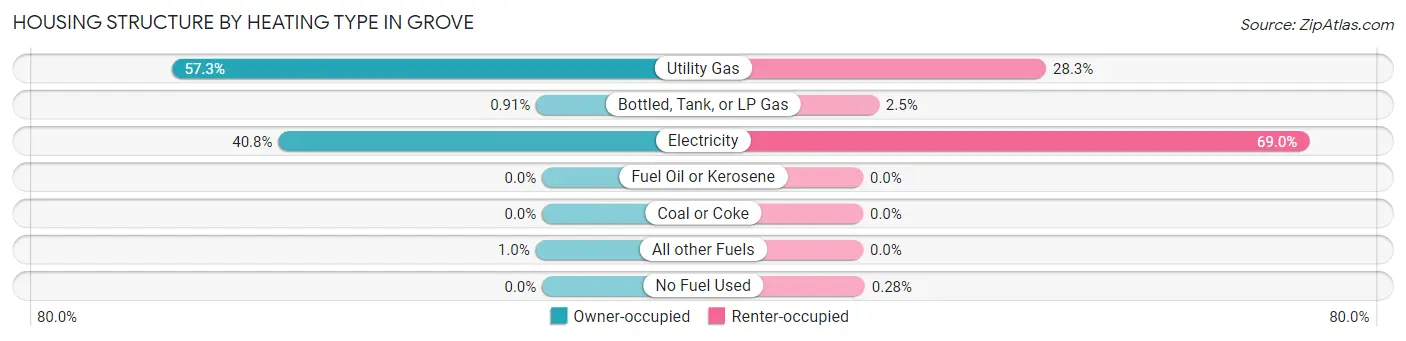
| Heating Type | Owner-occupied | Renter-occupied |
| Utility Gas | 1,066 (57.3%) | 300 (28.3%) |
| Bottled, Tank, or LP Gas | 17 (0.9%) | 26 (2.5%) |
| Electricity | 759 (40.8%) | 731 (69.0%) |
| Fuel Oil or Kerosene | 0 (0.0%) | 0 (0.0%) |
| Coal or Coke | 0 (0.0%) | 0 (0.0%) |
| All other Fuels | 19 (1.0%) | 0 (0.0%) |
| No Fuel Used | 0 (0.0%) | 3 (0.3%) |
| Total | 1,861 (100.0%) | 1,060 (100.0%) |
Household Vehicle Usage in Grove
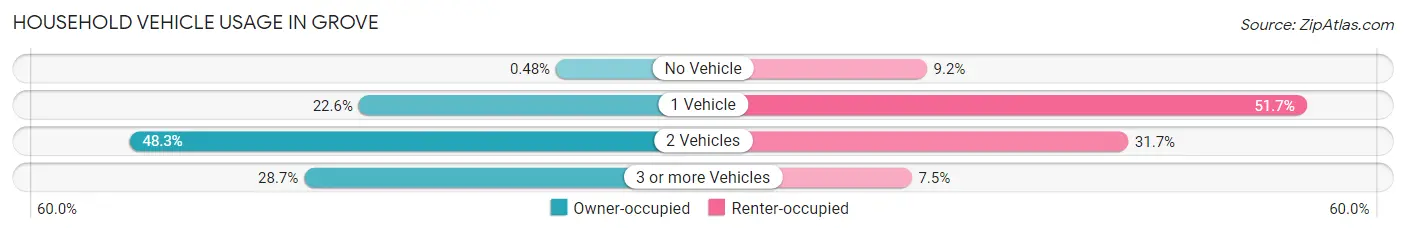
| Vehicles per Household | Owner-occupied | Renter-occupied |
| No Vehicle | 9 (0.5%) | 97 (9.1%) |
| 1 Vehicle | 420 (22.6%) | 548 (51.7%) |
| 2 Vehicles | 898 (48.2%) | 336 (31.7%) |
| 3 or more Vehicles | 534 (28.7%) | 79 (7.4%) |
| Total | 1,861 (100.0%) | 1,060 (100.0%) |
Real Estate & Mortgages in Grove
Real Estate and Mortgage Overview in Grove
| Characteristic | Without Mortgage | With Mortgage |
| Housing Units | 848 | 1,013 |
| Median Property Value | $218,400 | $216,700 |
| Median Household Income | $63,269 | $198 |
| Monthly Housing Costs | $542 | $136 |
| Real Estate Taxes | $1,782 | $37 |
Property Value by Mortgage Status in Grove
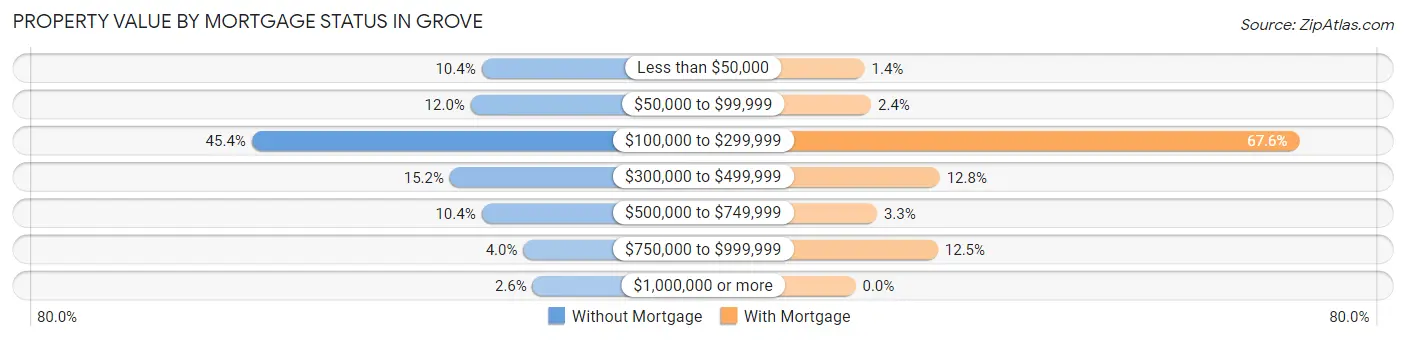
| Property Value | Without Mortgage | With Mortgage |
| Less than $50,000 | 88 (10.4%) | 14 (1.4%) |
| $50,000 to $99,999 | 102 (12.0%) | 24 (2.4%) |
| $100,000 to $299,999 | 385 (45.4%) | 685 (67.6%) |
| $300,000 to $499,999 | 129 (15.2%) | 130 (12.8%) |
| $500,000 to $749,999 | 88 (10.4%) | 33 (3.3%) |
| $750,000 to $999,999 | 34 (4.0%) | 127 (12.5%) |
| $1,000,000 or more | 22 (2.6%) | 0 (0.0%) |
| Total | 848 (100.0%) | 1,013 (100.0%) |
Household Income by Mortgage Status in Grove
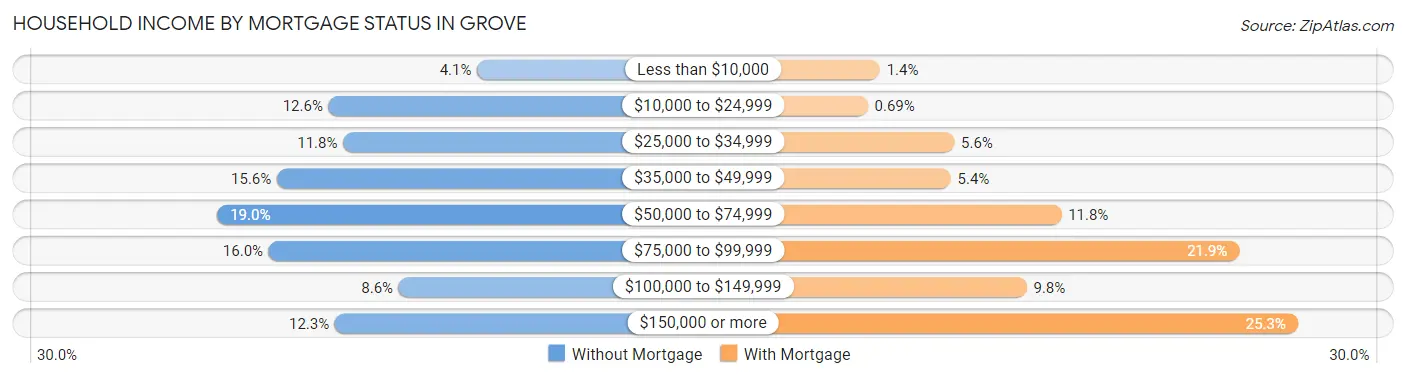
| Household Income | Without Mortgage | With Mortgage |
| Less than $10,000 | 35 (4.1%) | 14 (1.4%) |
| $10,000 to $24,999 | 107 (12.6%) | 7 (0.7%) |
| $25,000 to $34,999 | 100 (11.8%) | 57 (5.6%) |
| $35,000 to $49,999 | 132 (15.6%) | 55 (5.4%) |
| $50,000 to $74,999 | 161 (19.0%) | 119 (11.7%) |
| $75,000 to $99,999 | 136 (16.0%) | 222 (21.9%) |
| $100,000 to $149,999 | 73 (8.6%) | 99 (9.8%) |
| $150,000 or more | 104 (12.3%) | 256 (25.3%) |
| Total | 848 (100.0%) | 1,013 (100.0%) |
Property Value to Household Income Ratio in Grove
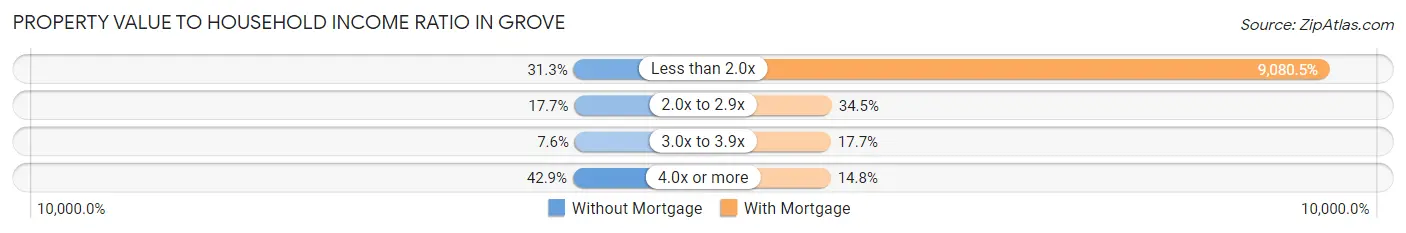
| Value-to-Income Ratio | Without Mortgage | With Mortgage |
| Less than 2.0x | 265 (31.2%) | 91,985 (9,080.5%) |
| 2.0x to 2.9x | 150 (17.7%) | 349 (34.4%) |
| 3.0x to 3.9x | 64 (7.5%) | 179 (17.7%) |
| 4.0x or more | 364 (42.9%) | 150 (14.8%) |
| Total | 848 (100.0%) | 1,013 (100.0%) |
Real Estate Taxes by Mortgage Status in Grove
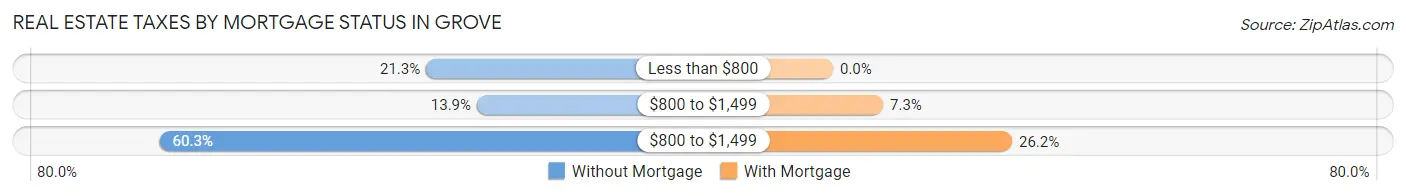
| Property Taxes | Without Mortgage | With Mortgage |
| Less than $800 | 181 (21.3%) | 0 (0.0%) |
| $800 to $1,499 | 118 (13.9%) | 74 (7.3%) |
| $800 to $1,499 | 511 (60.3%) | 265 (26.2%) |
| Total | 848 (100.0%) | 1,013 (100.0%) |
Health & Disability in Grove
Health Insurance Coverage by Age in Grove
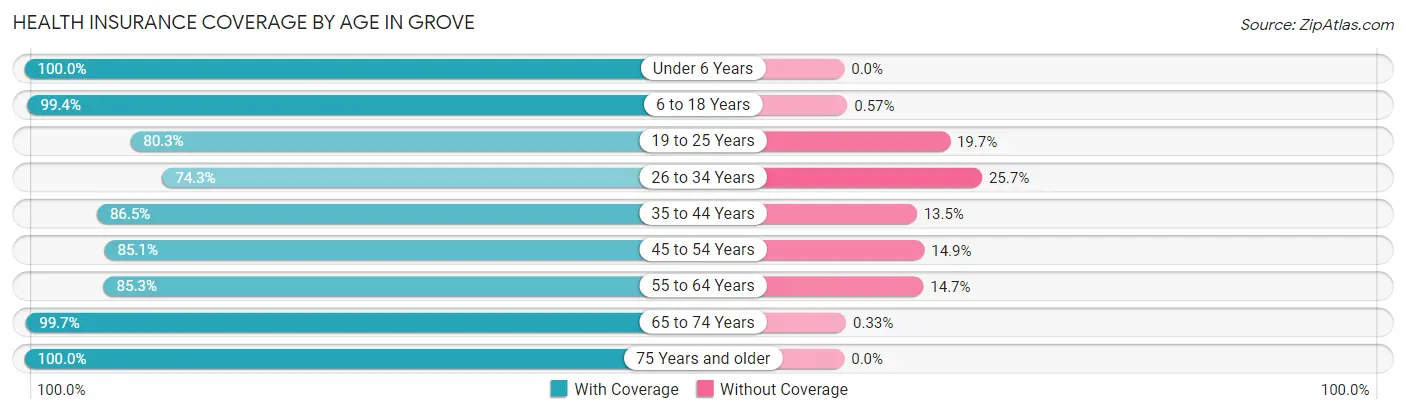
| Age Bracket | With Coverage | Without Coverage |
| Under 6 Years | 301 (100.0%) | 0 (0.0%) |
| 6 to 18 Years | 1,223 (99.4%) | 7 (0.6%) |
| 19 to 25 Years | 383 (80.3%) | 94 (19.7%) |
| 26 to 34 Years | 411 (74.3%) | 142 (25.7%) |
| 35 to 44 Years | 673 (86.5%) | 105 (13.5%) |
| 45 to 54 Years | 616 (85.1%) | 108 (14.9%) |
| 55 to 64 Years | 1,001 (85.3%) | 173 (14.7%) |
| 65 to 74 Years | 904 (99.7%) | 3 (0.3%) |
| 75 Years and older | 719 (100.0%) | 0 (0.0%) |
| Total | 6,231 (90.8%) | 632 (9.2%) |
Health Insurance Coverage by Citizenship Status in Grove
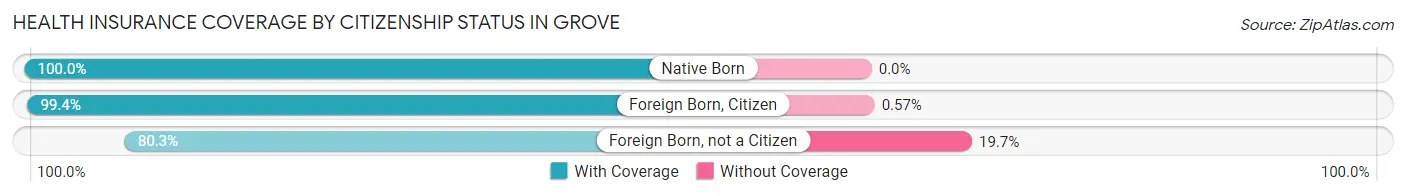
| Citizenship Status | With Coverage | Without Coverage |
| Native Born | 301 (100.0%) | 0 (0.0%) |
| Foreign Born, Citizen | 1,223 (99.4%) | 7 (0.6%) |
| Foreign Born, not a Citizen | 383 (80.3%) | 94 (19.7%) |
Health Insurance Coverage by Household Income in Grove
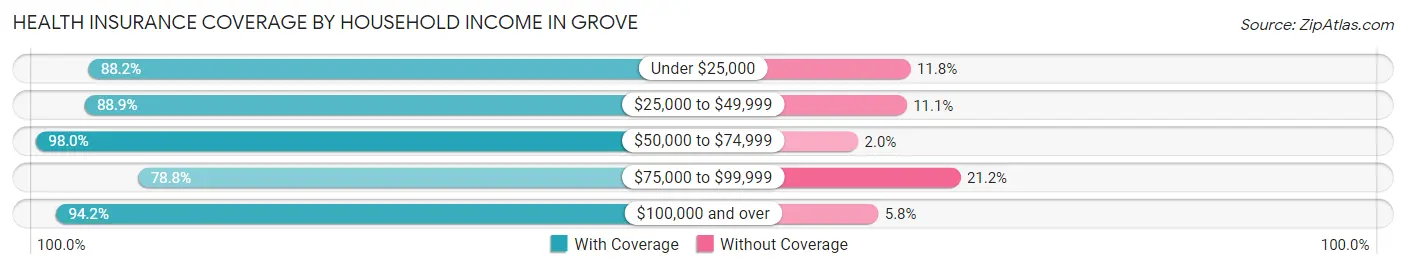
| Household Income | With Coverage | Without Coverage |
| Under $25,000 | 968 (88.2%) | 130 (11.8%) |
| $25,000 to $49,999 | 1,269 (88.9%) | 159 (11.1%) |
| $50,000 to $74,999 | 1,066 (98.0%) | 22 (2.0%) |
| $75,000 to $99,999 | 684 (78.8%) | 184 (21.2%) |
| $100,000 and over | 2,224 (94.2%) | 137 (5.8%) |
Public vs Private Health Insurance Coverage by Age in Grove
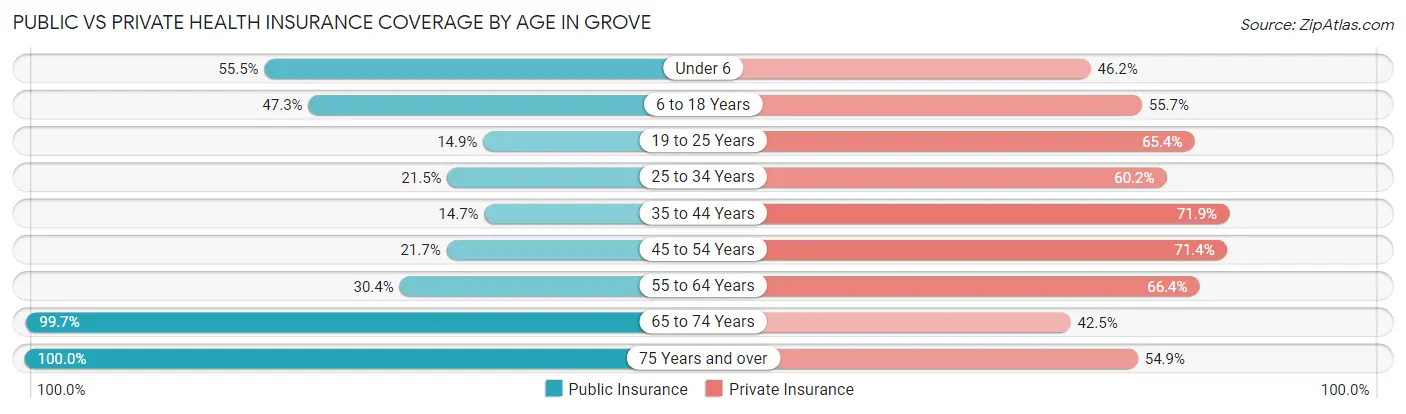
| Age Bracket | Public Insurance | Private Insurance |
| Under 6 | 167 (55.5%) | 139 (46.2%) |
| 6 to 18 Years | 582 (47.3%) | 685 (55.7%) |
| 19 to 25 Years | 71 (14.9%) | 312 (65.4%) |
| 25 to 34 Years | 119 (21.5%) | 333 (60.2%) |
| 35 to 44 Years | 114 (14.6%) | 559 (71.9%) |
| 45 to 54 Years | 157 (21.7%) | 517 (71.4%) |
| 55 to 64 Years | 357 (30.4%) | 779 (66.3%) |
| 65 to 74 Years | 904 (99.7%) | 385 (42.4%) |
| 75 Years and over | 719 (100.0%) | 395 (54.9%) |
| Total | 3,190 (46.5%) | 4,104 (59.8%) |
Disability Status by Sex by Age in Grove
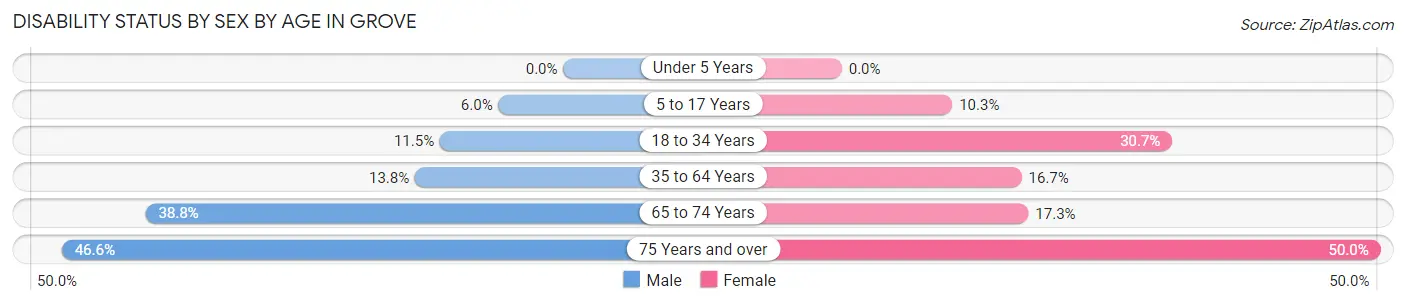
| Age Bracket | Male | Female |
| Under 5 Years | 0 (0.0%) | 0 (0.0%) |
| 5 to 17 Years | 40 (6.0%) | 53 (10.2%) |
| 18 to 34 Years | 60 (11.5%) | 180 (30.7%) |
| 35 to 64 Years | 167 (13.8%) | 244 (16.7%) |
| 65 to 74 Years | 204 (38.8%) | 66 (17.3%) |
| 75 Years and over | 155 (46.6%) | 193 (50.0%) |
Disability Class by Sex by Age in Grove
Disability Class: Hearing Difficulty
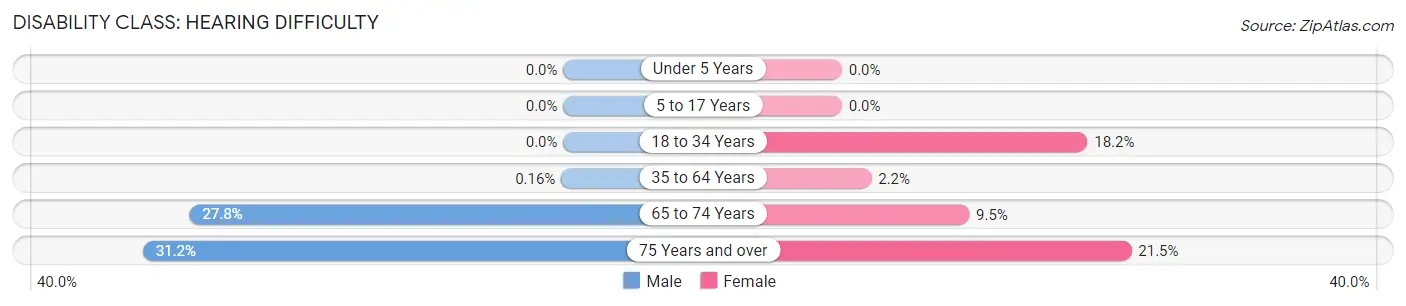
| Age Bracket | Male | Female |
| Under 5 Years | 0 (0.0%) | 0 (0.0%) |
| 5 to 17 Years | 0 (0.0%) | 0 (0.0%) |
| 18 to 34 Years | 0 (0.0%) | 107 (18.2%) |
| 35 to 64 Years | 2 (0.2%) | 32 (2.2%) |
| 65 to 74 Years | 146 (27.8%) | 36 (9.5%) |
| 75 Years and over | 104 (31.2%) | 83 (21.5%) |
Disability Class: Vision Difficulty
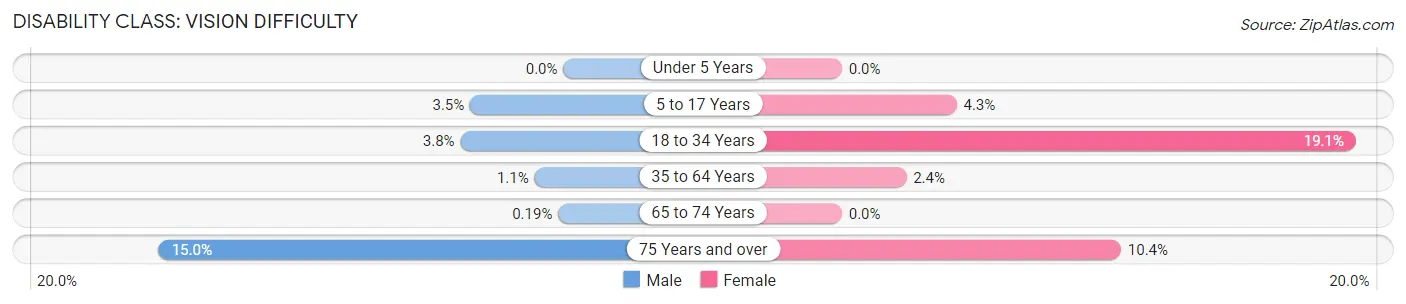
| Age Bracket | Male | Female |
| Under 5 Years | 0 (0.0%) | 0 (0.0%) |
| 5 to 17 Years | 23 (3.5%) | 22 (4.3%) |
| 18 to 34 Years | 20 (3.8%) | 112 (19.1%) |
| 35 to 64 Years | 13 (1.1%) | 35 (2.4%) |
| 65 to 74 Years | 1 (0.2%) | 0 (0.0%) |
| 75 Years and over | 50 (15.0%) | 40 (10.4%) |
Disability Class: Cognitive Difficulty
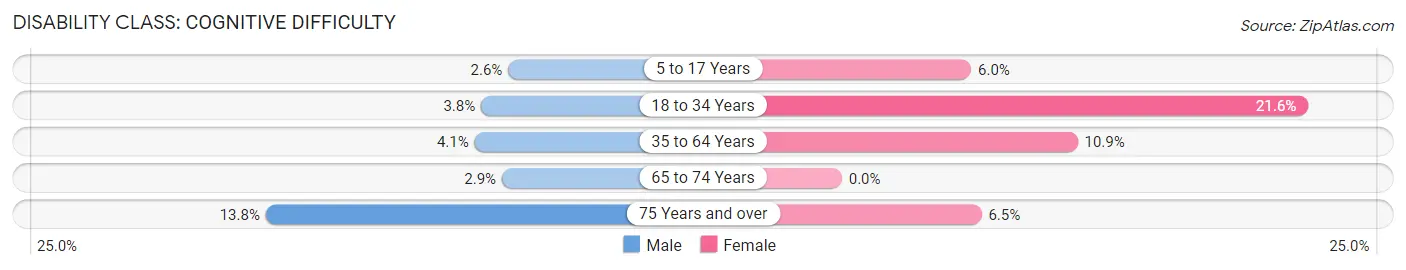
| Age Bracket | Male | Female |
| 5 to 17 Years | 17 (2.6%) | 31 (6.0%) |
| 18 to 34 Years | 20 (3.8%) | 127 (21.6%) |
| 35 to 64 Years | 50 (4.1%) | 160 (10.9%) |
| 65 to 74 Years | 15 (2.9%) | 0 (0.0%) |
| 75 Years and over | 46 (13.8%) | 25 (6.5%) |
Disability Class: Ambulatory Difficulty
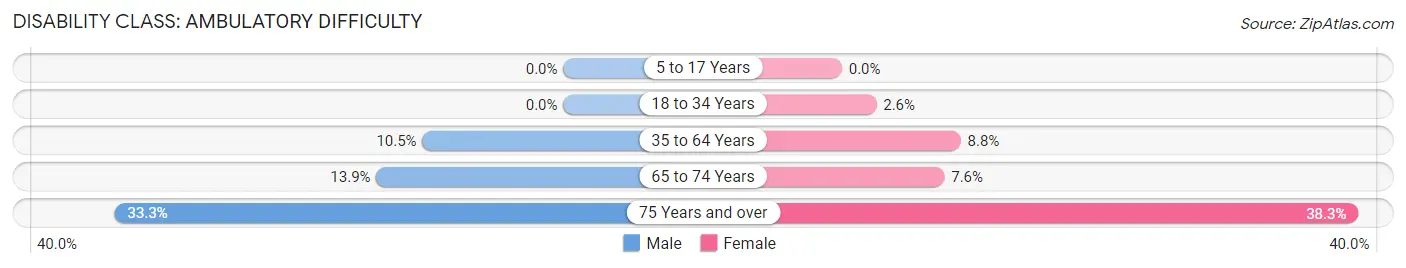
| Age Bracket | Male | Female |
| 5 to 17 Years | 0 (0.0%) | 0 (0.0%) |
| 18 to 34 Years | 0 (0.0%) | 15 (2.6%) |
| 35 to 64 Years | 127 (10.5%) | 129 (8.8%) |
| 65 to 74 Years | 73 (13.9%) | 29 (7.6%) |
| 75 Years and over | 111 (33.3%) | 148 (38.3%) |
Disability Class: Self-Care Difficulty
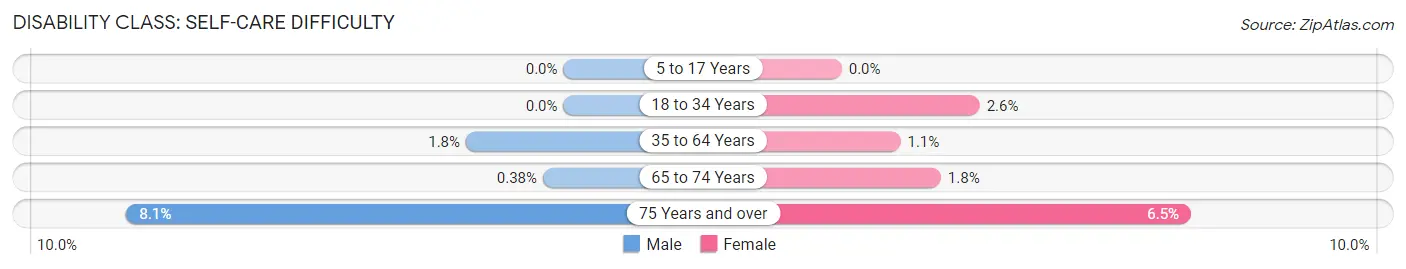
| Age Bracket | Male | Female |
| 5 to 17 Years | 0 (0.0%) | 0 (0.0%) |
| 18 to 34 Years | 0 (0.0%) | 15 (2.6%) |
| 35 to 64 Years | 22 (1.8%) | 16 (1.1%) |
| 65 to 74 Years | 2 (0.4%) | 7 (1.8%) |
| 75 Years and over | 27 (8.1%) | 25 (6.5%) |
Technology Access in Grove
Computing Device Access in Grove
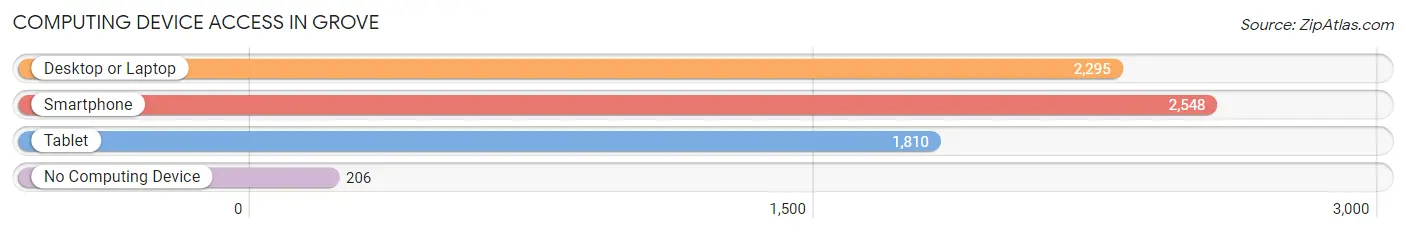
| Device Type | # Households | % Households |
| Desktop or Laptop | 2,295 | 78.6% |
| Smartphone | 2,548 | 87.2% |
| Tablet | 1,810 | 62.0% |
| No Computing Device | 206 | 7.0% |
| Total | 2,921 | 100.0% |
Internet Access in Grove
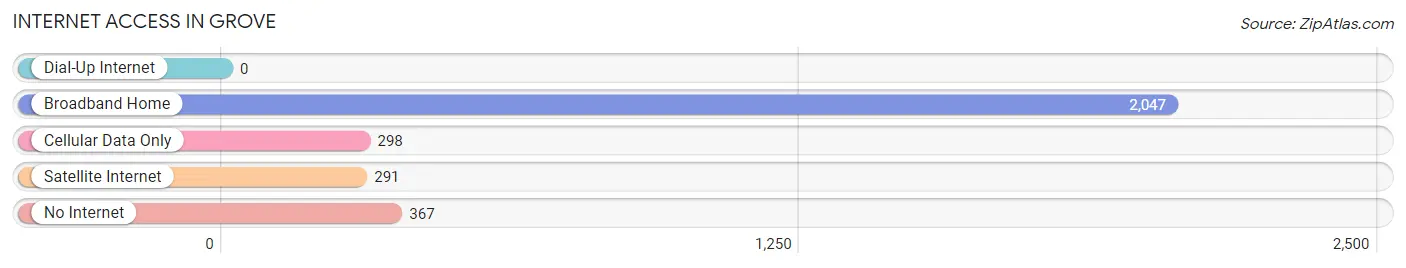
| Internet Type | # Households | % Households |
| Dial-Up Internet | 0 | 0.0% |
| Broadband Home | 2,047 | 70.1% |
| Cellular Data Only | 298 | 10.2% |
| Satellite Internet | 291 | 10.0% |
| No Internet | 367 | 12.6% |
| Total | 2,921 | 100.0% |
Grove Summary
Grove, Oklahoma is a city located in Delaware County, Oklahoma. It is situated on the shores of Grand Lake O’ the Cherokees, a large reservoir created by the damming of the Grand River. The city is located in the foothills of the Ozark Mountains and is part of the Green Country region of Oklahoma. As of the 2010 census, the population of Grove was 6,623.
History
The area that is now Grove was originally inhabited by the Osage Nation. The first white settlers arrived in the area in the late 1800s, and the town was officially founded in 1894. The town was named after a grove of trees that were located near the original settlement.
In the early 1900s, the town began to grow as a result of the oil boom in the area. The discovery of oil in nearby Bartlesville, Oklahoma, led to an influx of people and businesses to the area. The town was incorporated in 1906 and the population grew to over 1,000 by 1910.
In the 1920s, the town began to develop as a resort destination due to its proximity to Grand Lake O’ the Cherokees. The lake was created in 1940 when the Grand River was dammed, and the town quickly became a popular destination for fishing, boating, and other recreational activities.
In the 1950s, the town began to experience a period of growth and development. The population increased to over 3,000 by 1960, and the town was officially designated as a city in 1965.
Geography
Grove is located in the foothills of the Ozark Mountains in northeastern Oklahoma. The city is situated on the shores of Grand Lake O’ the Cherokees, a large reservoir created by the damming of the Grand River. The city is located approximately 40 miles northeast of Tulsa and 80 miles southwest of Joplin, Missouri.
The city has a total area of 8.3 square miles, of which 7.9 square miles is land and 0.4 square miles is water. The city is located in the humid subtropical climate zone, with hot, humid summers and mild winters.
Economy
The economy of Grove is largely based on tourism and recreation. The city is a popular destination for fishing, boating, and other recreational activities due to its proximity to Grand Lake O’ the Cherokees. The city also has a number of businesses that cater to tourists, including restaurants, hotels, and retail stores.
The city is also home to a number of manufacturing and industrial businesses, including a paper mill, a plastics plant, and a metal fabrication plant. The city is also home to a number of healthcare facilities, including a hospital and several medical clinics.
Demographics
As of the 2010 census, the population of Grove was 6,623. The racial makeup of the city was 87.3% White, 5.2% African American, 0.7% Native American, 0.7% Asian, 0.1% Pacific Islander, and 4.9% from other races. Hispanic or Latino of any race were 5.7% of the population.
The median household income in the city was $37,917, and the median family income was $45,938. The per capita income in the city was $20,945. About 11.3% of the population was below the poverty line.
Conclusion
Grove, Oklahoma is a city located in Delaware County, Oklahoma. It is situated on the shores of Grand Lake O’ the Cherokees, a large reservoir created by the damming of the Grand River. The city is located in the foothills of the Ozark Mountains and is part of the Green Country region of Oklahoma. The economy of Grove is largely based on tourism and recreation, and the city is also home to a number of manufacturing and industrial businesses. As of the 2010 census, the population of Grove was 6,623.
Common Questions
What is Per Capita Income in Grove?
Per Capita income in Grove is $38,198.
What is the Median Family Income in Grove?
Median Family Income in Grove is $66,386.
What is the Median Household income in Grove?
Median Household Income in Grove is $56,469.
What is Income or Wage Gap in Grove?
Income or Wage Gap in Grove is 46.1%.
Women in Grove earn 53.9 cents for every dollar earned by a man.
What is Inequality or Gini Index in Grove?
Inequality or Gini Index in Grove is 0.49.
What is the Total Population of Grove?
Total Population of Grove is 7,012.
What is the Total Male Population of Grove?
Total Male Population of Grove is 3,451.
What is the Total Female Population of Grove?
Total Female Population of Grove is 3,561.
What is the Ratio of Males per 100 Females in Grove?
There are 96.91 Males per 100 Females in Grove.
What is the Ratio of Females per 100 Males in Grove?
There are 103.19 Females per 100 Males in Grove.
What is the Median Population Age in Grove?
Median Population Age in Grove is 46.9 Years.
What is the Average Family Size in Grove
Average Family Size in Grove is 2.8 People.
What is the Average Household Size in Grove
Average Household Size in Grove is 2.3 People.
How Large is the Labor Force in Grove?
There are 2,937 People in the Labor Forcein in Grove.
What is the Percentage of People in the Labor Force in Grove?
51.8% of People are in the Labor Force in Grove.
What is the Unemployment Rate in Grove?
Unemployment Rate in Grove is 1.4%.