Ardmore, OK Map & Demographics
Ardmore Map
Ardmore Overview
$28,997
PER CAPITA INCOME
$66,752
AVG FAMILY INCOME
$49,408
AVG HOUSEHOLD INCOME
33.3%
WAGE / INCOME GAP [ % ]
66.7¢/ $1
WAGE / INCOME GAP [ $ ]
$10,894
FAMILY INCOME DEFICIT
0.47
INEQUALITY / GINI INDEX
24,784
TOTAL POPULATION
11,950
MALE POPULATION
12,834
FEMALE POPULATION
93.11
MALES / 100 FEMALES
107.40
FEMALES / 100 MALES
37.3
MEDIAN AGE
3.2
AVG FAMILY SIZE
2.5
AVG HOUSEHOLD SIZE
11,404
LABOR FORCE [ PEOPLE ]
59.6%
PERCENT IN LABOR FORCE
5.2%
UNEMPLOYMENT RATE
Ardmore Zip Codes
Ardmore Area Codes
Income in Ardmore
Income Overview in Ardmore
Per Capita Income in Ardmore is $28,997, while median incomes of families and households are $66,752 and $49,408 respectively.
| Characteristic | Number | Measure |
| Per Capita Income | 24,784 | $28,997 |
| Median Family Income | 5,777 | $66,752 |
| Mean Family Income | 5,777 | $87,057 |
| Median Household Income | 9,722 | $49,408 |
| Mean Household Income | 9,722 | $71,080 |
| Income Deficit | 5,777 | $10,894 |
| Wage / Income Gap (%) | 24,784 | 33.25% |
| Wage / Income Gap ($) | 24,784 | 66.75¢ per $1 |
| Gini / Inequality Index | 24,784 | 0.47 |
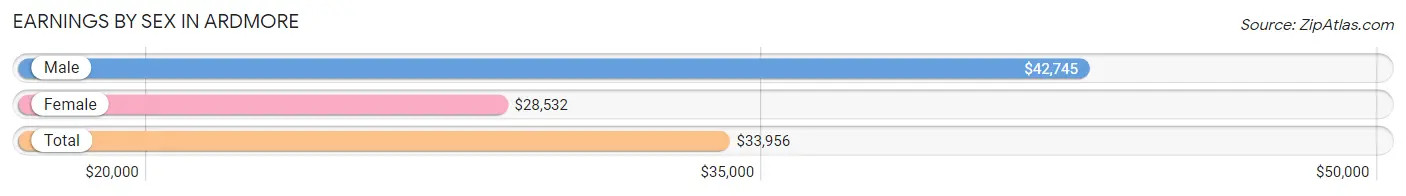
Earnings by Sex in Ardmore
Average Earnings in Ardmore are $33,956, $42,745 for men and $28,532 for women, a difference of 33.3%.
| Sex | Number | Average Earnings |
| Male | 6,250 (52.9%) | $42,745 |
| Female | 5,565 (47.1%) | $28,532 |
| Total | 11,815 (100.0%) | $33,956 |
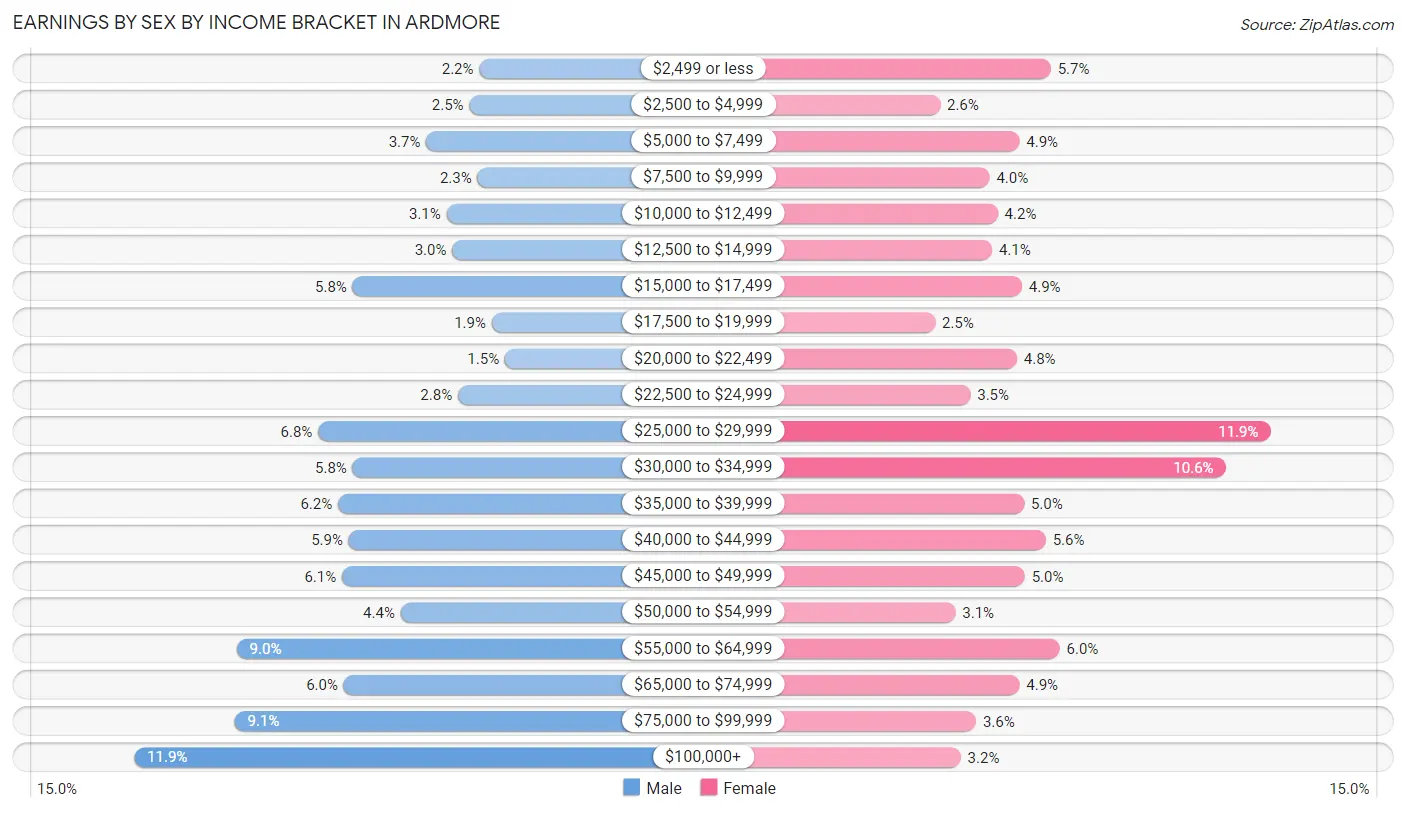
Earnings by Sex by Income Bracket in Ardmore
The most common earnings brackets in Ardmore are $100,000+ for men (745 | 11.9%) and $25,000 to $29,999 for women (662 | 11.9%).
| Income | Male | Female |
| $2,499 or less | 139 (2.2%) | 319 (5.7%) |
| $2,500 to $4,999 | 156 (2.5%) | 146 (2.6%) |
| $5,000 to $7,499 | 232 (3.7%) | 270 (4.9%) |
| $7,500 to $9,999 | 142 (2.3%) | 223 (4.0%) |
| $10,000 to $12,499 | 196 (3.1%) | 236 (4.2%) |
| $12,500 to $14,999 | 186 (3.0%) | 227 (4.1%) |
| $15,000 to $17,499 | 361 (5.8%) | 274 (4.9%) |
| $17,500 to $19,999 | 117 (1.9%) | 138 (2.5%) |
| $20,000 to $22,499 | 94 (1.5%) | 266 (4.8%) |
| $22,500 to $24,999 | 176 (2.8%) | 193 (3.5%) |
| $25,000 to $29,999 | 422 (6.8%) | 662 (11.9%) |
| $30,000 to $34,999 | 361 (5.8%) | 592 (10.6%) |
| $35,000 to $39,999 | 387 (6.2%) | 277 (5.0%) |
| $40,000 to $44,999 | 368 (5.9%) | 311 (5.6%) |
| $45,000 to $49,999 | 380 (6.1%) | 278 (5.0%) |
| $50,000 to $54,999 | 277 (4.4%) | 170 (3.0%) |
| $55,000 to $64,999 | 565 (9.0%) | 333 (6.0%) |
| $65,000 to $74,999 | 377 (6.0%) | 270 (4.9%) |
| $75,000 to $99,999 | 569 (9.1%) | 202 (3.6%) |
| $100,000+ | 745 (11.9%) | 178 (3.2%) |
| Total | 6,250 (100.0%) | 5,565 (100.0%) |
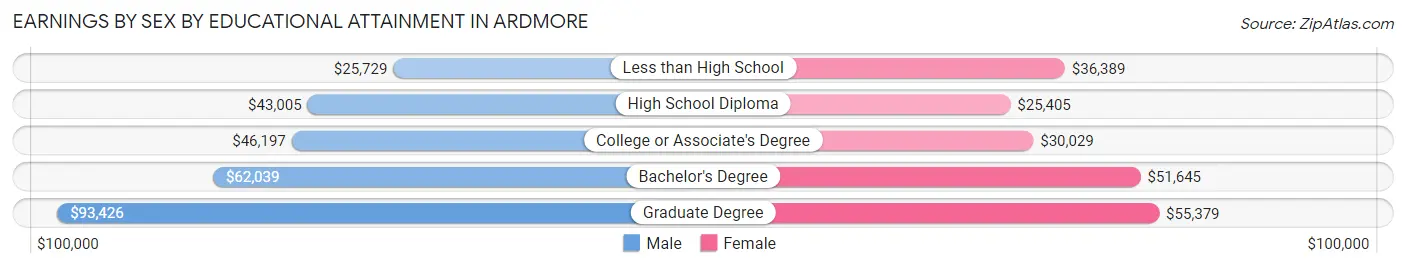
Earnings by Sex by Educational Attainment in Ardmore
Average earnings in Ardmore are $46,683 for men and $32,513 for women, a difference of 30.3%. Men with an educational attainment of graduate degree enjoy the highest average annual earnings of $93,426, while those with less than high school education earn the least with $25,729. Women with an educational attainment of graduate degree earn the most with the average annual earnings of $55,379, while those with high school diploma education have the smallest earnings of $25,405.
| Educational Attainment | Male Income | Female Income |
| Less than High School | $25,729 | $36,389 |
| High School Diploma | $43,005 | $25,405 |
| College or Associate's Degree | $46,197 | $30,029 |
| Bachelor's Degree | $62,039 | $51,645 |
| Graduate Degree | $93,426 | $55,379 |
| Total | $46,683 | $32,513 |
Family Income in Ardmore
Family Income Brackets in Ardmore
According to the Ardmore family income data, there are 1,040 families falling into the $50,000 to $74,999 income range, which is the most common income bracket and makes up 18.0% of all families. Conversely, the $10,000 to $14,999 income bracket is the least frequent group with only 139 families (2.4%) belonging to this category.
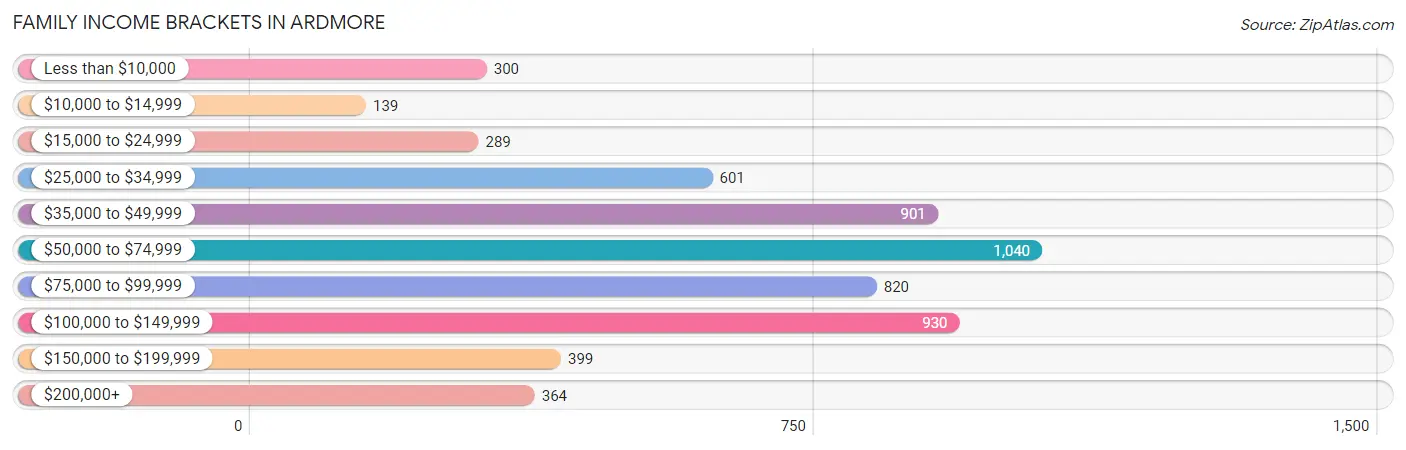
| Income Bracket | # Families | % Families |
| Less than $10,000 | 300 | 5.2% |
| $10,000 to $14,999 | 139 | 2.4% |
| $15,000 to $24,999 | 289 | 5.0% |
| $25,000 to $34,999 | 601 | 10.4% |
| $35,000 to $49,999 | 901 | 15.6% |
| $50,000 to $74,999 | 1,040 | 18.0% |
| $75,000 to $99,999 | 820 | 14.2% |
| $100,000 to $149,999 | 930 | 16.1% |
| $150,000 to $199,999 | 399 | 6.9% |
| $200,000+ | 364 | 6.3% |
Family Income by Famaliy Size in Ardmore
5-person families (457 | 7.9%) account for the highest median family income in Ardmore with $108,897 per family, while 2-person families (2,807 | 48.6%) have the highest median income of $29,174 per family member.
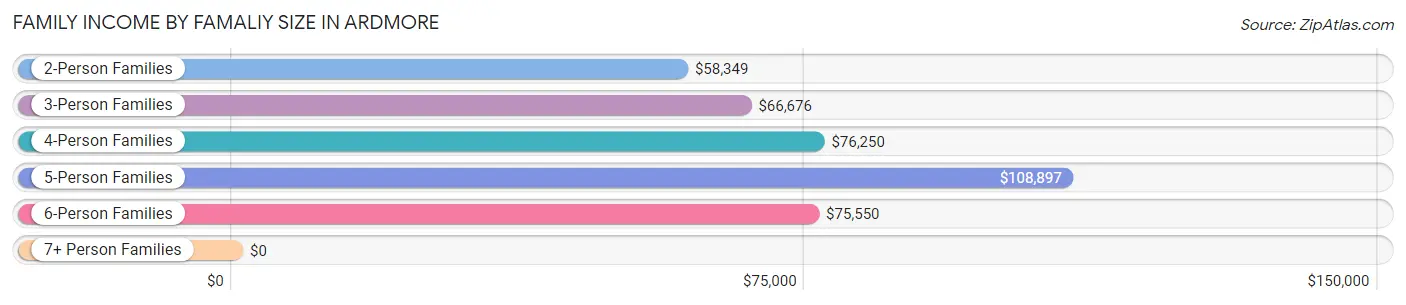
| Income Bracket | # Families | Median Income |
| 2-Person Families | 2,807 (48.6%) | $58,349 |
| 3-Person Families | 1,315 (22.8%) | $66,676 |
| 4-Person Families | 926 (16.0%) | $76,250 |
| 5-Person Families | 457 (7.9%) | $108,897 |
| 6-Person Families | 213 (3.7%) | $75,550 |
| 7+ Person Families | 59 (1.0%) | $0 |
| Total | 5,777 (100.0%) | $66,752 |
Family Income by Number of Earners in Ardmore
The median family income in Ardmore is $66,752, with families comprising 3+ earners (446) having the highest median family income of $107,727, while families with no earners (861) have the lowest median family income of $37,077, accounting for 7.7% and 14.9% of families, respectively.
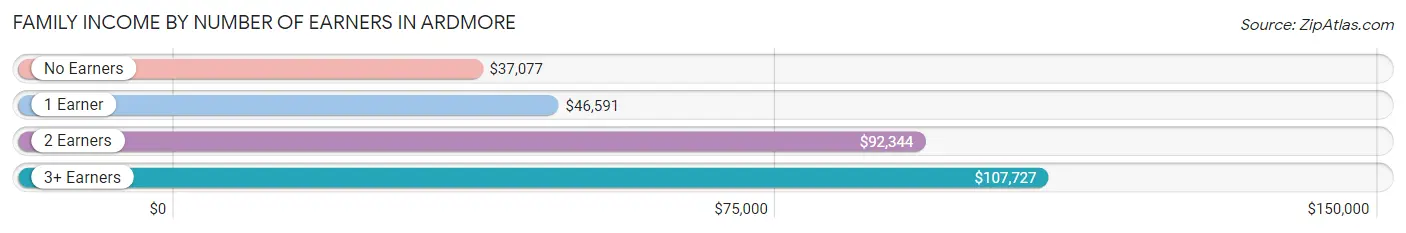
| Number of Earners | # Families | Median Income |
| No Earners | 861 (14.9%) | $37,077 |
| 1 Earner | 2,284 (39.5%) | $46,591 |
| 2 Earners | 2,186 (37.8%) | $92,344 |
| 3+ Earners | 446 (7.7%) | $107,727 |
| Total | 5,777 (100.0%) | $66,752 |
Household Income in Ardmore
Household Income Brackets in Ardmore
With 1,828 households falling in the category, the $50,000 to $74,999 income range is the most frequent in Ardmore, accounting for 18.8% of all households. In contrast, only 408 households (4.2%) fall into the $200,000+ income bracket, making it the least populous group.
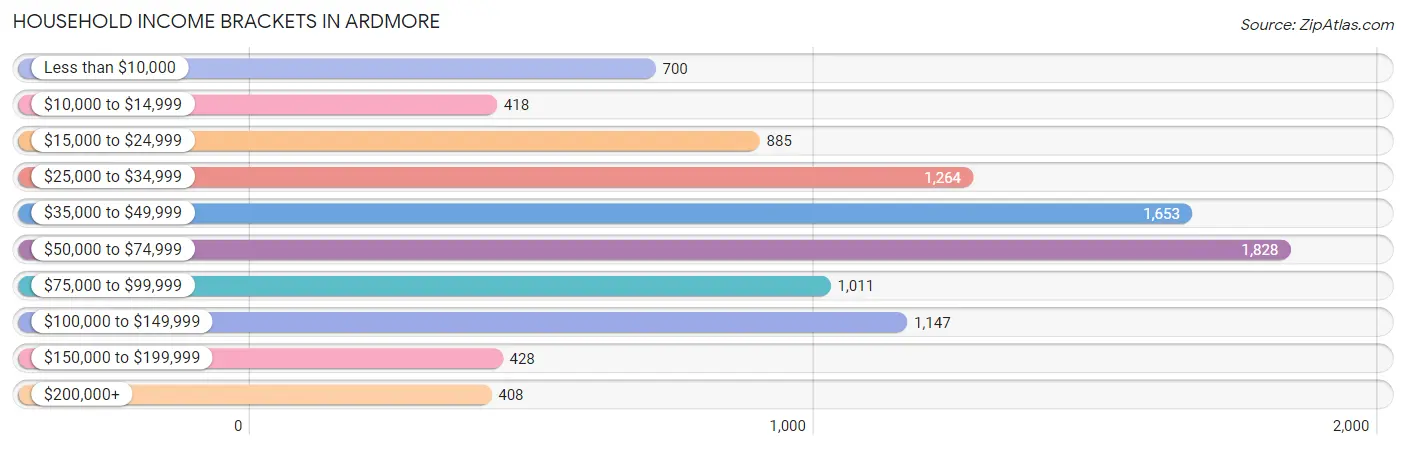
| Income Bracket | # Households | % Households |
| Less than $10,000 | 700 | 7.2% |
| $10,000 to $14,999 | 418 | 4.3% |
| $15,000 to $24,999 | 885 | 9.1% |
| $25,000 to $34,999 | 1,264 | 13.0% |
| $35,000 to $49,999 | 1,653 | 17.0% |
| $50,000 to $74,999 | 1,828 | 18.8% |
| $75,000 to $99,999 | 1,011 | 10.4% |
| $100,000 to $149,999 | 1,147 | 11.8% |
| $150,000 to $199,999 | 428 | 4.4% |
| $200,000+ | 408 | 4.2% |
Household Income by Householder Age in Ardmore
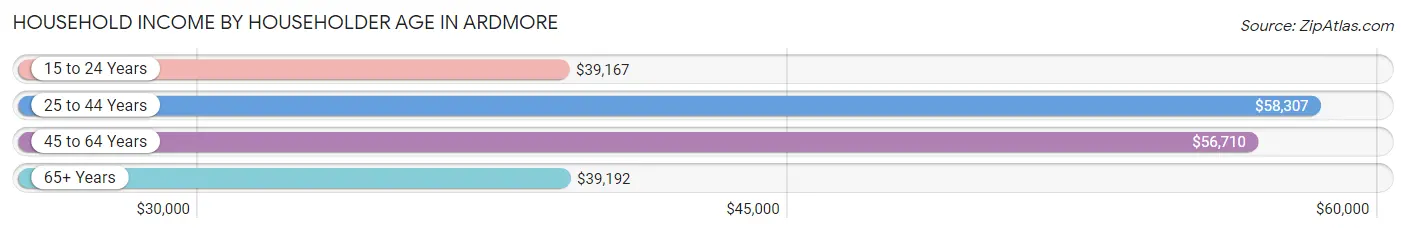
The median household income in Ardmore is $49,408, with the highest median household income of $58,307 found in the 25 to 44 years age bracket for the primary householder. A total of 3,275 households (33.7%) fall into this category. Meanwhile, the 15 to 24 years age bracket for the primary householder has the lowest median household income of $39,167, with 620 households (6.4%) in this group.
| Income Bracket | # Households | Median Income |
| 15 to 24 Years | 620 (6.4%) | $39,167 |
| 25 to 44 Years | 3,275 (33.7%) | $58,307 |
| 45 to 64 Years | 3,270 (33.6%) | $56,710 |
| 65+ Years | 2,557 (26.3%) | $39,192 |
| Total | 9,722 (100.0%) | $49,408 |
Poverty in Ardmore
Income Below Poverty by Sex and Age in Ardmore
With 15.2% poverty level for males and 20.0% for females among the residents of Ardmore, 5 year old males and 12 to 14 year old females are the most vulnerable to poverty, with 35 males (38.5%) and 205 females (32.5%) in their respective age groups living below the poverty level.
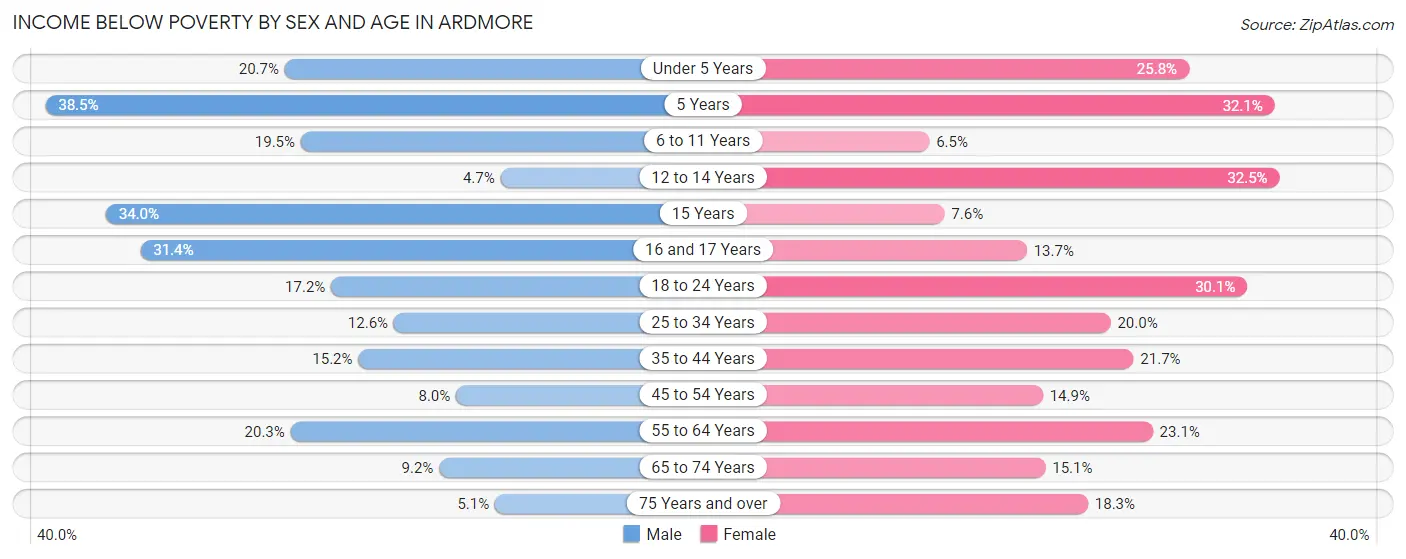
| Age Bracket | Male | Female |
| Under 5 Years | 177 (20.7%) | 200 (25.8%) |
| 5 Years | 35 (38.5%) | 45 (32.1%) |
| 6 to 11 Years | 199 (19.5%) | 64 (6.5%) |
| 12 to 14 Years | 23 (4.7%) | 205 (32.5%) |
| 15 Years | 89 (34.0%) | 16 (7.6%) |
| 16 and 17 Years | 109 (31.4%) | 39 (13.7%) |
| 18 to 24 Years | 171 (17.2%) | 332 (30.1%) |
| 25 to 34 Years | 203 (12.6%) | 327 (20.0%) |
| 35 to 44 Years | 245 (15.2%) | 342 (21.6%) |
| 45 to 54 Years | 107 (8.0%) | 217 (14.9%) |
| 55 to 64 Years | 262 (20.3%) | 342 (23.1%) |
| 65 to 74 Years | 90 (9.2%) | 178 (15.1%) |
| 75 Years and over | 26 (5.1%) | 209 (18.3%) |
| Total | 1,736 (15.2%) | 2,516 (20.0%) |
Income Above Poverty by Sex and Age in Ardmore
According to the poverty statistics in Ardmore, males aged 12 to 14 years and females aged 6 to 11 years are the age groups that are most secure financially, with 95.3% of males and 93.5% of females in these age groups living above the poverty line.
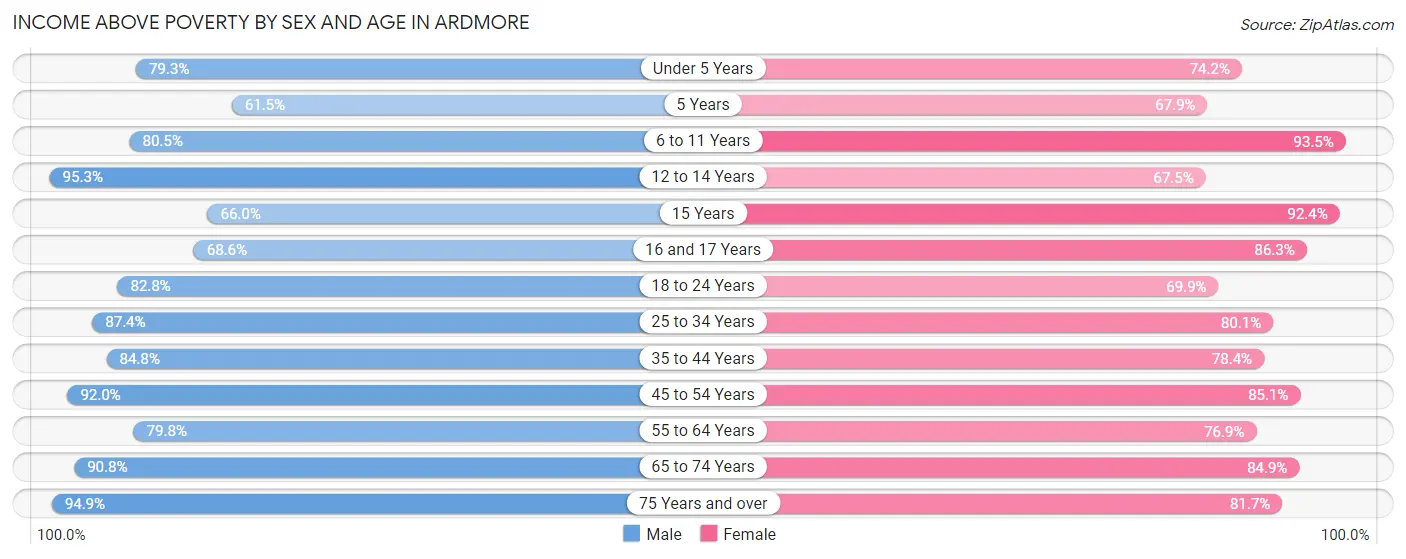
| Age Bracket | Male | Female |
| Under 5 Years | 679 (79.3%) | 576 (74.2%) |
| 5 Years | 56 (61.5%) | 95 (67.9%) |
| 6 to 11 Years | 822 (80.5%) | 922 (93.5%) |
| 12 to 14 Years | 471 (95.3%) | 426 (67.5%) |
| 15 Years | 173 (66.0%) | 194 (92.4%) |
| 16 and 17 Years | 238 (68.6%) | 245 (86.3%) |
| 18 to 24 Years | 821 (82.8%) | 771 (69.9%) |
| 25 to 34 Years | 1,411 (87.4%) | 1,312 (80.0%) |
| 35 to 44 Years | 1,365 (84.8%) | 1,238 (78.3%) |
| 45 to 54 Years | 1,238 (92.0%) | 1,237 (85.1%) |
| 55 to 64 Years | 1,032 (79.7%) | 1,140 (76.9%) |
| 65 to 74 Years | 886 (90.8%) | 1,000 (84.9%) |
| 75 Years and over | 487 (94.9%) | 935 (81.7%) |
| Total | 9,679 (84.8%) | 10,091 (80.0%) |
Income Below Poverty Among Married-Couple Families in Ardmore
The poverty statistics for married-couple families in Ardmore show that 5.9% or 222 of the total 3,776 families live below the poverty line. Families with 5 or more children have the highest poverty rate of 15.0%, comprising of 3 families. On the other hand, families with no children have the lowest poverty rate of 4.4%, which includes 93 families.
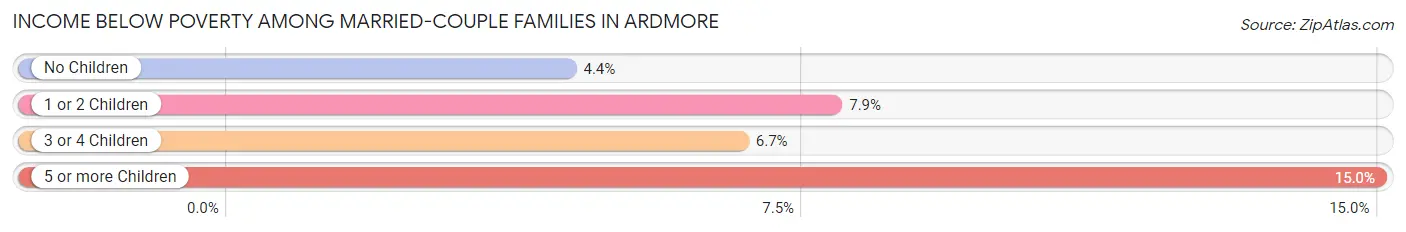
| Children | Above Poverty | Below Poverty |
| No Children | 2,011 (95.6%) | 93 (4.4%) |
| 1 or 2 Children | 1,190 (92.1%) | 102 (7.9%) |
| 3 or 4 Children | 336 (93.3%) | 24 (6.7%) |
| 5 or more Children | 17 (85.0%) | 3 (15.0%) |
| Total | 3,554 (94.1%) | 222 (5.9%) |
Income Below Poverty Among Single-Parent Households in Ardmore
According to the poverty data in Ardmore, 15.2% or 58 single-father households and 30.0% or 486 single-mother households are living below the poverty line. Among single-father households, those with 3 or 4 children have the highest poverty rate, with 22 households (34.4%) experiencing poverty. Likewise, among single-mother households, those with 3 or 4 children have the highest poverty rate, with 105 households (50.5%) falling below the poverty line.
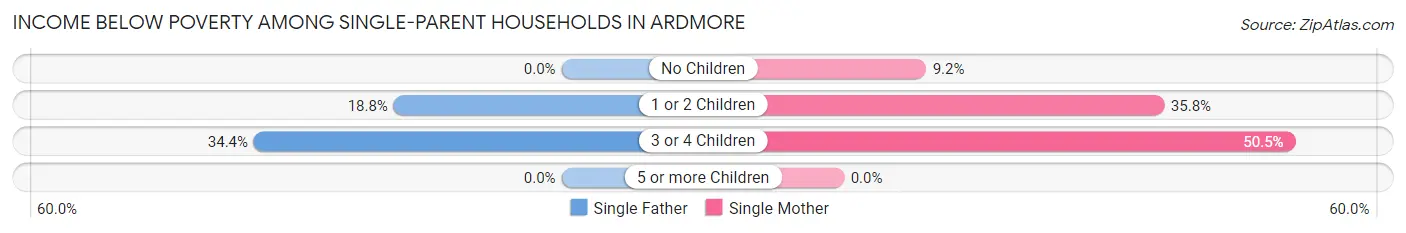
| Children | Single Father | Single Mother |
| No Children | 0 (0.0%) | 41 (9.2%) |
| 1 or 2 Children | 36 (18.8%) | 340 (35.8%) |
| 3 or 4 Children | 22 (34.4%) | 105 (50.5%) |
| 5 or more Children | 0 (0.0%) | 0 (0.0%) |
| Total | 58 (15.2%) | 486 (30.0%) |
Income Below Poverty Among Married-Couple vs Single-Parent Households in Ardmore
The poverty data for Ardmore shows that 222 of the married-couple family households (5.9%) and 544 of the single-parent households (27.2%) are living below the poverty level. Within the married-couple family households, those with 5 or more children have the highest poverty rate, with 3 households (15.0%) falling below the poverty line. Among the single-parent households, those with 3 or 4 children have the highest poverty rate, with 127 household (46.7%) living below poverty.
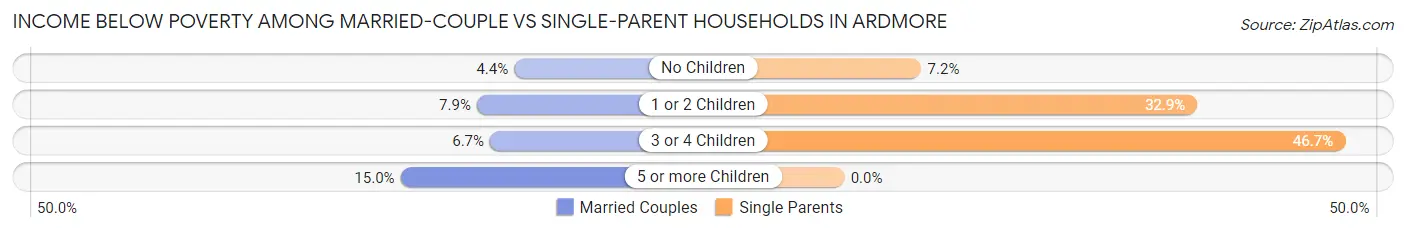
| Children | Married-Couple Families | Single-Parent Households |
| No Children | 93 (4.4%) | 41 (7.2%) |
| 1 or 2 Children | 102 (7.9%) | 376 (32.9%) |
| 3 or 4 Children | 24 (6.7%) | 127 (46.7%) |
| 5 or more Children | 3 (15.0%) | 0 (0.0%) |
| Total | 222 (5.9%) | 544 (27.2%) |
Race in Ardmore
The most populous races in Ardmore are White / Caucasian (16,041 | 64.7%), Two or more Races (3,358 | 13.6%), and Hispanic or Latino (2,851 | 11.5%).
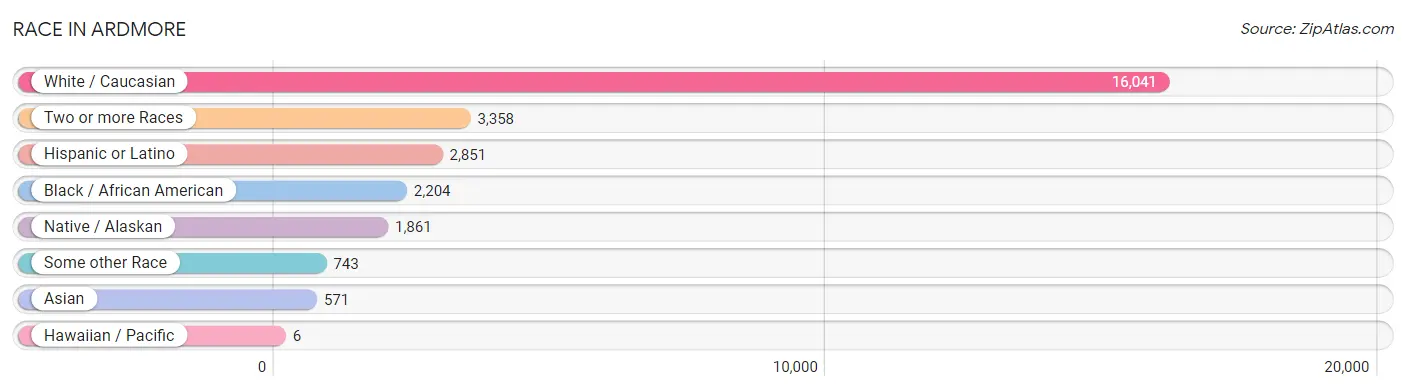
| Race | # Population | % Population |
| Asian | 571 | 2.3% |
| Black / African American | 2,204 | 8.9% |
| Hawaiian / Pacific | 6 | 0.0% |
| Hispanic or Latino | 2,851 | 11.5% |
| Native / Alaskan | 1,861 | 7.5% |
| White / Caucasian | 16,041 | 64.7% |
| Two or more Races | 3,358 | 13.6% |
| Some other Race | 743 | 3.0% |
| Total | 24,784 | 100.0% |
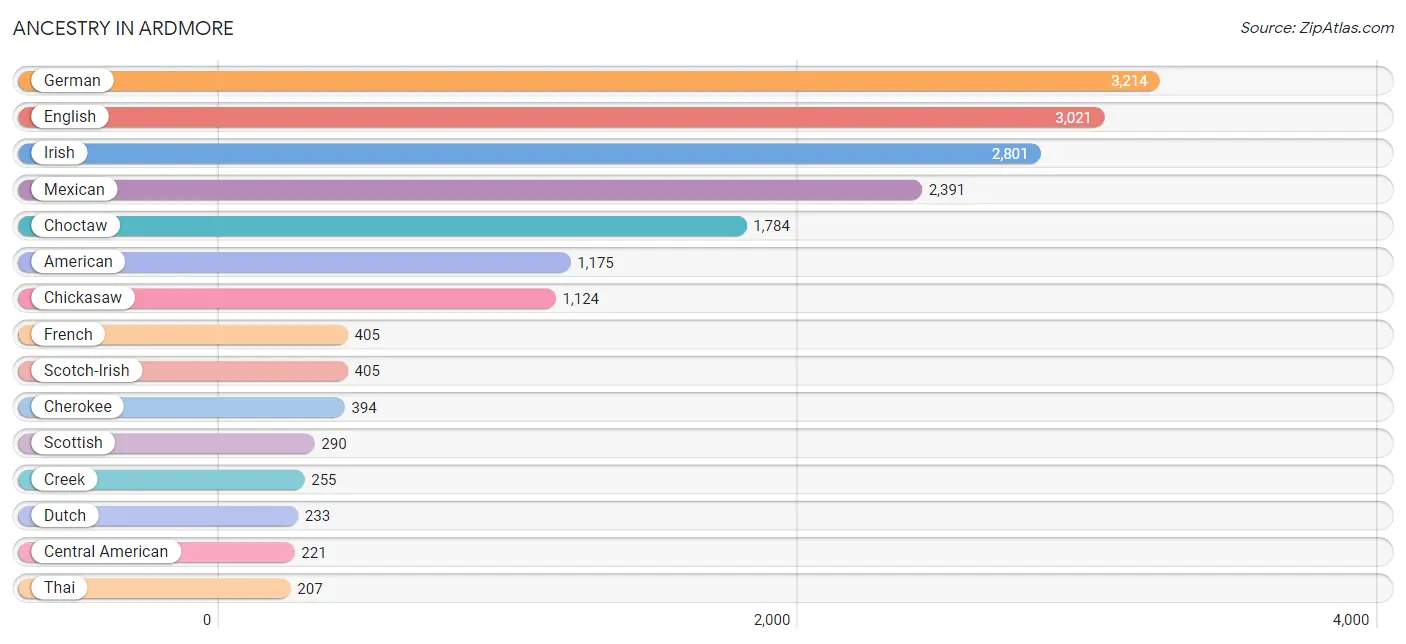
Ancestry in Ardmore
The most populous ancestries reported in Ardmore are German (3,214 | 13.0%), English (3,021 | 12.2%), Irish (2,801 | 11.3%), Mexican (2,391 | 9.7%), and Choctaw (1,784 | 7.2%), together accounting for 53.3% of all Ardmore residents.
| Ancestry | # Population | % Population |
| African | 132 | 0.5% |
| Alaska Native | 22 | 0.1% |
| Albanian | 30 | 0.1% |
| American | 1,175 | 4.7% |
| Apache | 16 | 0.1% |
| Arab | 162 | 0.6% |
| Belgian | 16 | 0.1% |
| Bhutanese | 6 | 0.0% |
| Blackfeet | 49 | 0.2% |
| British | 82 | 0.3% |
| Burmese | 64 | 0.3% |
| Cajun | 10 | 0.0% |
| Central American | 221 | 0.9% |
| Central American Indian | 52 | 0.2% |
| Cherokee | 394 | 1.6% |
| Cheyenne | 22 | 0.1% |
| Chickasaw | 1,124 | 4.5% |
| Chippewa | 7 | 0.0% |
| Choctaw | 1,784 | 7.2% |
| Comanche | 19 | 0.1% |
| Creek | 255 | 1.0% |
| Czech | 22 | 0.1% |
| Danish | 123 | 0.5% |
| Dominican | 5 | 0.0% |
| Dutch | 233 | 0.9% |
| Dutch West Indian | 140 | 0.6% |
| Eastern European | 20 | 0.1% |
| Ecuadorian | 13 | 0.1% |
| Egyptian | 10 | 0.0% |
| English | 3,021 | 12.2% |
| European | 176 | 0.7% |
| Finnish | 8 | 0.0% |
| French | 405 | 1.6% |
| German | 3,214 | 13.0% |
| German Russian | 25 | 0.1% |
| Greek | 69 | 0.3% |
| Haitian | 43 | 0.2% |
| Honduran | 106 | 0.4% |
| Indian (Asian) | 104 | 0.4% |
| Iranian | 12 | 0.1% |
| Irish | 2,801 | 11.3% |
| Italian | 124 | 0.5% |
| Jamaican | 18 | 0.1% |
| Kiowa | 27 | 0.1% |
| Korean | 35 | 0.1% |
| Lebanese | 44 | 0.2% |
| Lithuanian | 33 | 0.1% |
| Malaysian | 2 | 0.0% |
| Mexican | 2,391 | 9.7% |
| Mexican American Indian | 14 | 0.1% |
| Native Hawaiian | 38 | 0.2% |
| Northern European | 25 | 0.1% |
| Norwegian | 141 | 0.6% |
| Osage | 43 | 0.2% |
| Pakistani | 11 | 0.0% |
| Palestinian | 108 | 0.4% |
| Peruvian | 26 | 0.1% |
| Polish | 83 | 0.3% |
| Potawatomi | 46 | 0.2% |
| Puerto Rican | 85 | 0.3% |
| Romanian | 18 | 0.1% |
| Russian | 99 | 0.4% |
| Salvadoran | 115 | 0.5% |
| Scandinavian | 41 | 0.2% |
| Scotch-Irish | 405 | 1.6% |
| Scottish | 290 | 1.2% |
| Seminole | 102 | 0.4% |
| Sioux | 6 | 0.0% |
| Slavic | 11 | 0.0% |
| Slovak | 8 | 0.0% |
| South American | 39 | 0.2% |
| Spaniard | 68 | 0.3% |
| Spanish | 6 | 0.0% |
| Sri Lankan | 185 | 0.7% |
| Subsaharan African | 145 | 0.6% |
| Swedish | 95 | 0.4% |
| Swiss | 16 | 0.1% |
| Thai | 207 | 0.8% |
| Vietnamese | 17 | 0.1% |
| Welsh | 119 | 0.5% | View All 80 Rows |
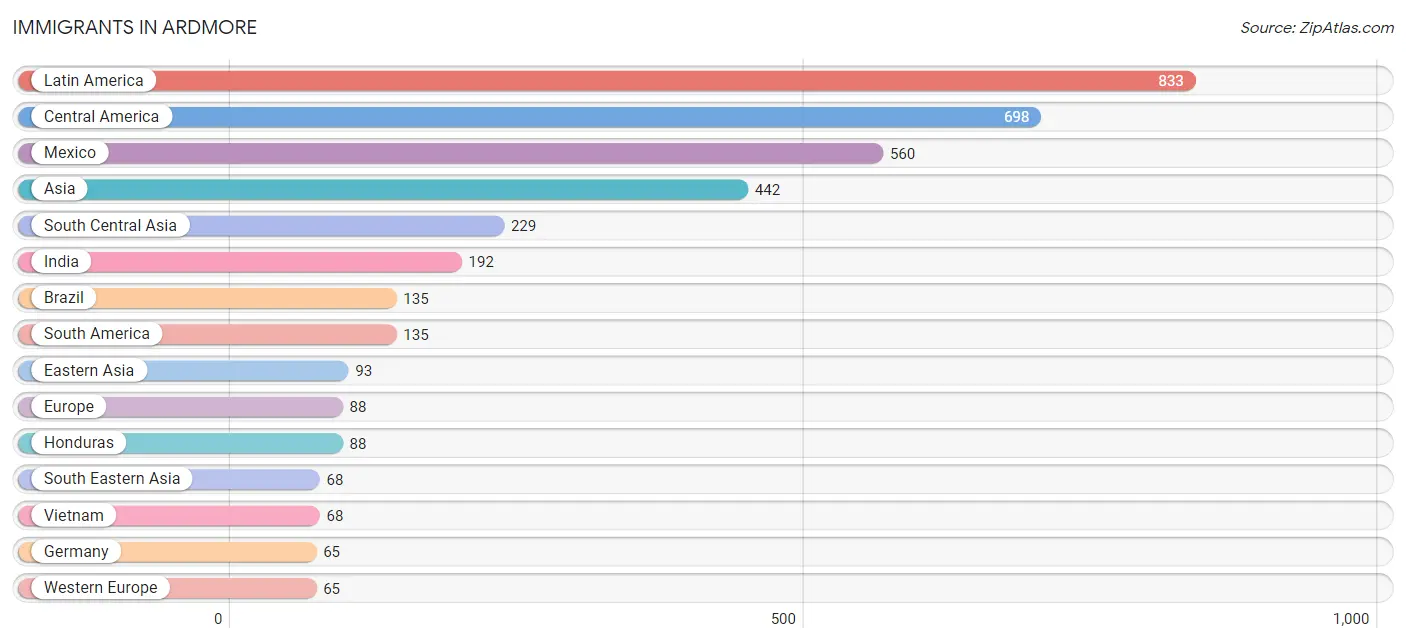
Immigrants in Ardmore
The most numerous immigrant groups reported in Ardmore came from Latin America (833 | 3.4%), Central America (698 | 2.8%), Mexico (560 | 2.3%), Asia (442 | 1.8%), and South Central Asia (229 | 0.9%), together accounting for 11.1% of all Ardmore residents.
| Immigration Origin | # Population | % Population |
| Asia | 442 | 1.8% |
| Bangladesh | 37 | 0.2% |
| Brazil | 135 | 0.5% |
| Central America | 698 | 2.8% |
| China | 39 | 0.2% |
| Eastern Asia | 93 | 0.4% |
| Eastern Europe | 15 | 0.1% |
| El Salvador | 42 | 0.2% |
| England | 8 | 0.0% |
| Europe | 88 | 0.4% |
| Germany | 65 | 0.3% |
| Guatemala | 8 | 0.0% |
| Honduras | 88 | 0.4% |
| India | 192 | 0.8% |
| Korea | 54 | 0.2% |
| Kuwait | 34 | 0.1% |
| Latin America | 833 | 3.4% |
| Mexico | 560 | 2.3% |
| Northern Europe | 8 | 0.0% |
| South America | 135 | 0.5% |
| South Central Asia | 229 | 0.9% |
| South Eastern Asia | 68 | 0.3% |
| Vietnam | 68 | 0.3% |
| Western Asia | 52 | 0.2% |
| Western Europe | 65 | 0.3% | View All 25 Rows |
Sex and Age in Ardmore
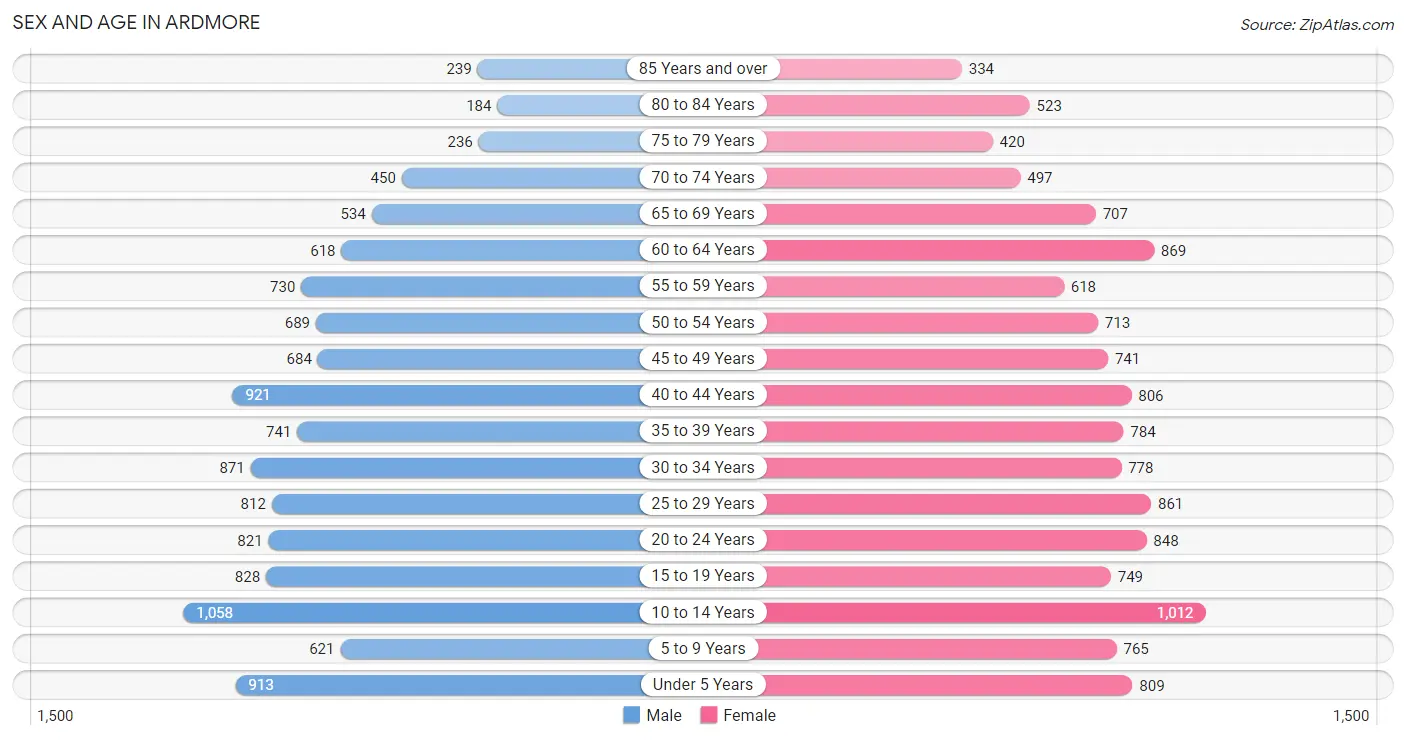
Sex and Age in Ardmore
The most populous age groups in Ardmore are 10 to 14 Years (1,058 | 8.8%) for men and 10 to 14 Years (1,012 | 7.9%) for women.
| Age Bracket | Male | Female |
| Under 5 Years | 913 (7.6%) | 809 (6.3%) |
| 5 to 9 Years | 621 (5.2%) | 765 (6.0%) |
| 10 to 14 Years | 1,058 (8.8%) | 1,012 (7.9%) |
| 15 to 19 Years | 828 (6.9%) | 749 (5.8%) |
| 20 to 24 Years | 821 (6.9%) | 848 (6.6%) |
| 25 to 29 Years | 812 (6.8%) | 861 (6.7%) |
| 30 to 34 Years | 871 (7.3%) | 778 (6.1%) |
| 35 to 39 Years | 741 (6.2%) | 784 (6.1%) |
| 40 to 44 Years | 921 (7.7%) | 806 (6.3%) |
| 45 to 49 Years | 684 (5.7%) | 741 (5.8%) |
| 50 to 54 Years | 689 (5.8%) | 713 (5.6%) |
| 55 to 59 Years | 730 (6.1%) | 618 (4.8%) |
| 60 to 64 Years | 618 (5.2%) | 869 (6.8%) |
| 65 to 69 Years | 534 (4.5%) | 707 (5.5%) |
| 70 to 74 Years | 450 (3.8%) | 497 (3.9%) |
| 75 to 79 Years | 236 (2.0%) | 420 (3.3%) |
| 80 to 84 Years | 184 (1.5%) | 523 (4.1%) |
| 85 Years and over | 239 (2.0%) | 334 (2.6%) |
| Total | 11,950 (100.0%) | 12,834 (100.0%) |
Families and Households in Ardmore
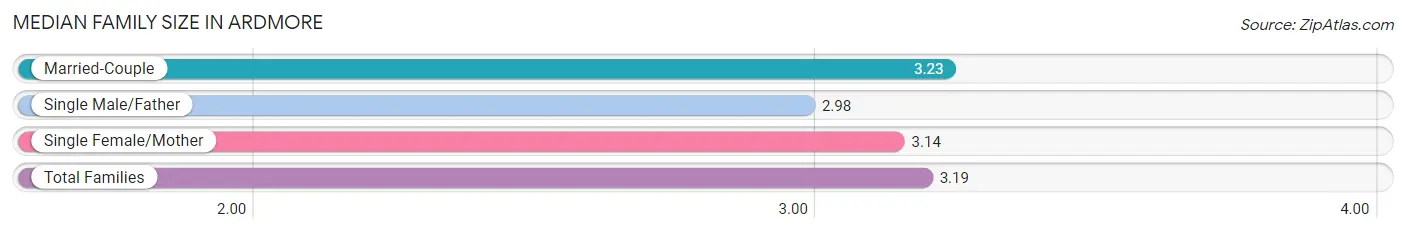
Median Family Size in Ardmore
The median family size in Ardmore is 3.19 persons per family, with married-couple families (3,776 | 65.4%) accounting for the largest median family size of 3.23 persons per family. On the other hand, single male/father families (381 | 6.6%) represent the smallest median family size with 2.98 persons per family.
| Family Type | # Families | Family Size |
| Married-Couple | 3,776 (65.4%) | 3.23 |
| Single Male/Father | 381 (6.6%) | 2.98 |
| Single Female/Mother | 1,620 (28.0%) | 3.14 |
| Total Families | 5,777 (100.0%) | 3.19 |
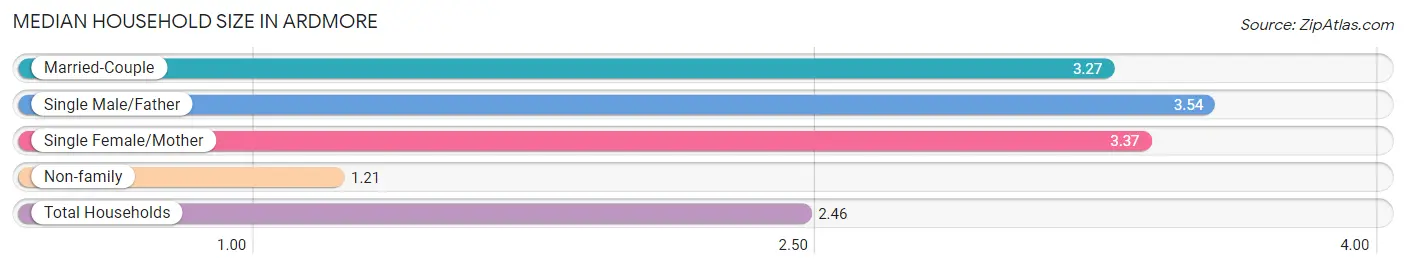
Median Household Size in Ardmore
The median household size in Ardmore is 2.46 persons per household, with single male/father households (381 | 3.9%) accounting for the largest median household size of 3.54 persons per household. non-family households (3,945 | 40.6%) represent the smallest median household size with 1.21 persons per household.
| Household Type | # Households | Household Size |
| Married-Couple | 3,776 (38.8%) | 3.27 |
| Single Male/Father | 381 (3.9%) | 3.54 |
| Single Female/Mother | 1,620 (16.7%) | 3.37 |
| Non-family | 3,945 (40.6%) | 1.21 |
| Total Households | 9,722 (100.0%) | 2.46 |
Household Size by Marriage Status in Ardmore
Out of a total of 9,722 households in Ardmore, 5,777 (59.4%) are family households, while 3,945 (40.6%) are nonfamily households. The most numerous type of family households are 2-person households, comprising 2,546, and the most common type of nonfamily households are 1-person households, comprising 3,385.
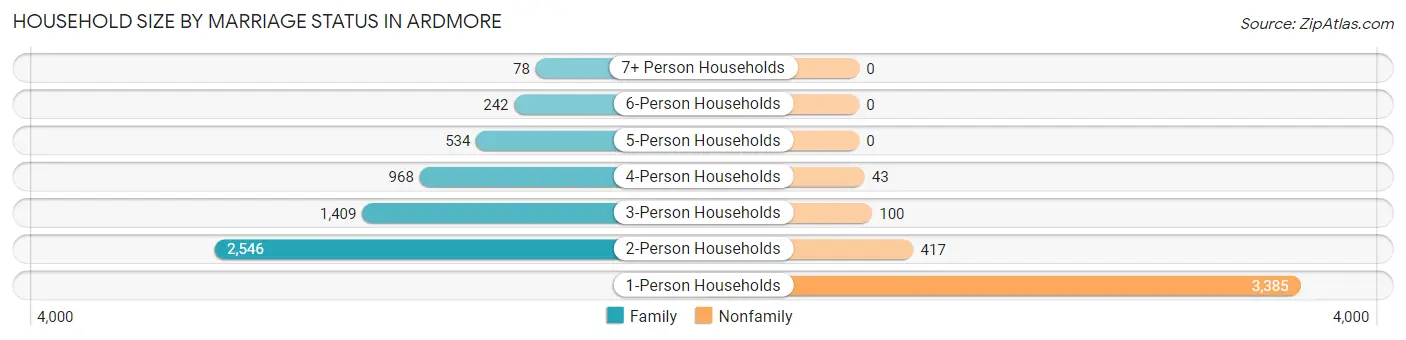
| Household Size | Family Households | Nonfamily Households |
| 1-Person Households | - | 3,385 (34.8%) |
| 2-Person Households | 2,546 (26.2%) | 417 (4.3%) |
| 3-Person Households | 1,409 (14.5%) | 100 (1.0%) |
| 4-Person Households | 968 (10.0%) | 43 (0.4%) |
| 5-Person Households | 534 (5.5%) | 0 (0.0%) |
| 6-Person Households | 242 (2.5%) | 0 (0.0%) |
| 7+ Person Households | 78 (0.8%) | 0 (0.0%) |
| Total | 5,777 (59.4%) | 3,945 (40.6%) |
Female Fertility in Ardmore
Fertility by Age in Ardmore
Average fertility rate in Ardmore is 80.0 births per 1,000 women. Women in the age bracket of 20 to 34 years have the highest fertility rate with 162.0 births per 1,000 women. Women in the age bracket of 20 to 34 years acount for 88.7% of all women with births.
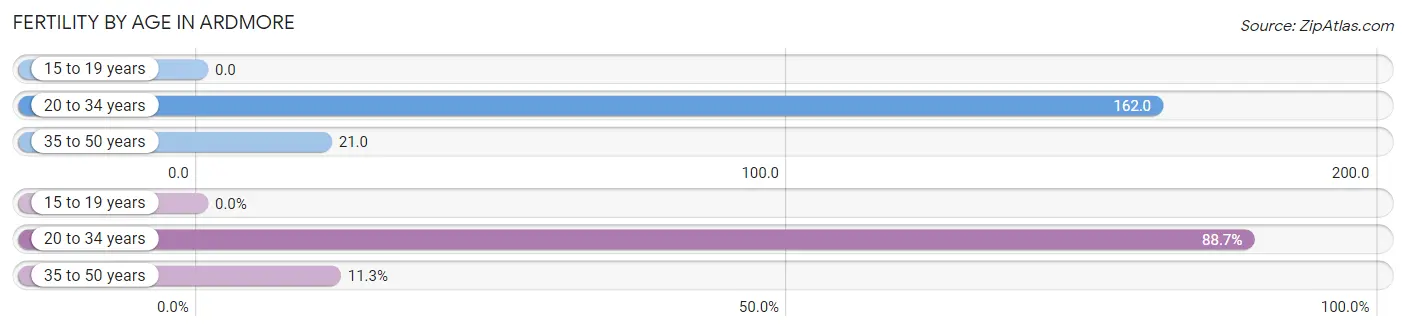
| Age Bracket | Women with Births | Births / 1,000 Women |
| 15 to 19 years | 0 (0.0%) | 0.0 |
| 20 to 34 years | 402 (88.7%) | 162.0 |
| 35 to 50 years | 51 (11.3%) | 21.0 |
| Total | 453 (100.0%) | 80.0 |
Fertility by Age by Marriage Status in Ardmore
43.0% of women with births (453) in Ardmore are married. The highest percentage of unmarried women with births falls into 35 to 50 years age bracket with 88.2% of them unmarried at the time of birth, while the lowest percentage of unmarried women with births belong to 20 to 34 years age bracket with 53.0% of them unmarried.
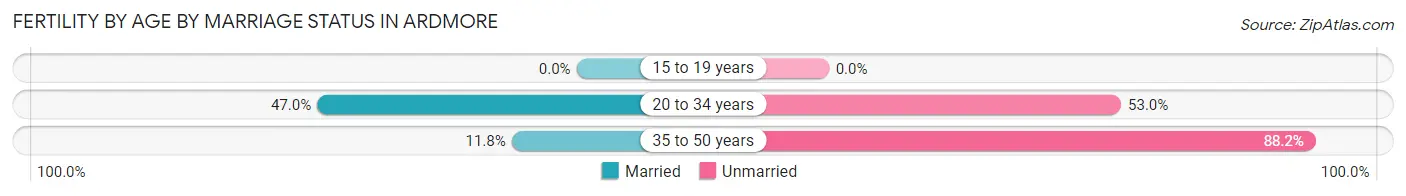
| Age Bracket | Married | Unmarried |
| 15 to 19 years | 0 (0.0%) | 0 (0.0%) |
| 20 to 34 years | 189 (47.0%) | 213 (53.0%) |
| 35 to 50 years | 6 (11.8%) | 45 (88.2%) |
| Total | 195 (43.0%) | 258 (57.0%) |
Fertility by Education in Ardmore
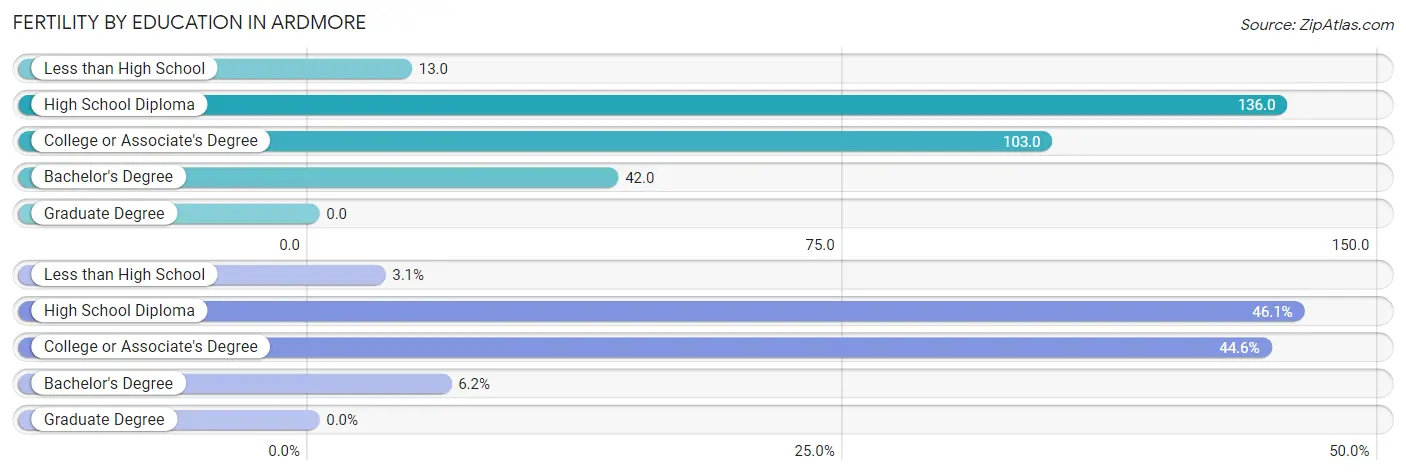
| Educational Attainment | Women with Births | Births / 1,000 Women |
| Less than High School | 14 (3.1%) | 13.0 |
| High School Diploma | 209 (46.1%) | 136.0 |
| College or Associate's Degree | 202 (44.6%) | 103.0 |
| Bachelor's Degree | 28 (6.2%) | 42.0 |
| Graduate Degree | 0 (0.0%) | 0.0 |
| Total | 453 (100.0%) | 80.0 |
Fertility by Education by Marriage Status in Ardmore
57.0% of women with births in Ardmore are unmarried. Women with the educational attainment of less than high school are most likely to be married with 100.0% of them married at childbirth, while women with the educational attainment of high school diploma are least likely to be married with 67.0% of them unmarried at childbirth.
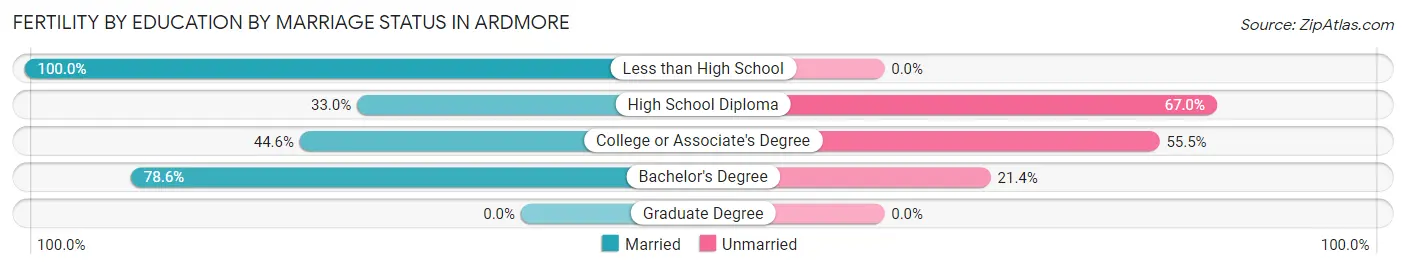
| Educational Attainment | Married | Unmarried |
| Less than High School | 14 (100.0%) | 0 (0.0%) |
| High School Diploma | 69 (33.0%) | 140 (67.0%) |
| College or Associate's Degree | 90 (44.6%) | 112 (55.4%) |
| Bachelor's Degree | 22 (78.6%) | 6 (21.4%) |
| Graduate Degree | 0 (0.0%) | 0 (0.0%) |
| Total | 195 (43.0%) | 258 (57.0%) |
Employment Characteristics in Ardmore
Employment by Class of Employer in Ardmore
Among the 10,665 employed individuals in Ardmore, private company employees (7,583 | 71.1%), not-for-profit organizations (971 | 9.1%), and self-employed (not incorporated) (494 | 4.6%) make up the most common classes of employment.
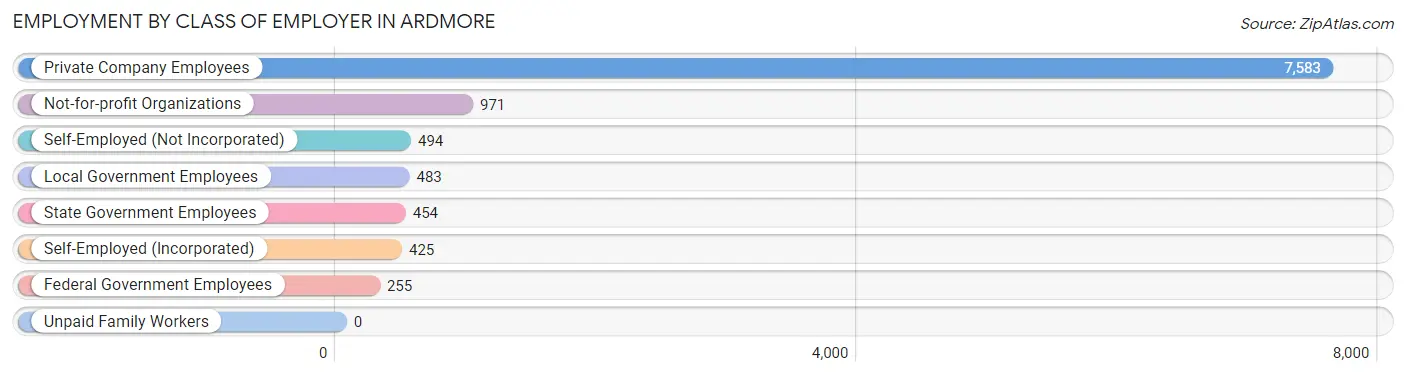
| Employer Class | # Employees | % Employees |
| Private Company Employees | 7,583 | 71.1% |
| Self-Employed (Incorporated) | 425 | 4.0% |
| Self-Employed (Not Incorporated) | 494 | 4.6% |
| Not-for-profit Organizations | 971 | 9.1% |
| Local Government Employees | 483 | 4.5% |
| State Government Employees | 454 | 4.3% |
| Federal Government Employees | 255 | 2.4% |
| Unpaid Family Workers | 0 | 0.0% |
| Total | 10,665 | 100.0% |
Employment Status by Age in Ardmore
According to the labor force statistics for Ardmore, out of the total population over 16 years of age (19,134), 59.6% or 11,404 individuals are in the labor force, with 5.2% or 593 of them unemployed. The age group with the highest labor force participation rate is 30 to 34 years, with 82.1% or 1,354 individuals in the labor force. Within the labor force, the 30 to 34 years age range has the highest percentage of unemployed individuals, with 11.1% or 150 of them being unemployed.
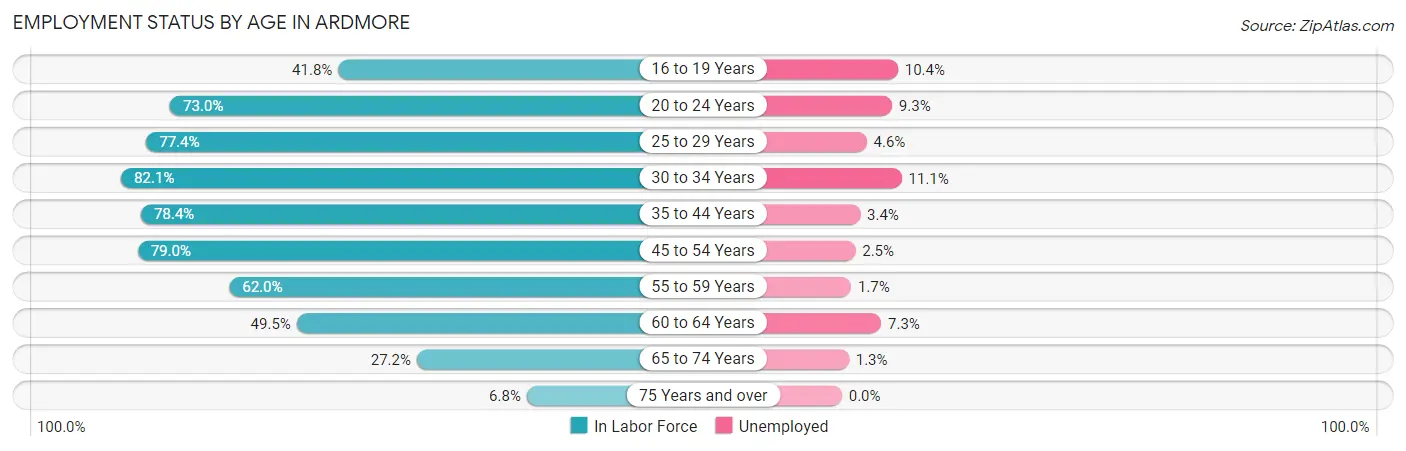
| Age Bracket | In Labor Force | Unemployed |
| 16 to 19 Years | 462 (41.8%) | 48 (10.4%) |
| 20 to 24 Years | 1,218 (73.0%) | 113 (9.3%) |
| 25 to 29 Years | 1,295 (77.4%) | 60 (4.6%) |
| 30 to 34 Years | 1,354 (82.1%) | 150 (11.1%) |
| 35 to 44 Years | 2,550 (78.4%) | 87 (3.4%) |
| 45 to 54 Years | 2,233 (79.0%) | 56 (2.5%) |
| 55 to 59 Years | 836 (62.0%) | 14 (1.7%) |
| 60 to 64 Years | 736 (49.5%) | 54 (7.3%) |
| 65 to 74 Years | 595 (27.2%) | 8 (1.3%) |
| 75 Years and over | 132 (6.8%) | 0 (0.0%) |
| Total | 11,404 (59.6%) | 593 (5.2%) |
Employment Status by Educational Attainment in Ardmore
According to labor force statistics for Ardmore, 73.6% of individuals (9,006) out of the total population between 25 and 64 years of age (12,236) are in the labor force, with 4.7% or 423 of them being unemployed. The group with the highest labor force participation rate are those with the educational attainment of bachelor's degree or higher, with 88.3% or 2,253 individuals in the labor force. Within the labor force, individuals with less than high school education have the highest percentage of unemployment, with 8.4% or 85 of them being unemployed.
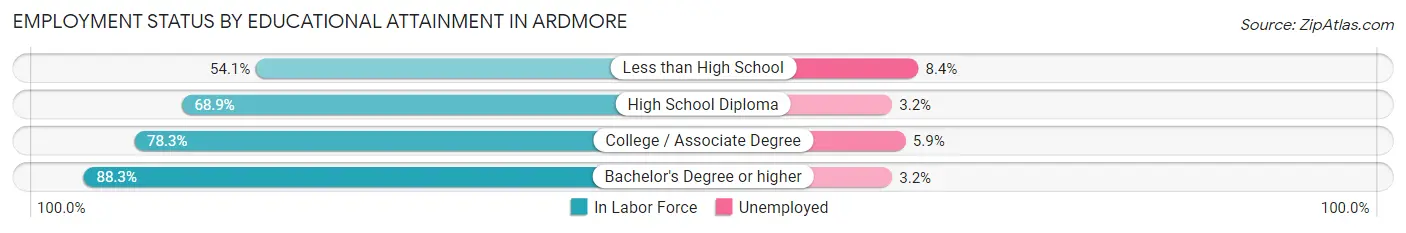
| Educational Attainment | In Labor Force | Unemployed |
| Less than High School | 1,015 (54.1%) | 158 (8.4%) |
| High School Diploma | 2,779 (68.9%) | 129 (3.2%) |
| College / Associate Degree | 2,955 (78.3%) | 223 (5.9%) |
| Bachelor's Degree or higher | 2,253 (88.3%) | 82 (3.2%) |
| Total | 9,006 (73.6%) | 575 (4.7%) |
Employment Occupations by Sex in Ardmore
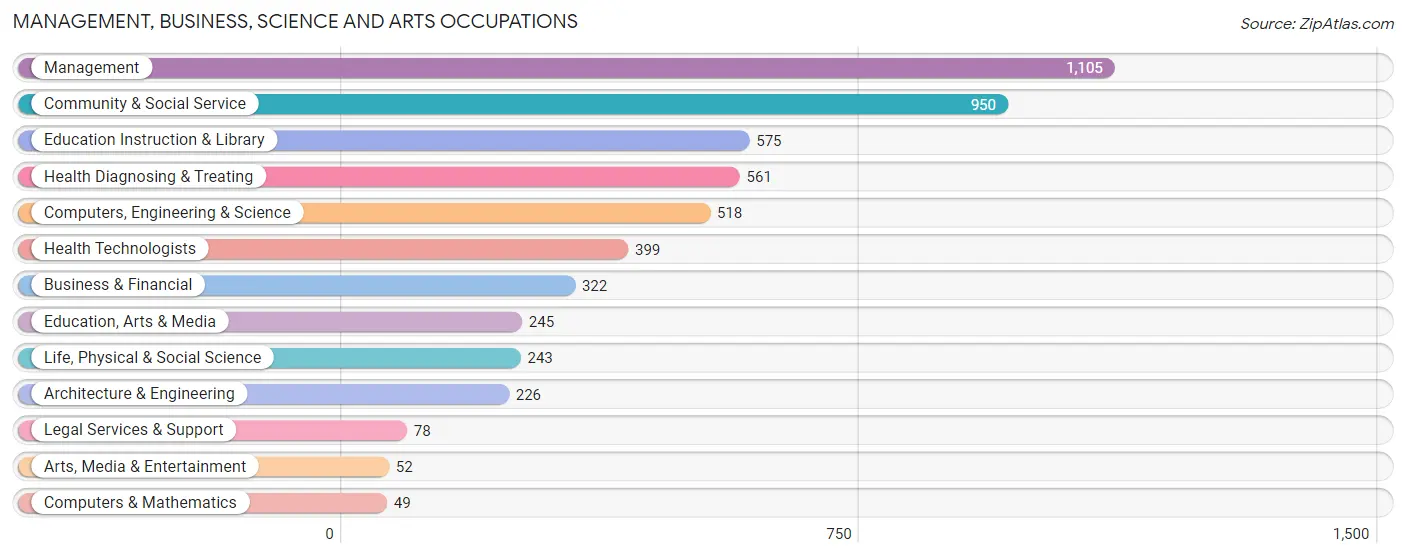
Management, Business, Science and Arts Occupations
The most common Management, Business, Science and Arts occupations in Ardmore are Management (1,105 | 10.2%), Community & Social Service (950 | 8.8%), Education Instruction & Library (575 | 5.3%), Health Diagnosing & Treating (561 | 5.2%), and Computers, Engineering & Science (518 | 4.8%).
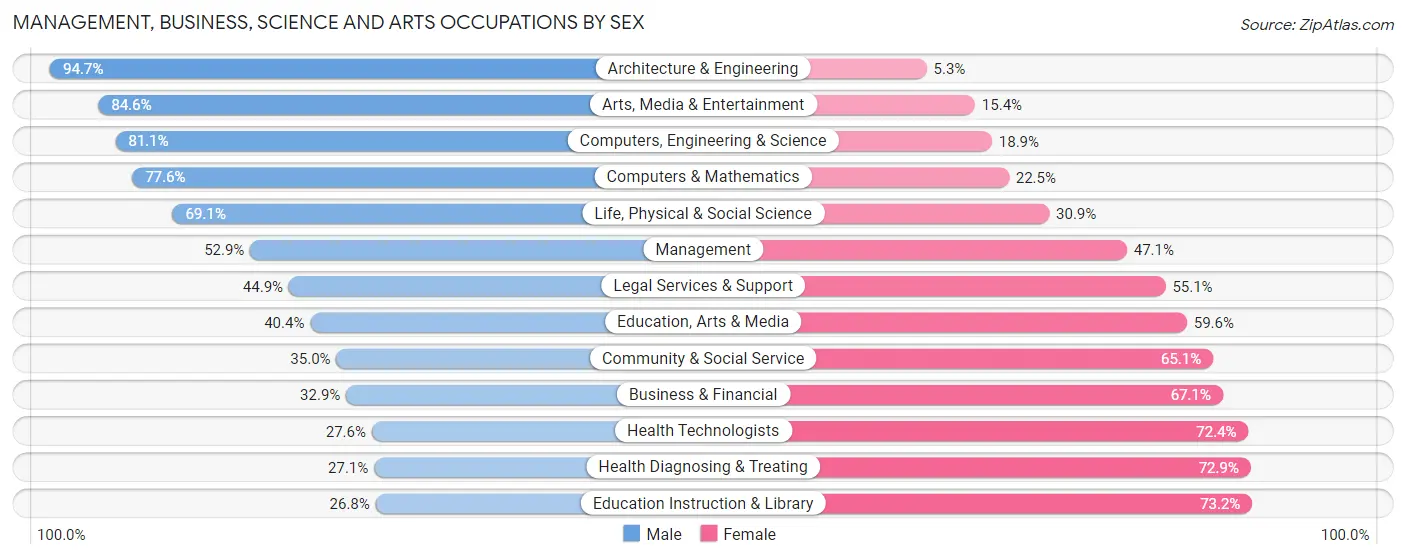
Management, Business, Science and Arts Occupations by Sex
Within the Management, Business, Science and Arts occupations in Ardmore, the most male-oriented occupations are Architecture & Engineering (94.7%), Arts, Media & Entertainment (84.6%), and Computers, Engineering & Science (81.1%), while the most female-oriented occupations are Education Instruction & Library (73.2%), Health Diagnosing & Treating (72.9%), and Health Technologists (72.4%).
| Occupation | Male | Female |
| Management | 585 (52.9%) | 520 (47.1%) |
| Business & Financial | 106 (32.9%) | 216 (67.1%) |
| Computers, Engineering & Science | 420 (81.1%) | 98 (18.9%) |
| Computers & Mathematics | 38 (77.5%) | 11 (22.5%) |
| Architecture & Engineering | 214 (94.7%) | 12 (5.3%) |
| Life, Physical & Social Science | 168 (69.1%) | 75 (30.9%) |
| Community & Social Service | 332 (34.9%) | 618 (65.0%) |
| Education, Arts & Media | 99 (40.4%) | 146 (59.6%) |
| Legal Services & Support | 35 (44.9%) | 43 (55.1%) |
| Education Instruction & Library | 154 (26.8%) | 421 (73.2%) |
| Arts, Media & Entertainment | 44 (84.6%) | 8 (15.4%) |
| Health Diagnosing & Treating | 152 (27.1%) | 409 (72.9%) |
| Health Technologists | 110 (27.6%) | 289 (72.4%) |
| Total (Category) | 1,595 (46.2%) | 1,861 (53.8%) |
| Total (Overall) | 5,711 (52.8%) | 5,111 (47.2%) |
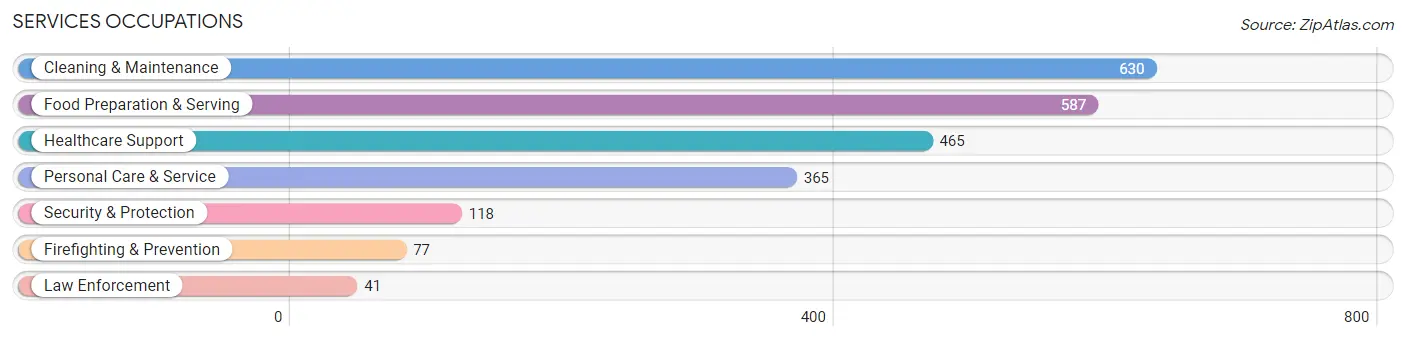
Services Occupations
The most common Services occupations in Ardmore are Cleaning & Maintenance (630 | 5.8%), Food Preparation & Serving (587 | 5.4%), Healthcare Support (465 | 4.3%), Personal Care & Service (365 | 3.4%), and Security & Protection (118 | 1.1%).
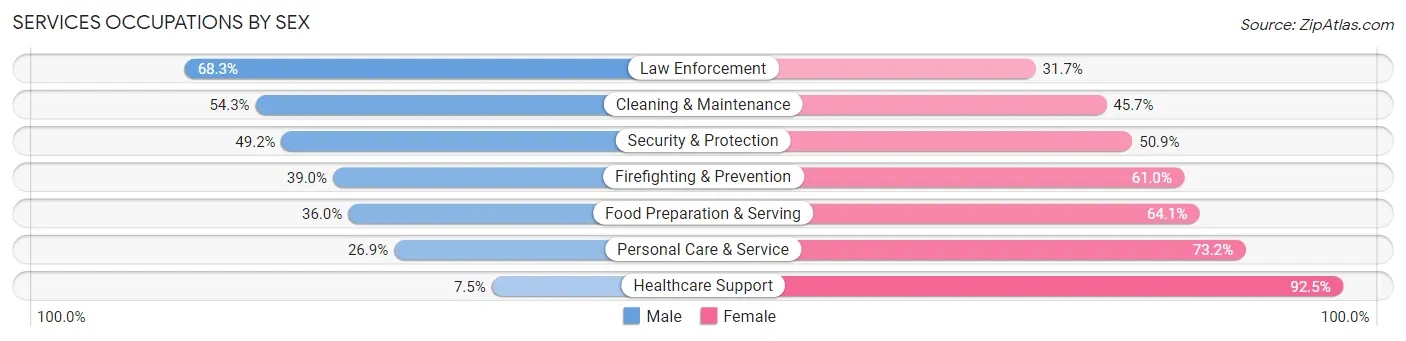
Services Occupations by Sex
Within the Services occupations in Ardmore, the most male-oriented occupations are Law Enforcement (68.3%), Cleaning & Maintenance (54.3%), and Security & Protection (49.1%), while the most female-oriented occupations are Healthcare Support (92.5%), Personal Care & Service (73.2%), and Food Preparation & Serving (64.0%).
| Occupation | Male | Female |
| Healthcare Support | 35 (7.5%) | 430 (92.5%) |
| Security & Protection | 58 (49.1%) | 60 (50.8%) |
| Firefighting & Prevention | 30 (39.0%) | 47 (61.0%) |
| Law Enforcement | 28 (68.3%) | 13 (31.7%) |
| Food Preparation & Serving | 211 (35.9%) | 376 (64.0%) |
| Cleaning & Maintenance | 342 (54.3%) | 288 (45.7%) |
| Personal Care & Service | 98 (26.9%) | 267 (73.2%) |
| Total (Category) | 744 (34.4%) | 1,421 (65.6%) |
| Total (Overall) | 5,711 (52.8%) | 5,111 (47.2%) |
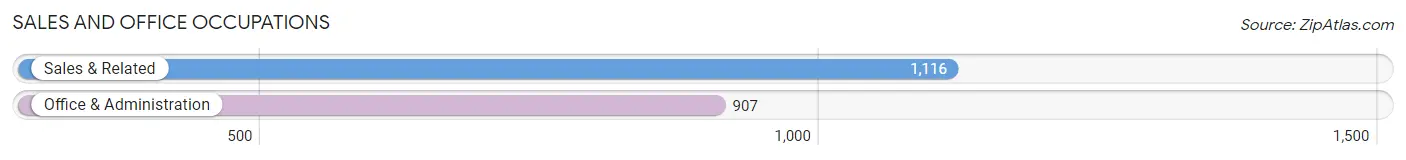
Sales and Office Occupations
The most common Sales and Office occupations in Ardmore are Sales & Related (1,116 | 10.3%), and Office & Administration (907 | 8.4%).
Sales and Office Occupations by Sex
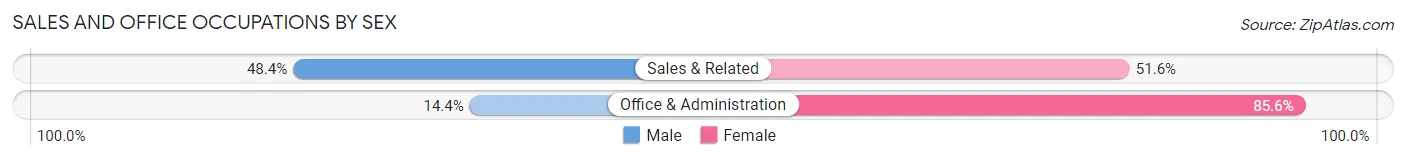
| Occupation | Male | Female |
| Sales & Related | 540 (48.4%) | 576 (51.6%) |
| Office & Administration | 131 (14.4%) | 776 (85.6%) |
| Total (Category) | 671 (33.2%) | 1,352 (66.8%) |
| Total (Overall) | 5,711 (52.8%) | 5,111 (47.2%) |
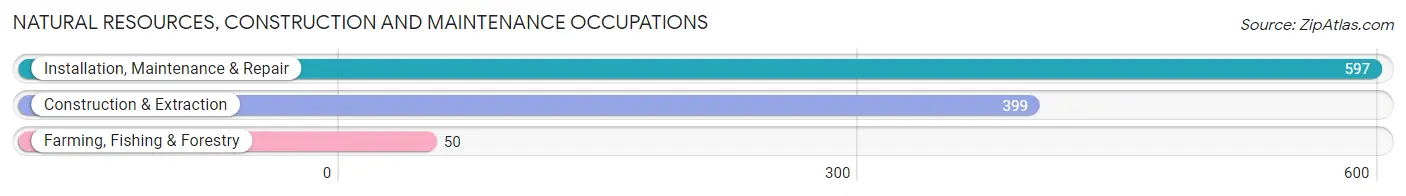
Natural Resources, Construction and Maintenance Occupations
The most common Natural Resources, Construction and Maintenance occupations in Ardmore are Installation, Maintenance & Repair (597 | 5.5%), Construction & Extraction (399 | 3.7%), and Farming, Fishing & Forestry (50 | 0.5%).
Natural Resources, Construction and Maintenance Occupations by Sex
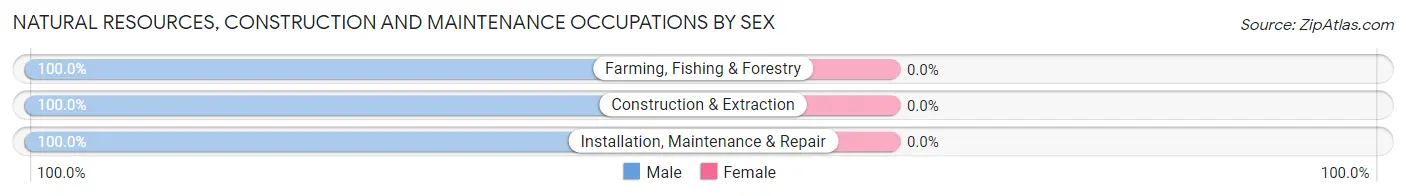
| Occupation | Male | Female |
| Farming, Fishing & Forestry | 50 (100.0%) | 0 (0.0%) |
| Construction & Extraction | 399 (100.0%) | 0 (0.0%) |
| Installation, Maintenance & Repair | 597 (100.0%) | 0 (0.0%) |
| Total (Category) | 1,046 (100.0%) | 0 (0.0%) |
| Total (Overall) | 5,711 (52.8%) | 5,111 (47.2%) |
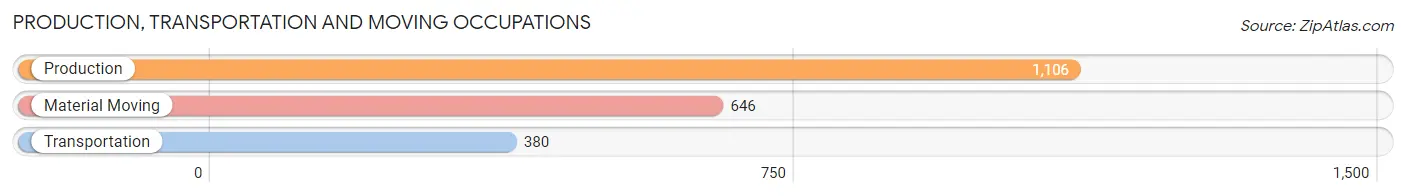
Production, Transportation and Moving Occupations
The most common Production, Transportation and Moving occupations in Ardmore are Production (1,106 | 10.2%), Material Moving (646 | 6.0%), and Transportation (380 | 3.5%).
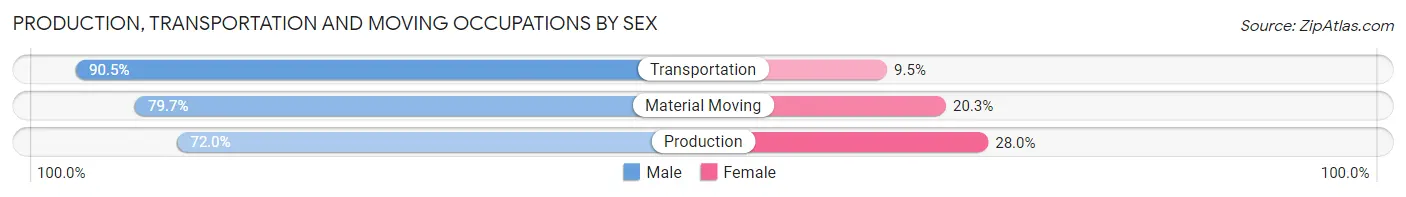
Production, Transportation and Moving Occupations by Sex
| Occupation | Male | Female |
| Production | 796 (72.0%) | 310 (28.0%) |
| Transportation | 344 (90.5%) | 36 (9.5%) |
| Material Moving | 515 (79.7%) | 131 (20.3%) |
| Total (Category) | 1,655 (77.6%) | 477 (22.4%) |
| Total (Overall) | 5,711 (52.8%) | 5,111 (47.2%) |
Employment Industries by Sex in Ardmore
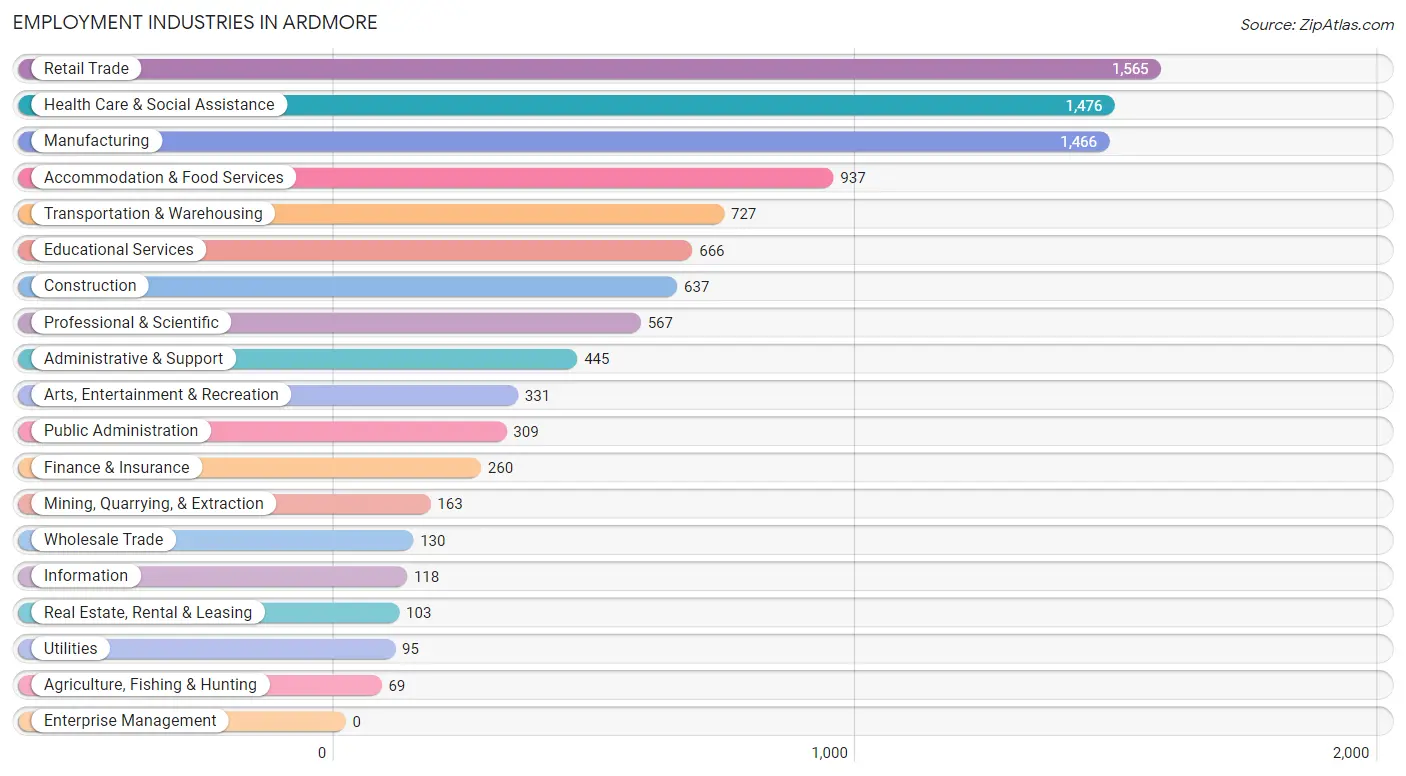
Employment Industries in Ardmore
The major employment industries in Ardmore include Retail Trade (1,565 | 14.5%), Health Care & Social Assistance (1,476 | 13.6%), Manufacturing (1,466 | 13.6%), Accommodation & Food Services (937 | 8.7%), and Transportation & Warehousing (727 | 6.7%).
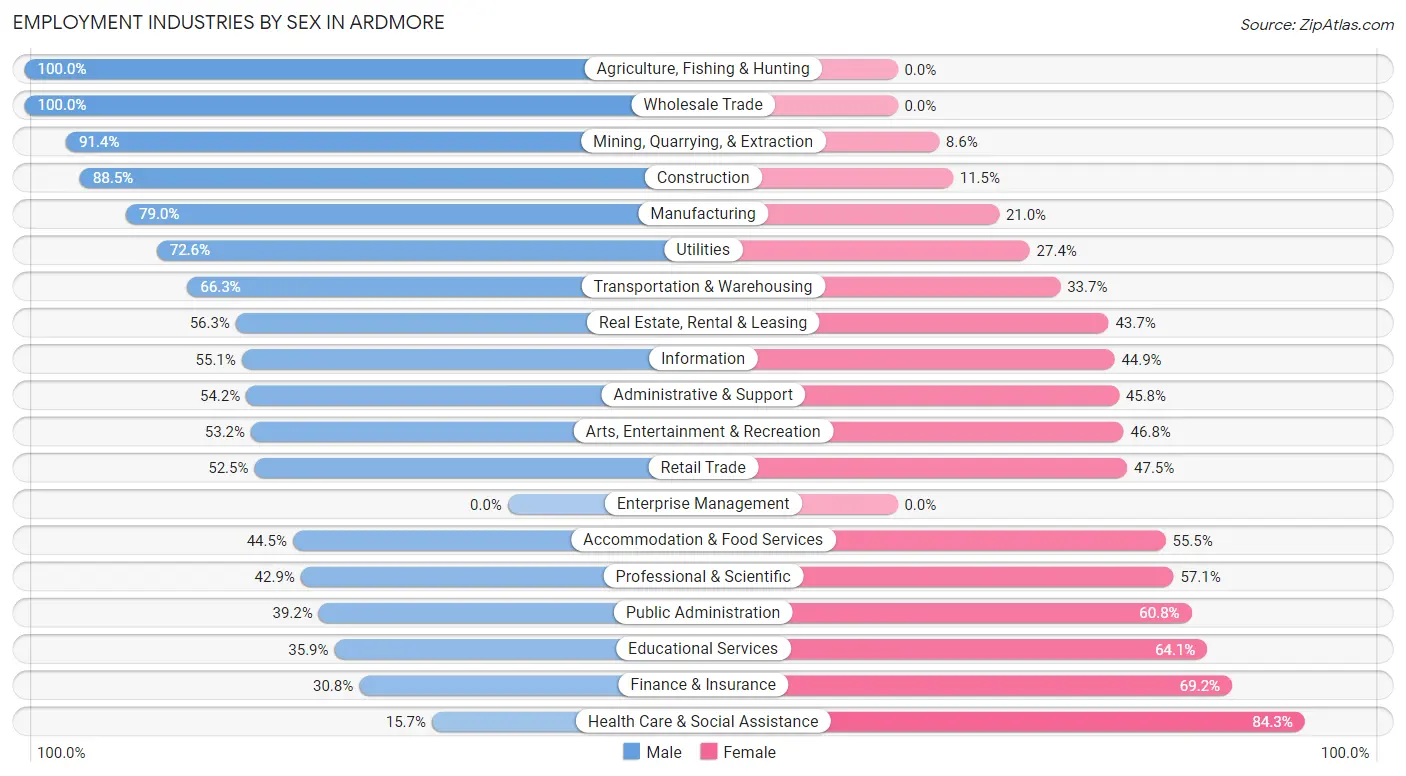
Employment Industries by Sex in Ardmore
The Ardmore industries that see more men than women are Agriculture, Fishing & Hunting (100.0%), Wholesale Trade (100.0%), and Mining, Quarrying, & Extraction (91.4%), whereas the industries that tend to have a higher number of women are Health Care & Social Assistance (84.3%), Finance & Insurance (69.2%), and Educational Services (64.1%).
| Industry | Male | Female |
| Agriculture, Fishing & Hunting | 69 (100.0%) | 0 (0.0%) |
| Mining, Quarrying, & Extraction | 149 (91.4%) | 14 (8.6%) |
| Construction | 564 (88.5%) | 73 (11.5%) |
| Manufacturing | 1,158 (79.0%) | 308 (21.0%) |
| Wholesale Trade | 130 (100.0%) | 0 (0.0%) |
| Retail Trade | 821 (52.5%) | 744 (47.5%) |
| Transportation & Warehousing | 482 (66.3%) | 245 (33.7%) |
| Utilities | 69 (72.6%) | 26 (27.4%) |
| Information | 65 (55.1%) | 53 (44.9%) |
| Finance & Insurance | 80 (30.8%) | 180 (69.2%) |
| Real Estate, Rental & Leasing | 58 (56.3%) | 45 (43.7%) |
| Professional & Scientific | 243 (42.9%) | 324 (57.1%) |
| Enterprise Management | 0 (0.0%) | 0 (0.0%) |
| Administrative & Support | 241 (54.2%) | 204 (45.8%) |
| Educational Services | 239 (35.9%) | 427 (64.1%) |
| Health Care & Social Assistance | 232 (15.7%) | 1,244 (84.3%) |
| Arts, Entertainment & Recreation | 176 (53.2%) | 155 (46.8%) |
| Accommodation & Food Services | 417 (44.5%) | 520 (55.5%) |
| Public Administration | 121 (39.2%) | 188 (60.8%) |
| Total | 5,711 (52.8%) | 5,111 (47.2%) |
Education in Ardmore
School Enrollment in Ardmore
The most common levels of schooling among the 5,662 students in Ardmore are middle school (1,476 | 26.1%), elementary school (1,393 | 24.6%), and high school (1,388 | 24.5%).
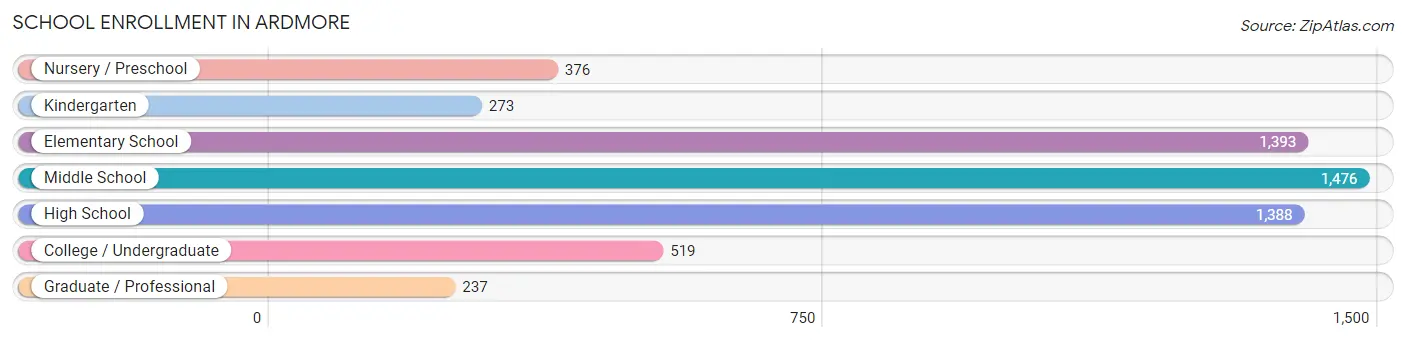
| School Level | # Students | % Students |
| Nursery / Preschool | 376 | 6.6% |
| Kindergarten | 273 | 4.8% |
| Elementary School | 1,393 | 24.6% |
| Middle School | 1,476 | 26.1% |
| High School | 1,388 | 24.5% |
| College / Undergraduate | 519 | 9.2% |
| Graduate / Professional | 237 | 4.2% |
| Total | 5,662 | 100.0% |
School Enrollment by Age by Funding Source in Ardmore
Out of a total of 5,662 students who are enrolled in schools in Ardmore, 640 (11.3%) attend a private institution, while the remaining 5,022 (88.7%) are enrolled in public schools. The age group of 3 to 4 year olds has the highest likelihood of being enrolled in private schools, with 134 (43.2% in the age bracket) enrolled. Conversely, the age group of 15 to 17 year olds has the lowest likelihood of being enrolled in a private school, with 1,055 (97.2% in the age bracket) attending a public institution.
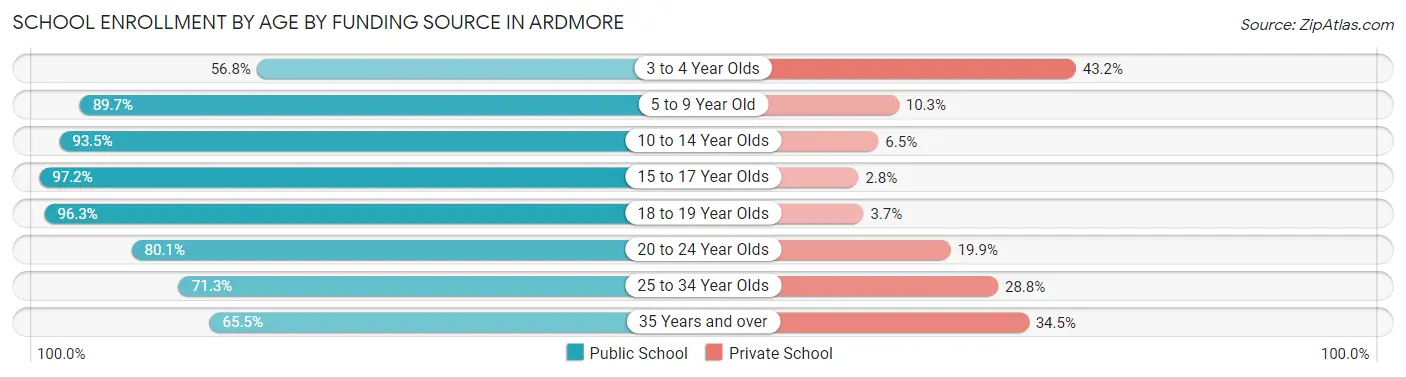
| Age Bracket | Public School | Private School |
| 3 to 4 Year Olds | 176 (56.8%) | 134 (43.2%) |
| 5 to 9 Year Old | 1,188 (89.7%) | 136 (10.3%) |
| 10 to 14 Year Olds | 1,821 (93.5%) | 126 (6.5%) |
| 15 to 17 Year Olds | 1,055 (97.2%) | 30 (2.8%) |
| 18 to 19 Year Olds | 234 (96.3%) | 9 (3.7%) |
| 20 to 24 Year Olds | 281 (80.1%) | 70 (19.9%) |
| 25 to 34 Year Olds | 57 (71.3%) | 23 (28.7%) |
| 35 Years and over | 211 (65.5%) | 111 (34.5%) |
| Total | 5,022 (88.7%) | 640 (11.3%) |
Educational Attainment by Field of Study in Ardmore
Business (697 | 18.4%), bio, nature & agricultural (477 | 12.6%), education (473 | 12.5%), science & technology (408 | 10.8%), and arts & humanities (333 | 8.8%) are the most common fields of study among 3,787 individuals in Ardmore who have obtained a bachelor's degree or higher.
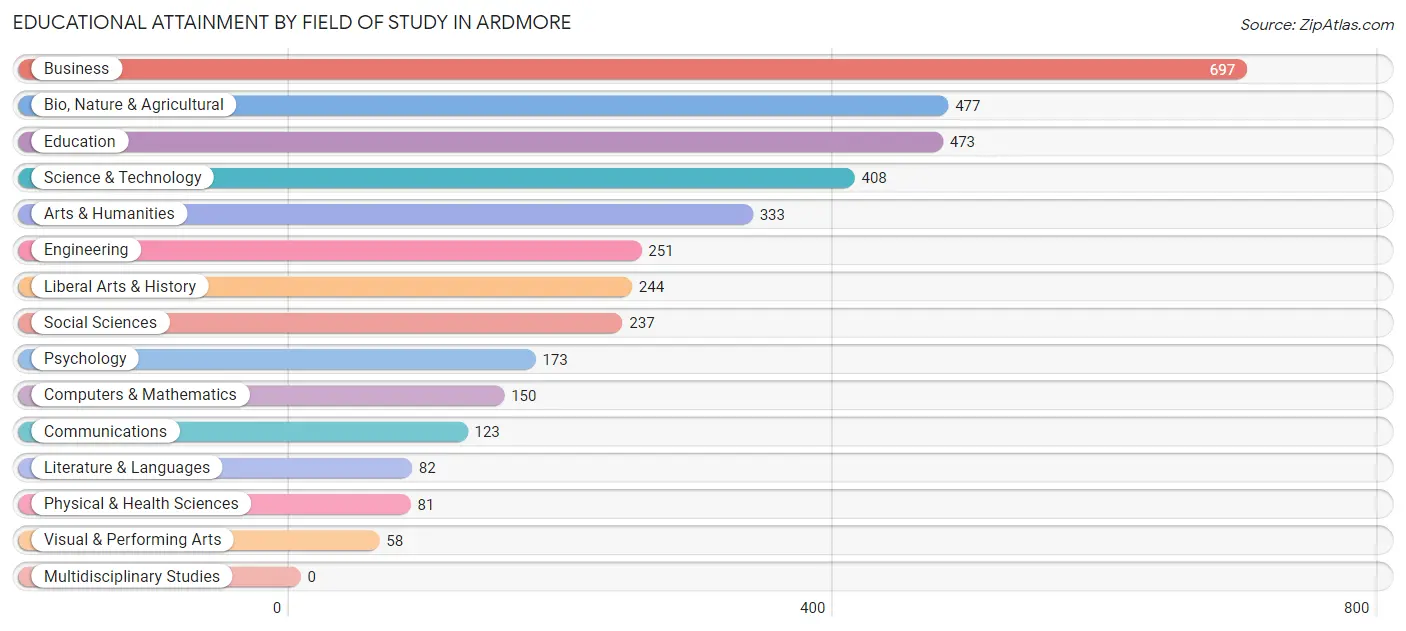
| Field of Study | # Graduates | % Graduates |
| Computers & Mathematics | 150 | 4.0% |
| Bio, Nature & Agricultural | 477 | 12.6% |
| Physical & Health Sciences | 81 | 2.1% |
| Psychology | 173 | 4.6% |
| Social Sciences | 237 | 6.3% |
| Engineering | 251 | 6.6% |
| Multidisciplinary Studies | 0 | 0.0% |
| Science & Technology | 408 | 10.8% |
| Business | 697 | 18.4% |
| Education | 473 | 12.5% |
| Literature & Languages | 82 | 2.2% |
| Liberal Arts & History | 244 | 6.4% |
| Visual & Performing Arts | 58 | 1.5% |
| Communications | 123 | 3.3% |
| Arts & Humanities | 333 | 8.8% |
| Total | 3,787 | 100.0% |
Transportation & Commute in Ardmore
Vehicle Availability by Sex in Ardmore
The most prevalent vehicle ownership categories in Ardmore are males with 2 vehicles (2,634, accounting for 46.9%) and females with 2 vehicles (2,022, making up 52.9%).
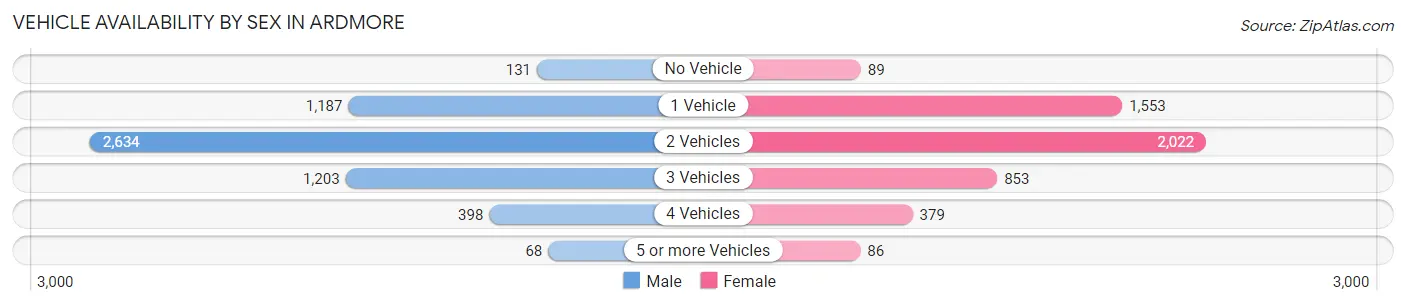
| Vehicles Available | Male | Female |
| No Vehicle | 131 (2.3%) | 89 (1.8%) |
| 1 Vehicle | 1,187 (21.1%) | 1,553 (31.2%) |
| 2 Vehicles | 2,634 (46.9%) | 2,022 (40.6%) |
| 3 Vehicles | 1,203 (21.4%) | 853 (17.1%) |
| 4 Vehicles | 398 (7.1%) | 379 (7.6%) |
| 5 or more Vehicles | 68 (1.2%) | 86 (1.7%) |
| Total | 5,621 (100.0%) | 4,982 (100.0%) |
Commute Time in Ardmore
The most frequently occuring commute durations in Ardmore are 5 to 9 minutes (3,134 commuters, 30.3%), 10 to 14 minutes (2,542 commuters, 24.6%), and 15 to 19 minutes (1,485 commuters, 14.3%).
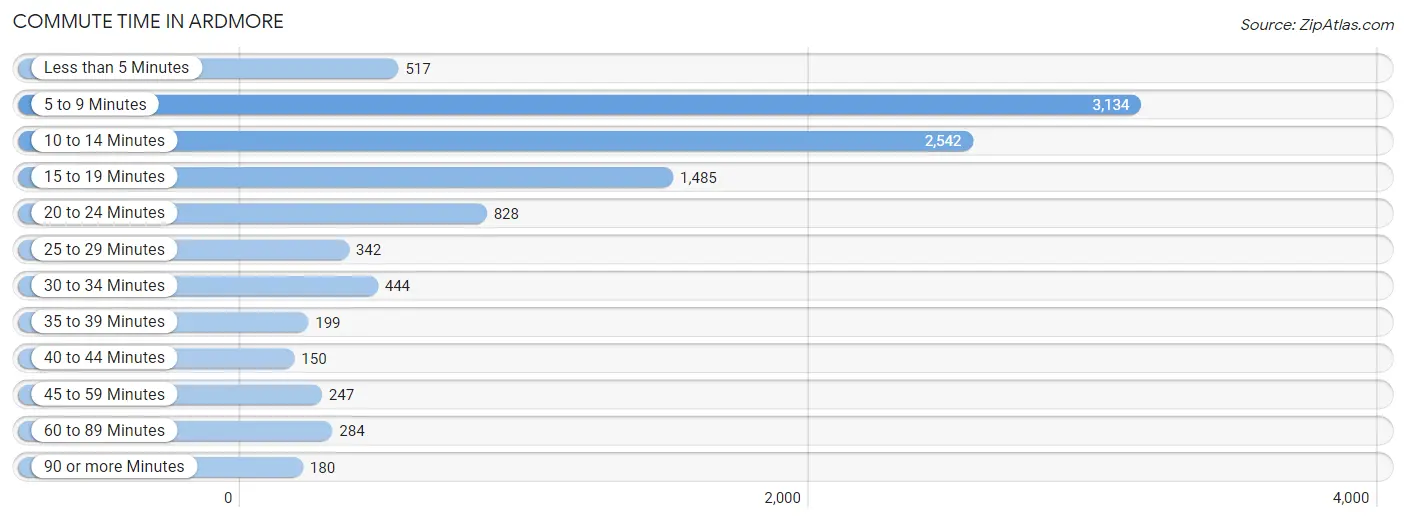
| Commute Time | # Commuters | % Commuters |
| Less than 5 Minutes | 517 | 5.0% |
| 5 to 9 Minutes | 3,134 | 30.3% |
| 10 to 14 Minutes | 2,542 | 24.6% |
| 15 to 19 Minutes | 1,485 | 14.3% |
| 20 to 24 Minutes | 828 | 8.0% |
| 25 to 29 Minutes | 342 | 3.3% |
| 30 to 34 Minutes | 444 | 4.3% |
| 35 to 39 Minutes | 199 | 1.9% |
| 40 to 44 Minutes | 150 | 1.5% |
| 45 to 59 Minutes | 247 | 2.4% |
| 60 to 89 Minutes | 284 | 2.7% |
| 90 or more Minutes | 180 | 1.7% |
Commute Time by Sex in Ardmore
The most common commute times in Ardmore are 5 to 9 minutes (1,429 commuters, 25.9%) for males and 5 to 9 minutes (1,705 commuters, 35.3%) for females.
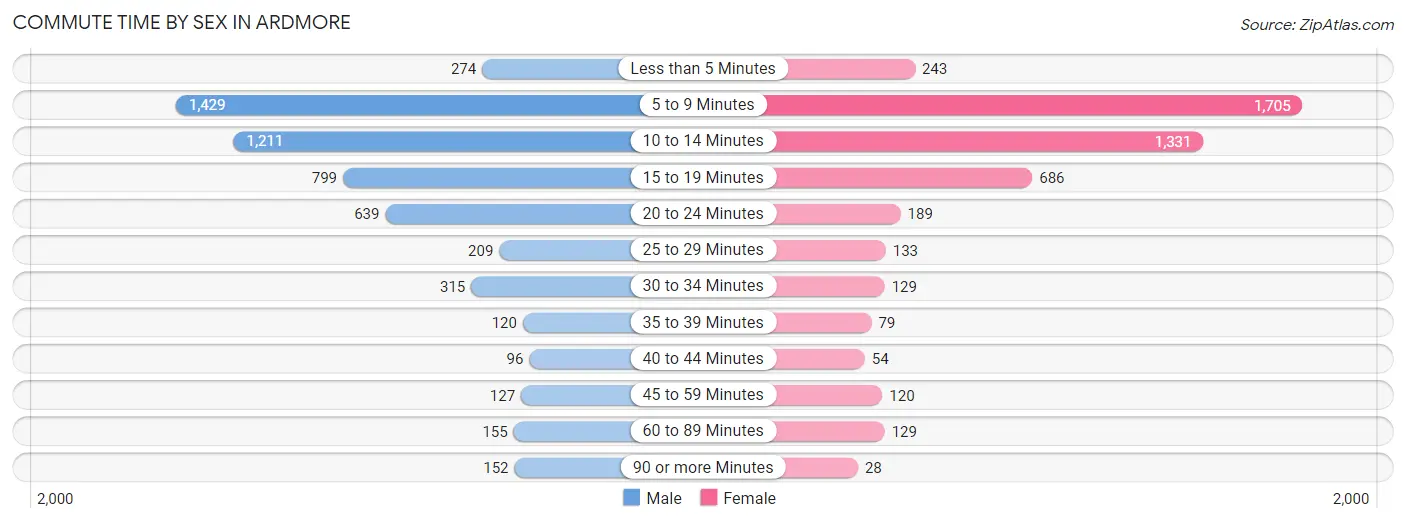
| Commute Time | Male | Female |
| Less than 5 Minutes | 274 (5.0%) | 243 (5.0%) |
| 5 to 9 Minutes | 1,429 (25.9%) | 1,705 (35.3%) |
| 10 to 14 Minutes | 1,211 (21.9%) | 1,331 (27.6%) |
| 15 to 19 Minutes | 799 (14.5%) | 686 (14.2%) |
| 20 to 24 Minutes | 639 (11.6%) | 189 (3.9%) |
| 25 to 29 Minutes | 209 (3.8%) | 133 (2.8%) |
| 30 to 34 Minutes | 315 (5.7%) | 129 (2.7%) |
| 35 to 39 Minutes | 120 (2.2%) | 79 (1.6%) |
| 40 to 44 Minutes | 96 (1.7%) | 54 (1.1%) |
| 45 to 59 Minutes | 127 (2.3%) | 120 (2.5%) |
| 60 to 89 Minutes | 155 (2.8%) | 129 (2.7%) |
| 90 or more Minutes | 152 (2.8%) | 28 (0.6%) |
Time of Departure to Work by Sex in Ardmore
The most frequent times of departure to work in Ardmore are 6:00 AM to 6:29 AM (704, 12.7%) for males and 7:30 AM to 7:59 AM (910, 18.9%) for females.
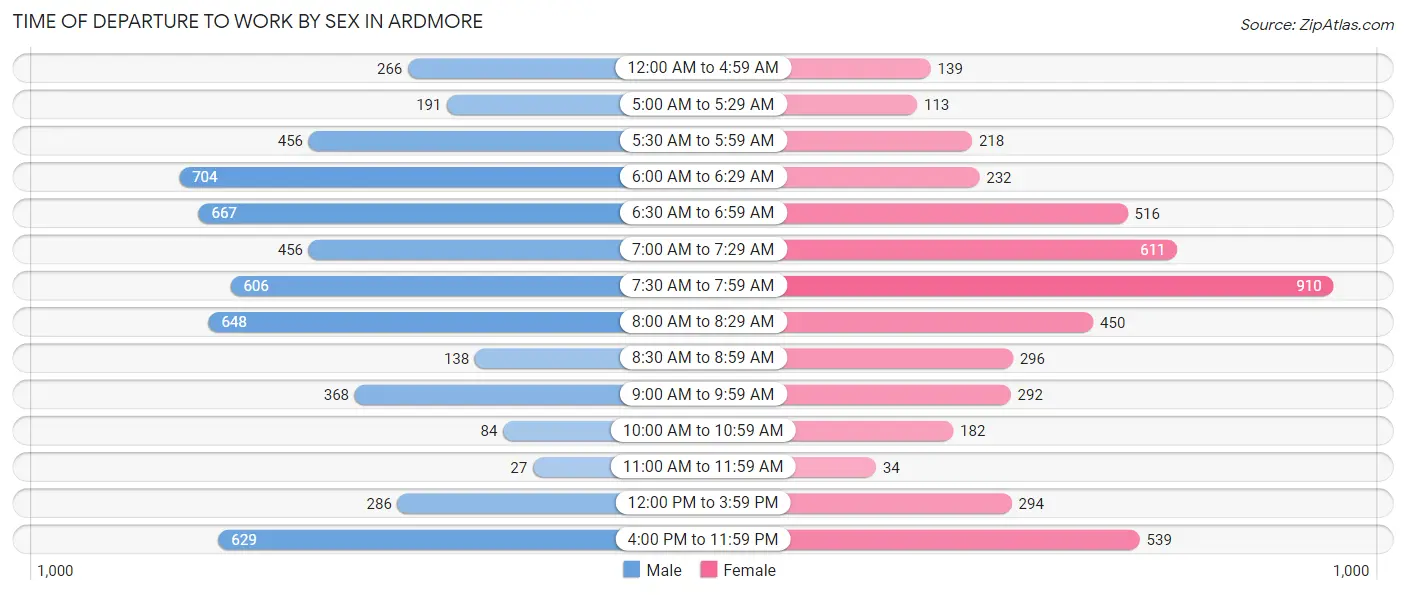
| Time of Departure | Male | Female |
| 12:00 AM to 4:59 AM | 266 (4.8%) | 139 (2.9%) |
| 5:00 AM to 5:29 AM | 191 (3.5%) | 113 (2.3%) |
| 5:30 AM to 5:59 AM | 456 (8.3%) | 218 (4.5%) |
| 6:00 AM to 6:29 AM | 704 (12.7%) | 232 (4.8%) |
| 6:30 AM to 6:59 AM | 667 (12.1%) | 516 (10.7%) |
| 7:00 AM to 7:29 AM | 456 (8.3%) | 611 (12.7%) |
| 7:30 AM to 7:59 AM | 606 (11.0%) | 910 (18.9%) |
| 8:00 AM to 8:29 AM | 648 (11.7%) | 450 (9.3%) |
| 8:30 AM to 8:59 AM | 138 (2.5%) | 296 (6.1%) |
| 9:00 AM to 9:59 AM | 368 (6.7%) | 292 (6.0%) |
| 10:00 AM to 10:59 AM | 84 (1.5%) | 182 (3.8%) |
| 11:00 AM to 11:59 AM | 27 (0.5%) | 34 (0.7%) |
| 12:00 PM to 3:59 PM | 286 (5.2%) | 294 (6.1%) |
| 4:00 PM to 11:59 PM | 629 (11.4%) | 539 (11.2%) |
| Total | 5,526 (100.0%) | 4,826 (100.0%) |
Housing Occupancy in Ardmore
Occupancy by Ownership in Ardmore
Of the total 9,722 dwellings in Ardmore, owner-occupied units account for 5,461 (56.2%), while renter-occupied units make up 4,261 (43.8%).
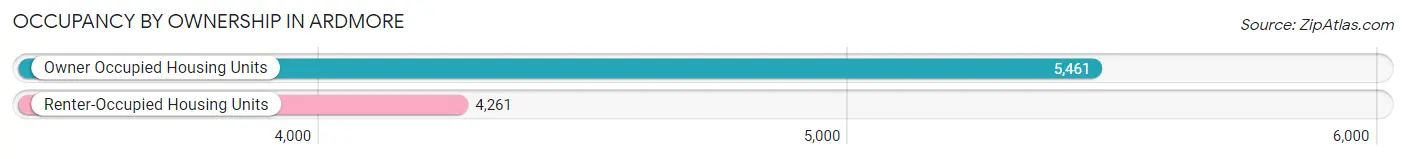
| Occupancy | # Housing Units | % Housing Units |
| Owner Occupied Housing Units | 5,461 | 56.2% |
| Renter-Occupied Housing Units | 4,261 | 43.8% |
| Total Occupied Housing Units | 9,722 | 100.0% |
Occupancy by Household Size in Ardmore
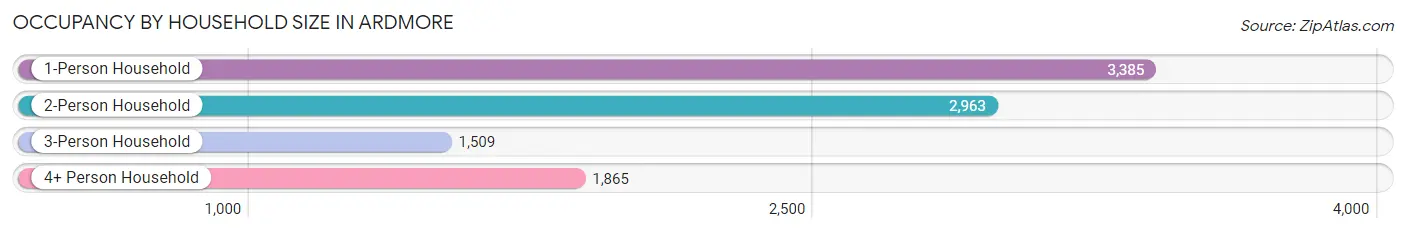
| Household Size | # Housing Units | % Housing Units |
| 1-Person Household | 3,385 | 34.8% |
| 2-Person Household | 2,963 | 30.5% |
| 3-Person Household | 1,509 | 15.5% |
| 4+ Person Household | 1,865 | 19.2% |
| Total Housing Units | 9,722 | 100.0% |
Occupancy by Ownership by Household Size in Ardmore
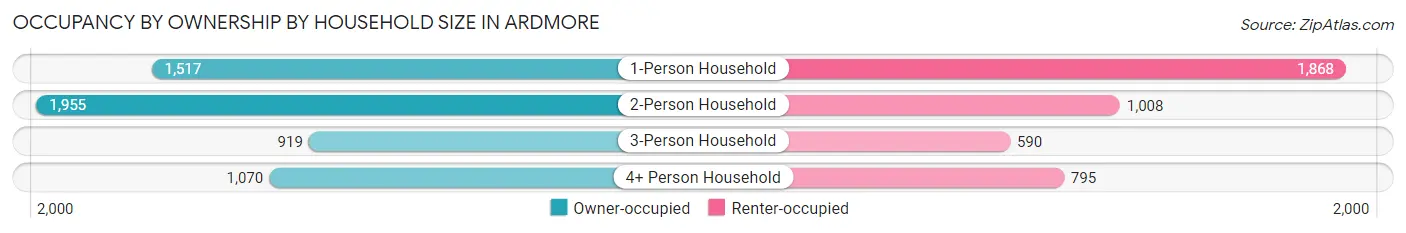
| Household Size | Owner-occupied | Renter-occupied |
| 1-Person Household | 1,517 (44.8%) | 1,868 (55.2%) |
| 2-Person Household | 1,955 (66.0%) | 1,008 (34.0%) |
| 3-Person Household | 919 (60.9%) | 590 (39.1%) |
| 4+ Person Household | 1,070 (57.4%) | 795 (42.6%) |
| Total Housing Units | 5,461 (56.2%) | 4,261 (43.8%) |
Occupancy by Educational Attainment in Ardmore
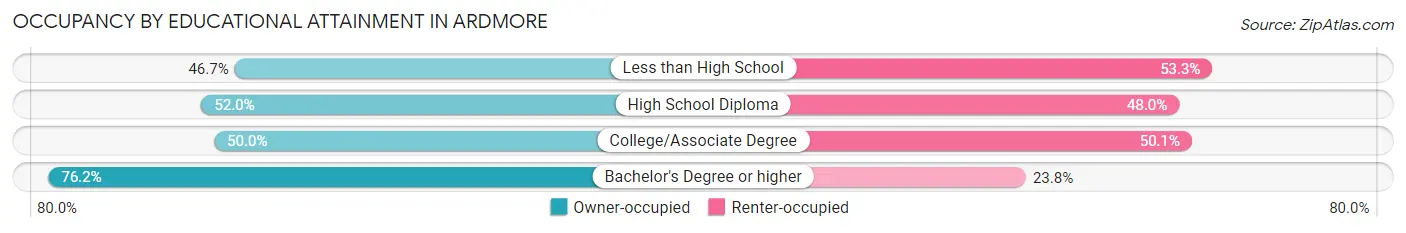
| Household Size | Owner-occupied | Renter-occupied |
| Less than High School | 596 (46.7%) | 680 (53.3%) |
| High School Diploma | 1,658 (52.0%) | 1,533 (48.0%) |
| College/Associate Degree | 1,519 (49.9%) | 1,522 (50.0%) |
| Bachelor's Degree or higher | 1,688 (76.2%) | 526 (23.8%) |
Occupancy by Age of Householder in Ardmore
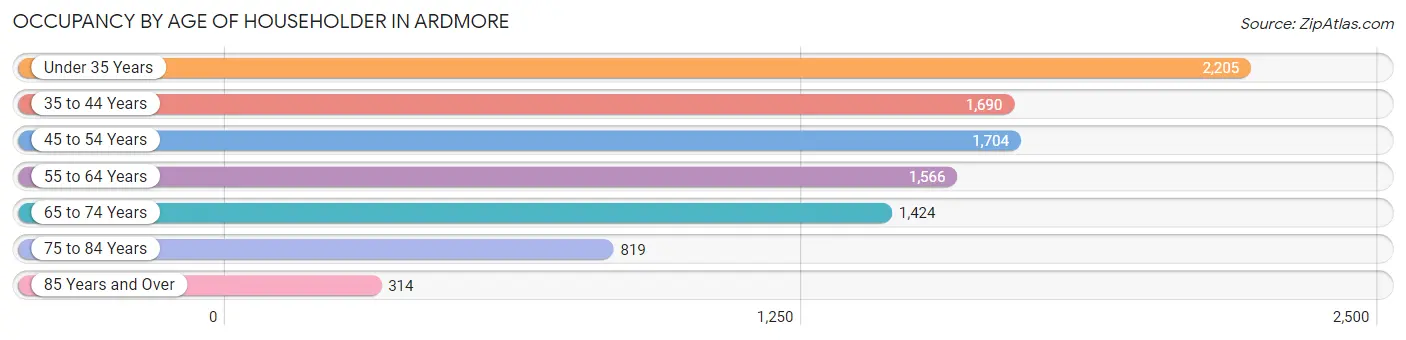
| Age Bracket | # Households | % Households |
| Under 35 Years | 2,205 | 22.7% |
| 35 to 44 Years | 1,690 | 17.4% |
| 45 to 54 Years | 1,704 | 17.5% |
| 55 to 64 Years | 1,566 | 16.1% |
| 65 to 74 Years | 1,424 | 14.6% |
| 75 to 84 Years | 819 | 8.4% |
| 85 Years and Over | 314 | 3.2% |
| Total | 9,722 | 100.0% |
Housing Finances in Ardmore
Median Income by Occupancy in Ardmore
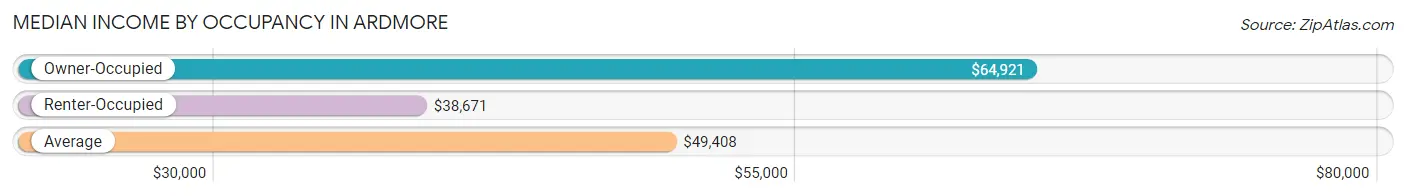
| Occupancy Type | # Households | Median Income |
| Owner-Occupied | 5,461 (56.2%) | $64,921 |
| Renter-Occupied | 4,261 (43.8%) | $38,671 |
| Average | 9,722 (100.0%) | $49,408 |
Occupancy by Householder Income Bracket in Ardmore
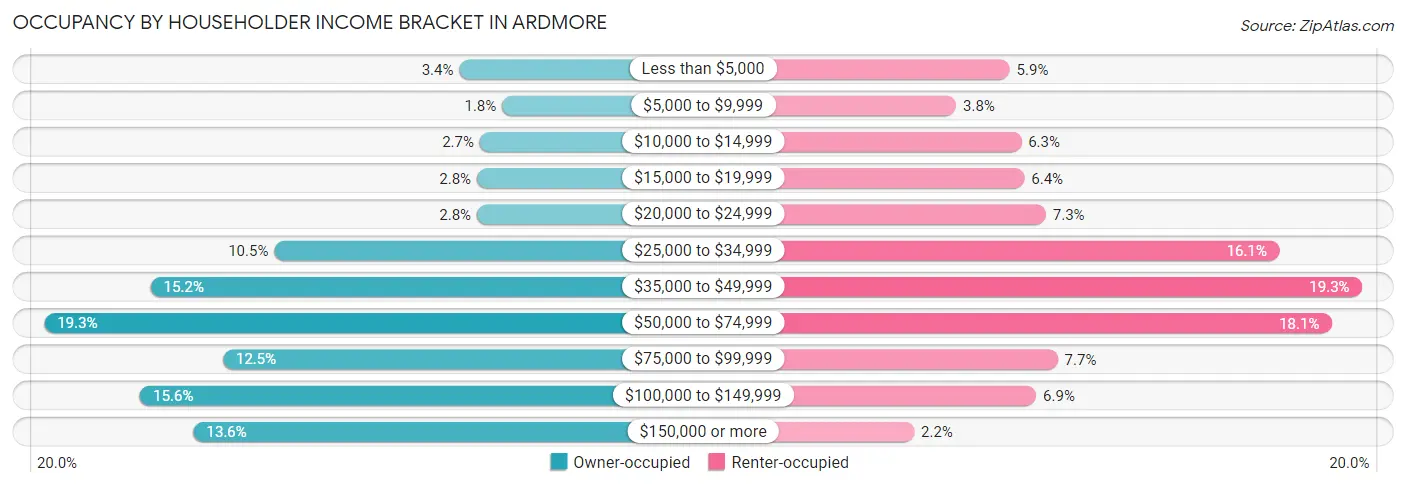
| Income Bracket | Owner-occupied | Renter-occupied |
| Less than $5,000 | 188 (3.4%) | 250 (5.9%) |
| $5,000 to $9,999 | 99 (1.8%) | 163 (3.8%) |
| $10,000 to $14,999 | 145 (2.7%) | 269 (6.3%) |
| $15,000 to $19,999 | 151 (2.8%) | 274 (6.4%) |
| $20,000 to $24,999 | 151 (2.8%) | 309 (7.2%) |
| $25,000 to $34,999 | 573 (10.5%) | 687 (16.1%) |
| $35,000 to $49,999 | 830 (15.2%) | 821 (19.3%) |
| $50,000 to $74,999 | 1,051 (19.3%) | 772 (18.1%) |
| $75,000 to $99,999 | 680 (12.4%) | 328 (7.7%) |
| $100,000 to $149,999 | 852 (15.6%) | 293 (6.9%) |
| $150,000 or more | 741 (13.6%) | 95 (2.2%) |
| Total | 5,461 (100.0%) | 4,261 (100.0%) |
Monthly Housing Cost Tiers in Ardmore
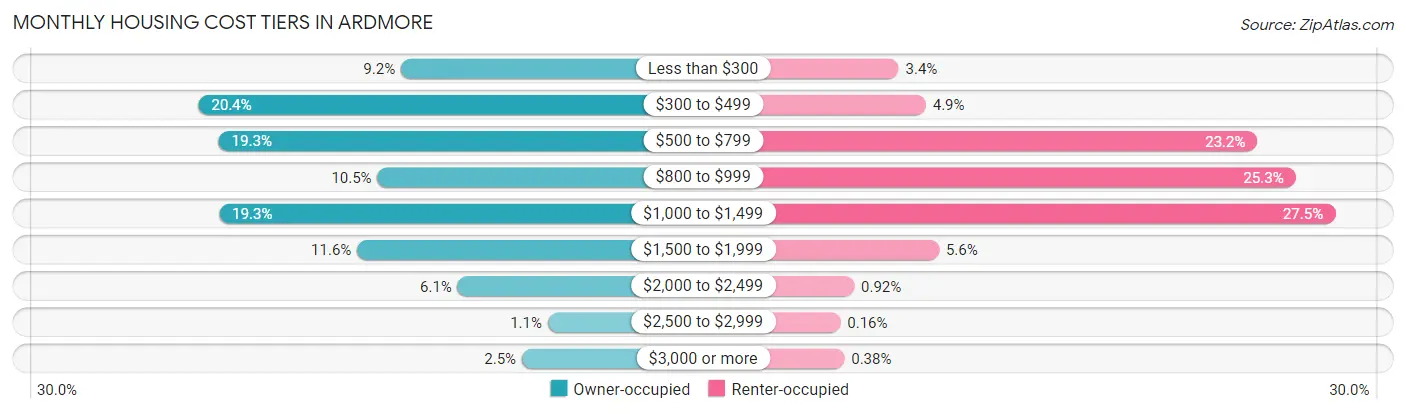
| Monthly Cost | Owner-occupied | Renter-occupied |
| Less than $300 | 503 (9.2%) | 144 (3.4%) |
| $300 to $499 | 1,114 (20.4%) | 208 (4.9%) |
| $500 to $799 | 1,053 (19.3%) | 988 (23.2%) |
| $800 to $999 | 574 (10.5%) | 1,078 (25.3%) |
| $1,000 to $1,499 | 1,052 (19.3%) | 1,171 (27.5%) |
| $1,500 to $1,999 | 635 (11.6%) | 239 (5.6%) |
| $2,000 to $2,499 | 332 (6.1%) | 39 (0.9%) |
| $2,500 to $2,999 | 60 (1.1%) | 7 (0.2%) |
| $3,000 or more | 138 (2.5%) | 16 (0.4%) |
| Total | 5,461 (100.0%) | 4,261 (100.0%) |
Physical Housing Characteristics in Ardmore
Housing Structures in Ardmore
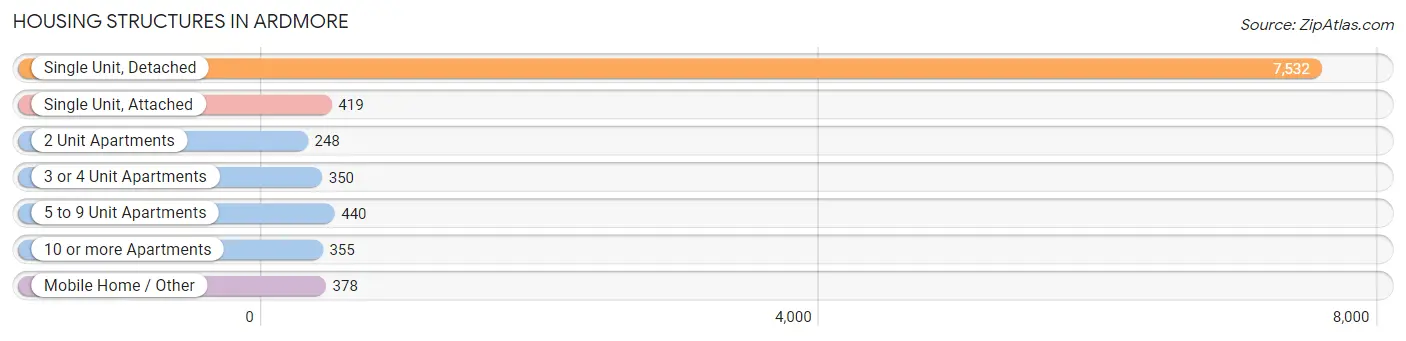
| Structure Type | # Housing Units | % Housing Units |
| Single Unit, Detached | 7,532 | 77.5% |
| Single Unit, Attached | 419 | 4.3% |
| 2 Unit Apartments | 248 | 2.5% |
| 3 or 4 Unit Apartments | 350 | 3.6% |
| 5 to 9 Unit Apartments | 440 | 4.5% |
| 10 or more Apartments | 355 | 3.6% |
| Mobile Home / Other | 378 | 3.9% |
| Total | 9,722 | 100.0% |
Housing Structures by Occupancy in Ardmore
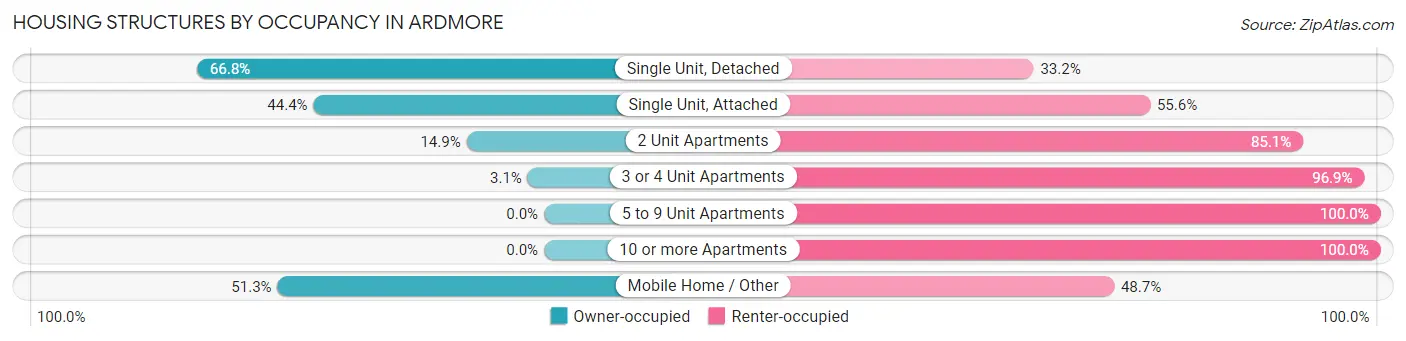
| Structure Type | Owner-occupied | Renter-occupied |
| Single Unit, Detached | 5,033 (66.8%) | 2,499 (33.2%) |
| Single Unit, Attached | 186 (44.4%) | 233 (55.6%) |
| 2 Unit Apartments | 37 (14.9%) | 211 (85.1%) |
| 3 or 4 Unit Apartments | 11 (3.1%) | 339 (96.9%) |
| 5 to 9 Unit Apartments | 0 (0.0%) | 440 (100.0%) |
| 10 or more Apartments | 0 (0.0%) | 355 (100.0%) |
| Mobile Home / Other | 194 (51.3%) | 184 (48.7%) |
| Total | 5,461 (56.2%) | 4,261 (43.8%) |
Housing Structures by Number of Rooms in Ardmore
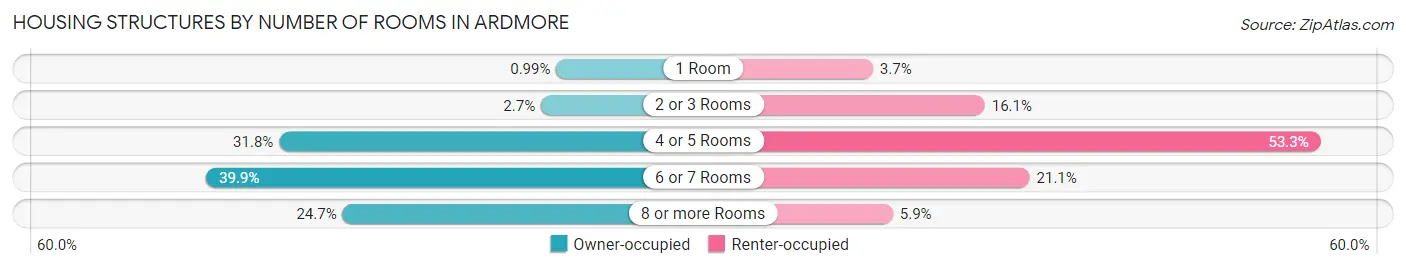
| Number of Rooms | Owner-occupied | Renter-occupied |
| 1 Room | 54 (1.0%) | 156 (3.7%) |
| 2 or 3 Rooms | 147 (2.7%) | 685 (16.1%) |
| 4 or 5 Rooms | 1,734 (31.8%) | 2,273 (53.3%) |
| 6 or 7 Rooms | 2,176 (39.9%) | 897 (21.0%) |
| 8 or more Rooms | 1,350 (24.7%) | 250 (5.9%) |
| Total | 5,461 (100.0%) | 4,261 (100.0%) |
Housing Structure by Heating Type in Ardmore
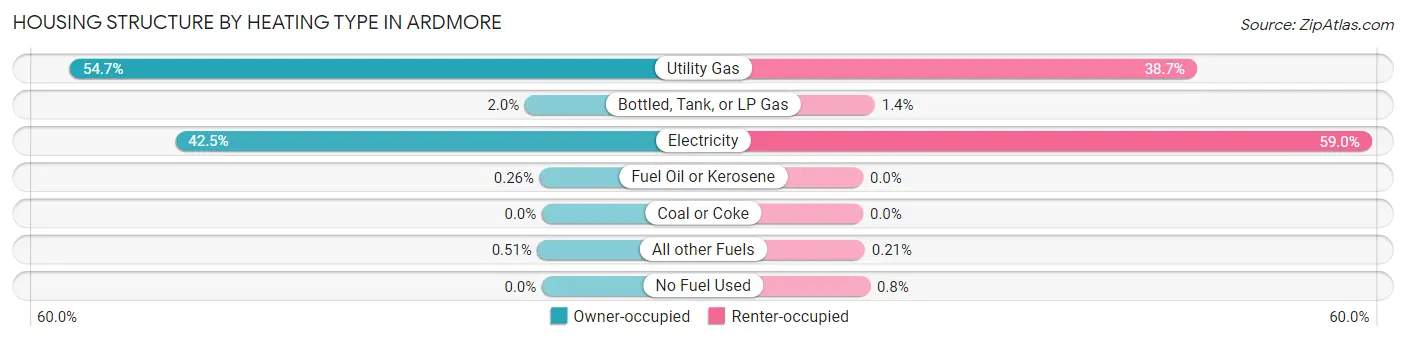
| Heating Type | Owner-occupied | Renter-occupied |
| Utility Gas | 2,989 (54.7%) | 1,648 (38.7%) |
| Bottled, Tank, or LP Gas | 108 (2.0%) | 58 (1.4%) |
| Electricity | 2,322 (42.5%) | 2,512 (59.0%) |
| Fuel Oil or Kerosene | 14 (0.3%) | 0 (0.0%) |
| Coal or Coke | 0 (0.0%) | 0 (0.0%) |
| All other Fuels | 28 (0.5%) | 9 (0.2%) |
| No Fuel Used | 0 (0.0%) | 34 (0.8%) |
| Total | 5,461 (100.0%) | 4,261 (100.0%) |
Household Vehicle Usage in Ardmore
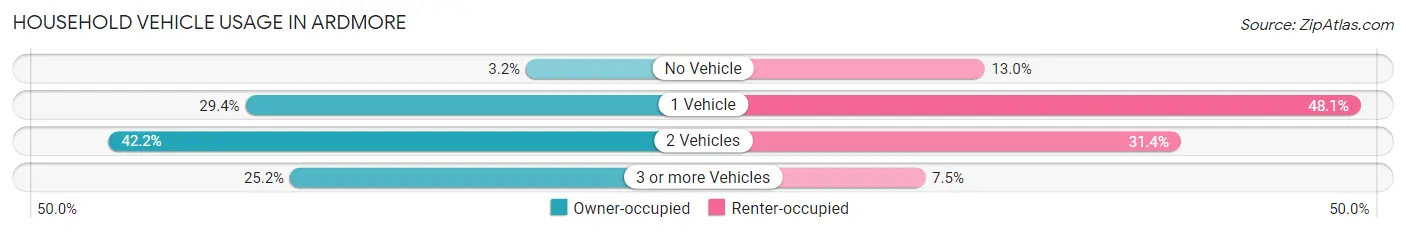
| Vehicles per Household | Owner-occupied | Renter-occupied |
| No Vehicle | 175 (3.2%) | 555 (13.0%) |
| 1 Vehicle | 1,605 (29.4%) | 2,051 (48.1%) |
| 2 Vehicles | 2,303 (42.2%) | 1,336 (31.4%) |
| 3 or more Vehicles | 1,378 (25.2%) | 319 (7.5%) |
| Total | 5,461 (100.0%) | 4,261 (100.0%) |
Real Estate & Mortgages in Ardmore
Real Estate and Mortgage Overview in Ardmore
| Characteristic | Without Mortgage | With Mortgage |
| Housing Units | 2,548 | 2,913 |
| Median Property Value | $114,600 | $181,300 |
| Median Household Income | $46,389 | $477 |
| Monthly Housing Costs | $449 | $138 |
| Real Estate Taxes | $1,070 | $163 |
Property Value by Mortgage Status in Ardmore
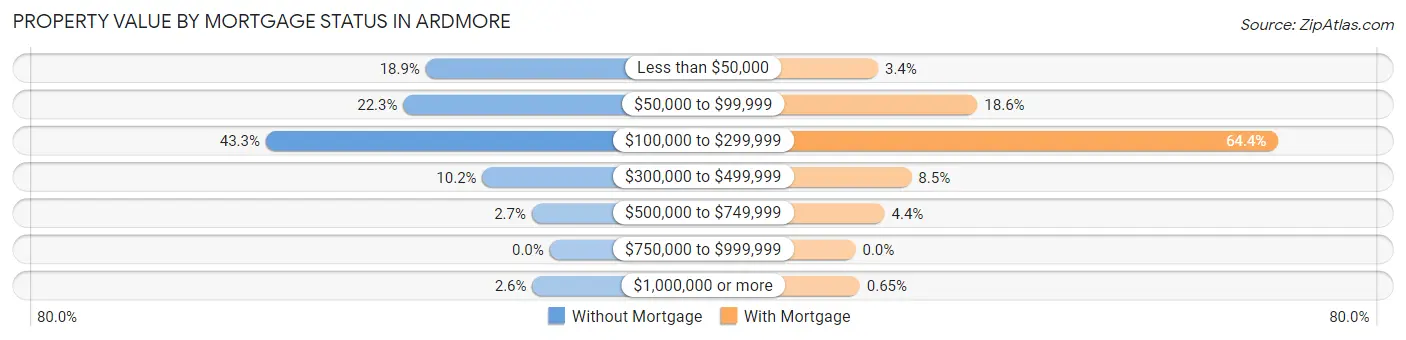
| Property Value | Without Mortgage | With Mortgage |
| Less than $50,000 | 481 (18.9%) | 100 (3.4%) |
| $50,000 to $99,999 | 568 (22.3%) | 541 (18.6%) |
| $100,000 to $299,999 | 1,102 (43.2%) | 1,876 (64.4%) |
| $300,000 to $499,999 | 261 (10.2%) | 248 (8.5%) |
| $500,000 to $749,999 | 69 (2.7%) | 129 (4.4%) |
| $750,000 to $999,999 | 0 (0.0%) | 0 (0.0%) |
| $1,000,000 or more | 67 (2.6%) | 19 (0.6%) |
| Total | 2,548 (100.0%) | 2,913 (100.0%) |
Household Income by Mortgage Status in Ardmore
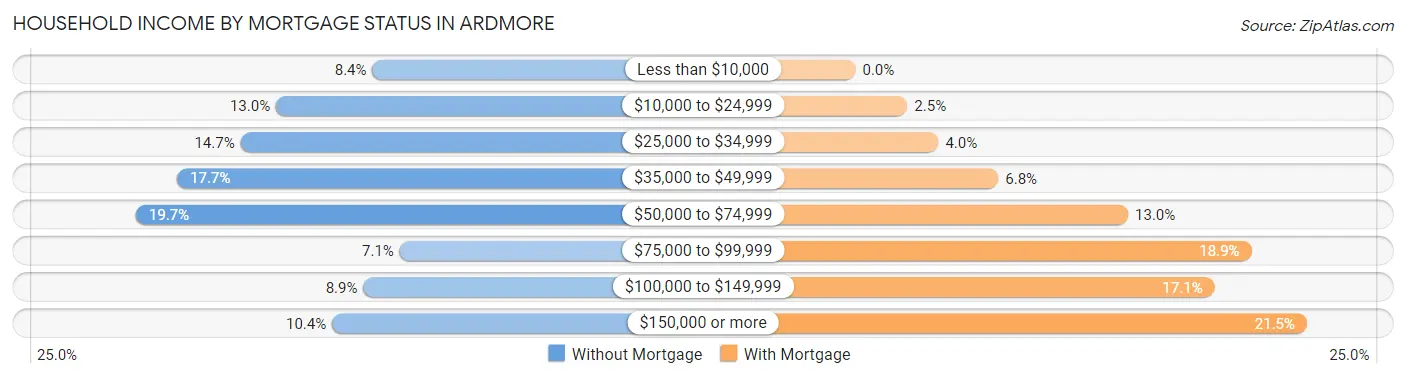
| Household Income | Without Mortgage | With Mortgage |
| Less than $10,000 | 215 (8.4%) | 0 (0.0%) |
| $10,000 to $24,999 | 332 (13.0%) | 72 (2.5%) |
| $25,000 to $34,999 | 375 (14.7%) | 115 (4.0%) |
| $35,000 to $49,999 | 452 (17.7%) | 198 (6.8%) |
| $50,000 to $74,999 | 502 (19.7%) | 378 (13.0%) |
| $75,000 to $99,999 | 182 (7.1%) | 549 (18.9%) |
| $100,000 to $149,999 | 226 (8.9%) | 498 (17.1%) |
| $150,000 or more | 264 (10.4%) | 626 (21.5%) |
| Total | 2,548 (100.0%) | 2,913 (100.0%) |
Property Value to Household Income Ratio in Ardmore
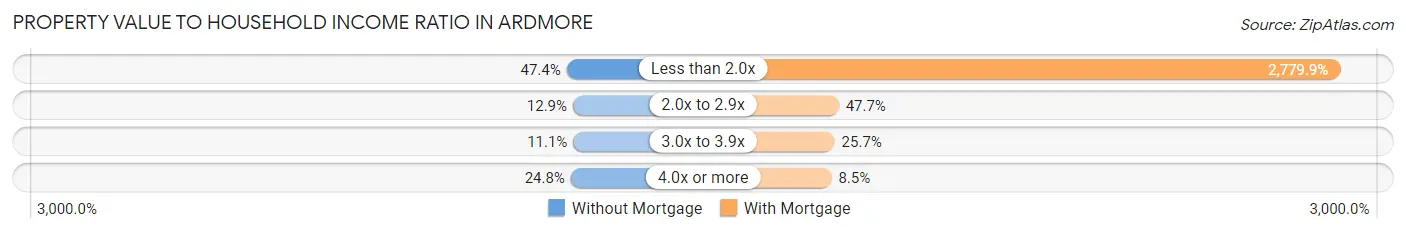
| Value-to-Income Ratio | Without Mortgage | With Mortgage |
| Less than 2.0x | 1,207 (47.4%) | 80,977 (2,779.9%) |
| 2.0x to 2.9x | 328 (12.9%) | 1,389 (47.7%) |
| 3.0x to 3.9x | 282 (11.1%) | 749 (25.7%) |
| 4.0x or more | 631 (24.8%) | 248 (8.5%) |
| Total | 2,548 (100.0%) | 2,913 (100.0%) |
Real Estate Taxes by Mortgage Status in Ardmore
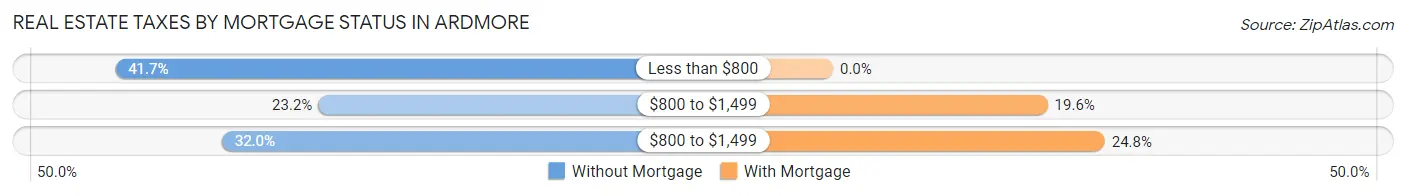
| Property Taxes | Without Mortgage | With Mortgage |
| Less than $800 | 1,063 (41.7%) | 0 (0.0%) |
| $800 to $1,499 | 591 (23.2%) | 571 (19.6%) |
| $800 to $1,499 | 815 (32.0%) | 723 (24.8%) |
| Total | 2,548 (100.0%) | 2,913 (100.0%) |
Health & Disability in Ardmore
Health Insurance Coverage by Age in Ardmore
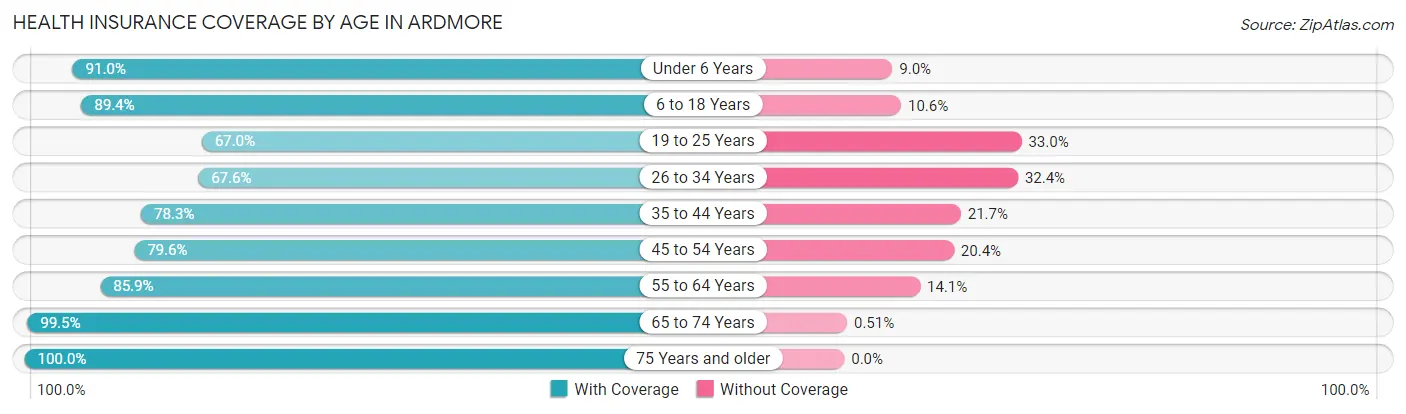
| Age Bracket | With Coverage | Without Coverage |
| Under 6 Years | 1,778 (91.0%) | 175 (9.0%) |
| 6 to 18 Years | 4,096 (89.4%) | 485 (10.6%) |
| 19 to 25 Years | 1,451 (67.0%) | 716 (33.0%) |
| 26 to 34 Years | 1,980 (67.6%) | 948 (32.4%) |
| 35 to 44 Years | 2,497 (78.3%) | 693 (21.7%) |
| 45 to 54 Years | 2,227 (79.6%) | 572 (20.4%) |
| 55 to 64 Years | 2,384 (85.9%) | 392 (14.1%) |
| 65 to 74 Years | 2,143 (99.5%) | 11 (0.5%) |
| 75 Years and older | 1,657 (100.0%) | 0 (0.0%) |
| Total | 20,213 (83.5%) | 3,992 (16.5%) |
Health Insurance Coverage by Citizenship Status in Ardmore
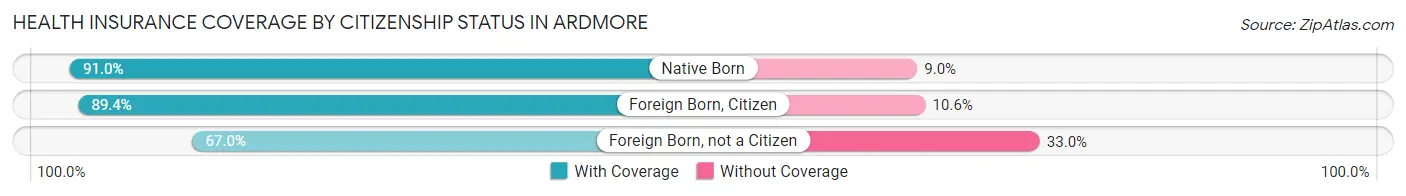
| Citizenship Status | With Coverage | Without Coverage |
| Native Born | 1,778 (91.0%) | 175 (9.0%) |
| Foreign Born, Citizen | 4,096 (89.4%) | 485 (10.6%) |
| Foreign Born, not a Citizen | 1,451 (67.0%) | 716 (33.0%) |
Health Insurance Coverage by Household Income in Ardmore
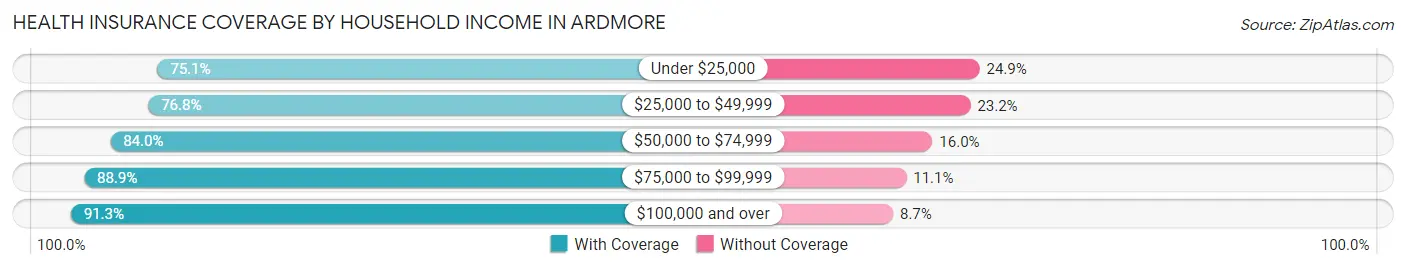
| Household Income | With Coverage | Without Coverage |
| Under $25,000 | 2,525 (75.1%) | 836 (24.9%) |
| $25,000 to $49,999 | 4,855 (76.8%) | 1,464 (23.2%) |
| $50,000 to $74,999 | 3,958 (84.0%) | 756 (16.0%) |
| $75,000 to $99,999 | 2,704 (88.9%) | 339 (11.1%) |
| $100,000 and over | 5,948 (91.3%) | 564 (8.7%) |
Public vs Private Health Insurance Coverage by Age in Ardmore
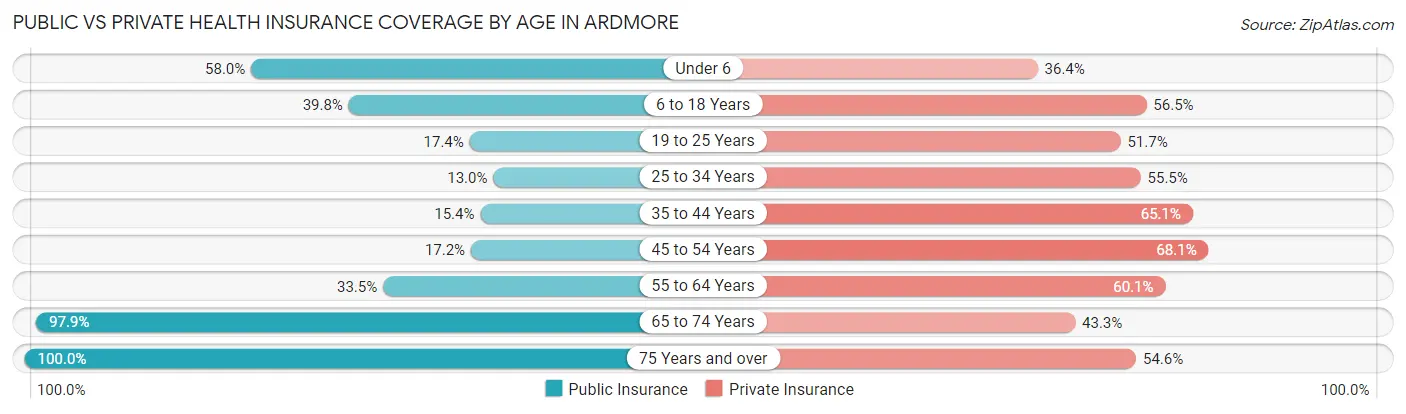
| Age Bracket | Public Insurance | Private Insurance |
| Under 6 | 1,132 (58.0%) | 710 (36.3%) |
| 6 to 18 Years | 1,825 (39.8%) | 2,590 (56.5%) |
| 19 to 25 Years | 377 (17.4%) | 1,121 (51.7%) |
| 25 to 34 Years | 381 (13.0%) | 1,624 (55.5%) |
| 35 to 44 Years | 492 (15.4%) | 2,078 (65.1%) |
| 45 to 54 Years | 480 (17.2%) | 1,905 (68.1%) |
| 55 to 64 Years | 929 (33.5%) | 1,667 (60.1%) |
| 65 to 74 Years | 2,108 (97.9%) | 933 (43.3%) |
| 75 Years and over | 1,657 (100.0%) | 905 (54.6%) |
| Total | 9,381 (38.8%) | 13,533 (55.9%) |
Disability Status by Sex by Age in Ardmore
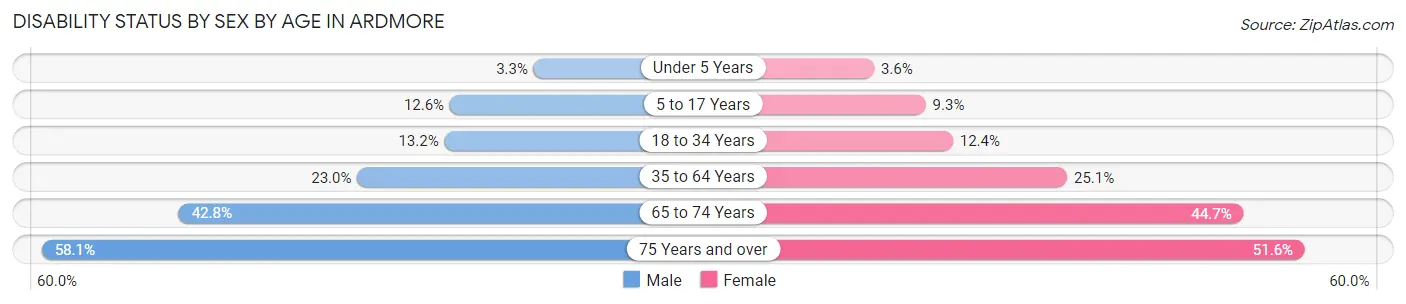
| Age Bracket | Male | Female |
| Under 5 Years | 30 (3.3%) | 29 (3.6%) |
| 5 to 17 Years | 289 (12.6%) | 212 (9.3%) |
| 18 to 34 Years | 345 (13.2%) | 339 (12.4%) |
| 35 to 64 Years | 975 (23.0%) | 1,133 (25.1%) |
| 65 to 74 Years | 418 (42.8%) | 527 (44.7%) |
| 75 Years and over | 298 (58.1%) | 590 (51.6%) |
Disability Class by Sex by Age in Ardmore
Disability Class: Hearing Difficulty
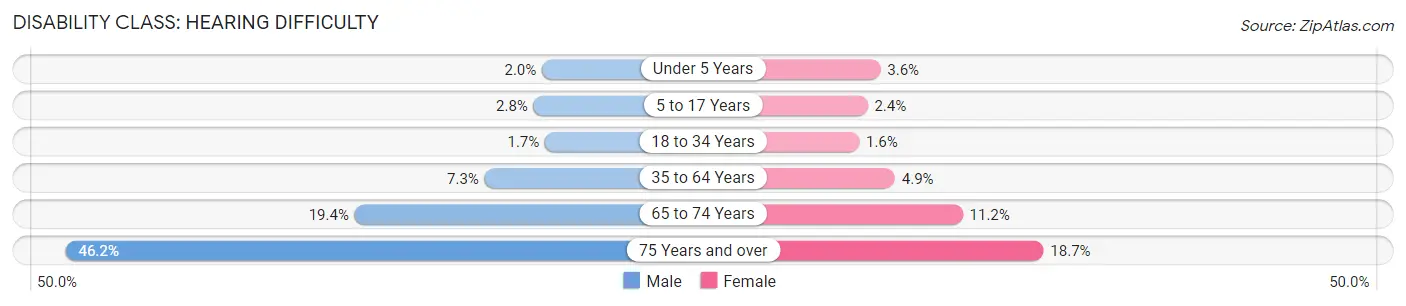
| Age Bracket | Male | Female |
| Under 5 Years | 18 (2.0%) | 29 (3.6%) |
| 5 to 17 Years | 63 (2.8%) | 54 (2.4%) |
| 18 to 34 Years | 44 (1.7%) | 44 (1.6%) |
| 35 to 64 Years | 310 (7.3%) | 222 (4.9%) |
| 65 to 74 Years | 189 (19.4%) | 132 (11.2%) |
| 75 Years and over | 237 (46.2%) | 214 (18.7%) |
Disability Class: Vision Difficulty
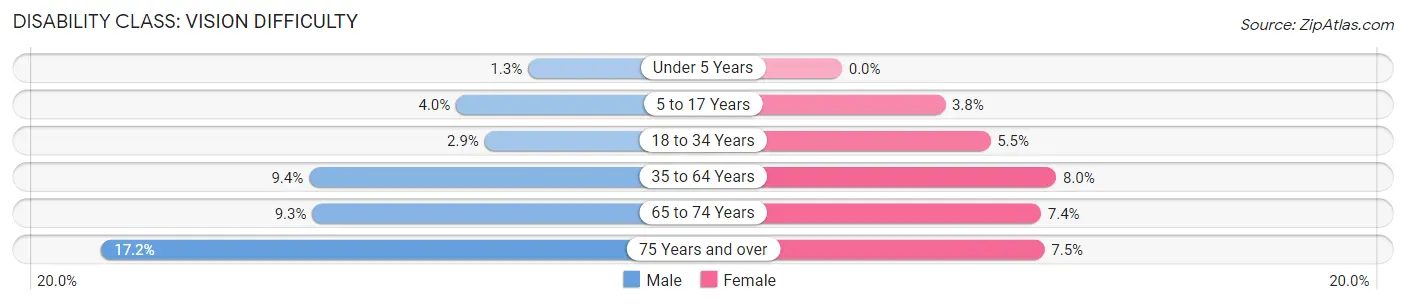
| Age Bracket | Male | Female |
| Under 5 Years | 12 (1.3%) | 0 (0.0%) |
| 5 to 17 Years | 91 (4.0%) | 87 (3.8%) |
| 18 to 34 Years | 76 (2.9%) | 151 (5.5%) |
| 35 to 64 Years | 401 (9.4%) | 359 (8.0%) |
| 65 to 74 Years | 91 (9.3%) | 87 (7.4%) |
| 75 Years and over | 88 (17.2%) | 86 (7.5%) |
Disability Class: Cognitive Difficulty
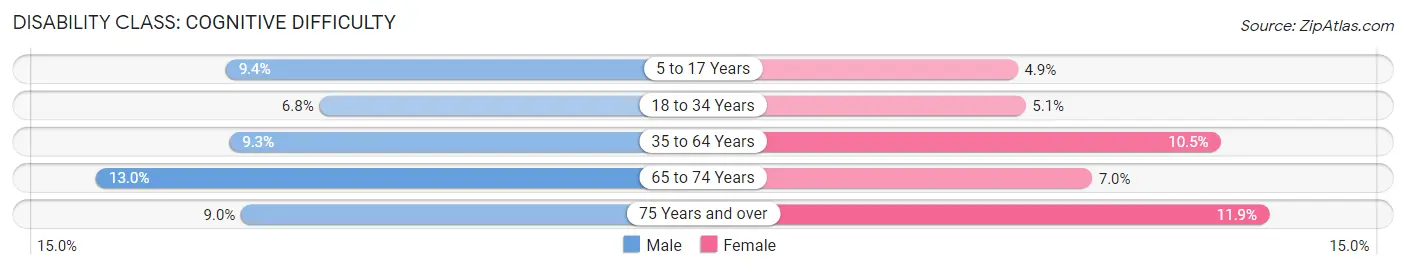
| Age Bracket | Male | Female |
| 5 to 17 Years | 215 (9.4%) | 111 (4.9%) |
| 18 to 34 Years | 177 (6.8%) | 140 (5.1%) |
| 35 to 64 Years | 395 (9.3%) | 476 (10.5%) |
| 65 to 74 Years | 127 (13.0%) | 82 (7.0%) |
| 75 Years and over | 46 (9.0%) | 136 (11.9%) |
Disability Class: Ambulatory Difficulty
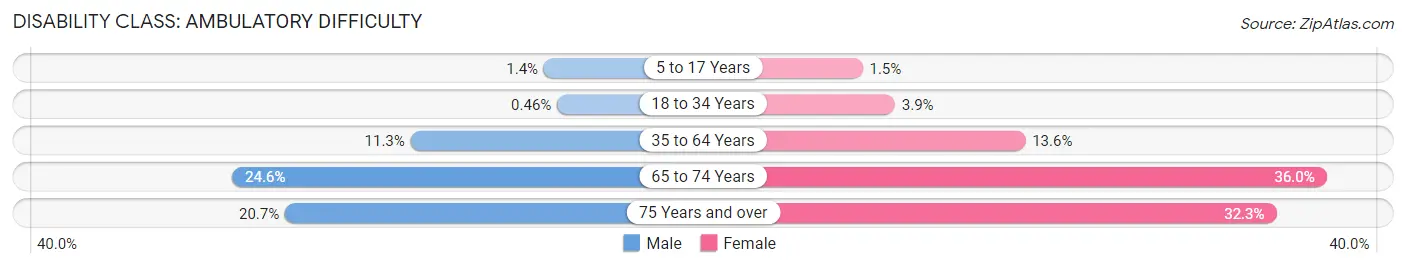
| Age Bracket | Male | Female |
| 5 to 17 Years | 33 (1.4%) | 35 (1.5%) |
| 18 to 34 Years | 12 (0.5%) | 108 (3.9%) |
| 35 to 64 Years | 482 (11.3%) | 615 (13.6%) |
| 65 to 74 Years | 240 (24.6%) | 424 (36.0%) |
| 75 Years and over | 106 (20.7%) | 369 (32.3%) |
Disability Class: Self-Care Difficulty
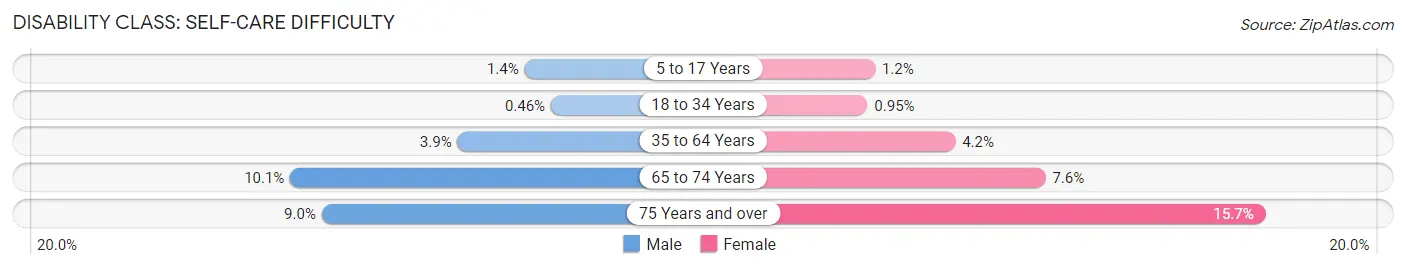
| Age Bracket | Male | Female |
| 5 to 17 Years | 33 (1.4%) | 28 (1.2%) |
| 18 to 34 Years | 12 (0.5%) | 26 (0.9%) |
| 35 to 64 Years | 167 (3.9%) | 190 (4.2%) |
| 65 to 74 Years | 99 (10.1%) | 89 (7.6%) |
| 75 Years and over | 46 (9.0%) | 180 (15.7%) |
Technology Access in Ardmore
Computing Device Access in Ardmore
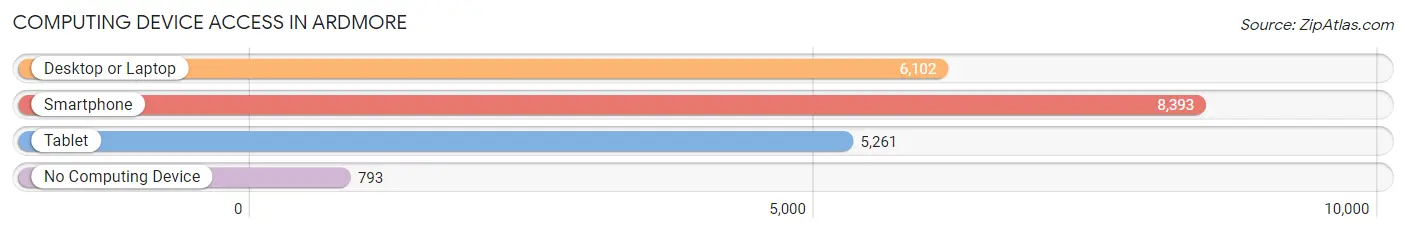
| Device Type | # Households | % Households |
| Desktop or Laptop | 6,102 | 62.8% |
| Smartphone | 8,393 | 86.3% |
| Tablet | 5,261 | 54.1% |
| No Computing Device | 793 | 8.2% |
| Total | 9,722 | 100.0% |
Internet Access in Ardmore
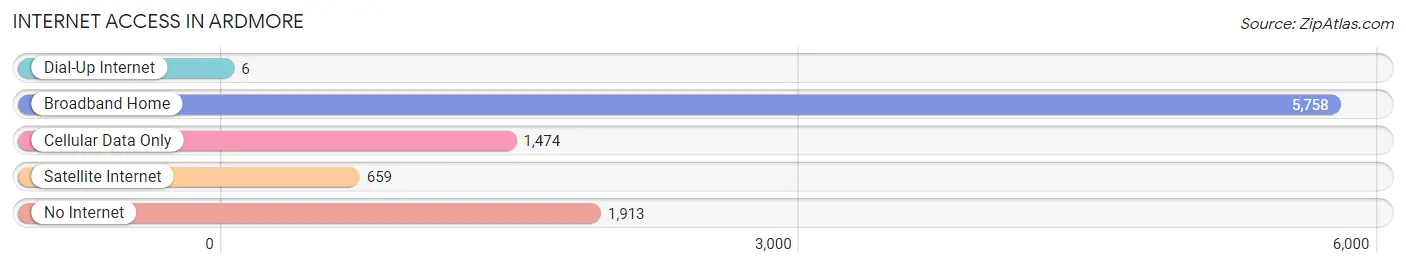
| Internet Type | # Households | % Households |
| Dial-Up Internet | 6 | 0.1% |
| Broadband Home | 5,758 | 59.2% |
| Cellular Data Only | 1,474 | 15.2% |
| Satellite Internet | 659 | 6.8% |
| No Internet | 1,913 | 19.7% |
| Total | 9,722 | 100.0% |
Ardmore Summary
Ardmore is a city located in the southern part of Oklahoma, United States. It is the county seat of Carter County and is situated along the Red River. The city has a population of 24,283 as of the 2010 census.
History
Ardmore was founded in 1887 by a group of settlers from the nearby town of Pickens. The town was named after the nearby Ardmore Station, which was named after the nearby Ardmore Plantation. The town was incorporated in 1891 and was designated as the county seat of Carter County in 1893.
In the early 1900s, Ardmore experienced a period of rapid growth due to the discovery of oil in the area. This led to the construction of several oil refineries and other businesses. The city also became a major center for the cotton industry.
In the 1920s, Ardmore was a major stop on the famous Route 66. The city was also home to the first drive-in theater in the state of Oklahoma.
Geography
Ardmore is located in the southern part of Oklahoma, approximately 90 miles south of Oklahoma City. It is situated along the Red River, which forms the border between Oklahoma and Texas. The city has a total area of 24.3 square miles, of which 24.2 square miles is land and 0.1 square miles is water.
The city is located in a region known as the Arbuckle Mountains, which is a range of low mountains located in south-central Oklahoma. The city is also located near Lake Murray, a large reservoir located in the Arbuckle Mountains.
Economy
Ardmore is a major center for the oil and gas industry. The city is home to several oil refineries and other related businesses. The city is also home to several manufacturing companies, including a large paper mill.
The city is also a major center for the cotton industry. The city is home to several cotton gins and other related businesses.
The city is also home to several retail stores, restaurants, and other businesses. The city is also home to several hotels and other tourist attractions.
Demographics
As of the 2010 census, Ardmore had a population of 24,283. The racial makeup of the city was 75.3% White, 15.2% African American, 0.7% Native American, 0.7% Asian, 0.1% Pacific Islander, 5.2% from other races, and 2.9% from two or more races. Hispanic or Latino of any race were 10.3% of the population.
The median income for a household in the city was $35,945, and the median income for a family was $41,945. The per capita income for the city was $19,945. About 17.2% of families and 20.3% of the population were below the poverty line, including 28.3% of those under age 18 and 11.2% of those age 65 or over.
Common Questions
What is Per Capita Income in Ardmore?
Per Capita income in Ardmore is $28,997.
What is the Median Family Income in Ardmore?
Median Family Income in Ardmore is $66,752.
What is the Median Household income in Ardmore?
Median Household Income in Ardmore is $49,408.
What is Income or Wage Gap in Ardmore?
Income or Wage Gap in Ardmore is 33.3%.
Women in Ardmore earn 66.7 cents for every dollar earned by a man.
What is Family Income Deficit in Ardmore?
Family Income Deficit in Ardmore is $10,894.
Families that are below poverty line in Ardmore earn $10,894 less on average than the poverty threshold level.
What is Inequality or Gini Index in Ardmore?
Inequality or Gini Index in Ardmore is 0.47.
What is the Total Population of Ardmore?
Total Population of Ardmore is 24,784.
What is the Total Male Population of Ardmore?
Total Male Population of Ardmore is 11,950.
What is the Total Female Population of Ardmore?
Total Female Population of Ardmore is 12,834.
What is the Ratio of Males per 100 Females in Ardmore?
There are 93.11 Males per 100 Females in Ardmore.
What is the Ratio of Females per 100 Males in Ardmore?
There are 107.40 Females per 100 Males in Ardmore.
What is the Median Population Age in Ardmore?
Median Population Age in Ardmore is 37.3 Years.
What is the Average Family Size in Ardmore
Average Family Size in Ardmore is 3.2 People.
What is the Average Household Size in Ardmore
Average Household Size in Ardmore is 2.5 People.
How Large is the Labor Force in Ardmore?
There are 11,404 People in the Labor Forcein in Ardmore.
What is the Percentage of People in the Labor Force in Ardmore?
59.6% of People are in the Labor Force in Ardmore.
What is the Unemployment Rate in Ardmore?
Unemployment Rate in Ardmore is 5.2%.