Zip Codes with the Highest Percentage of Population Employed in Food Preparation & Serving in Toledo, OH
RELATED REPORTS & OPTIONS
Food Preparation & Serving
Toledo
Compare Zip Codes
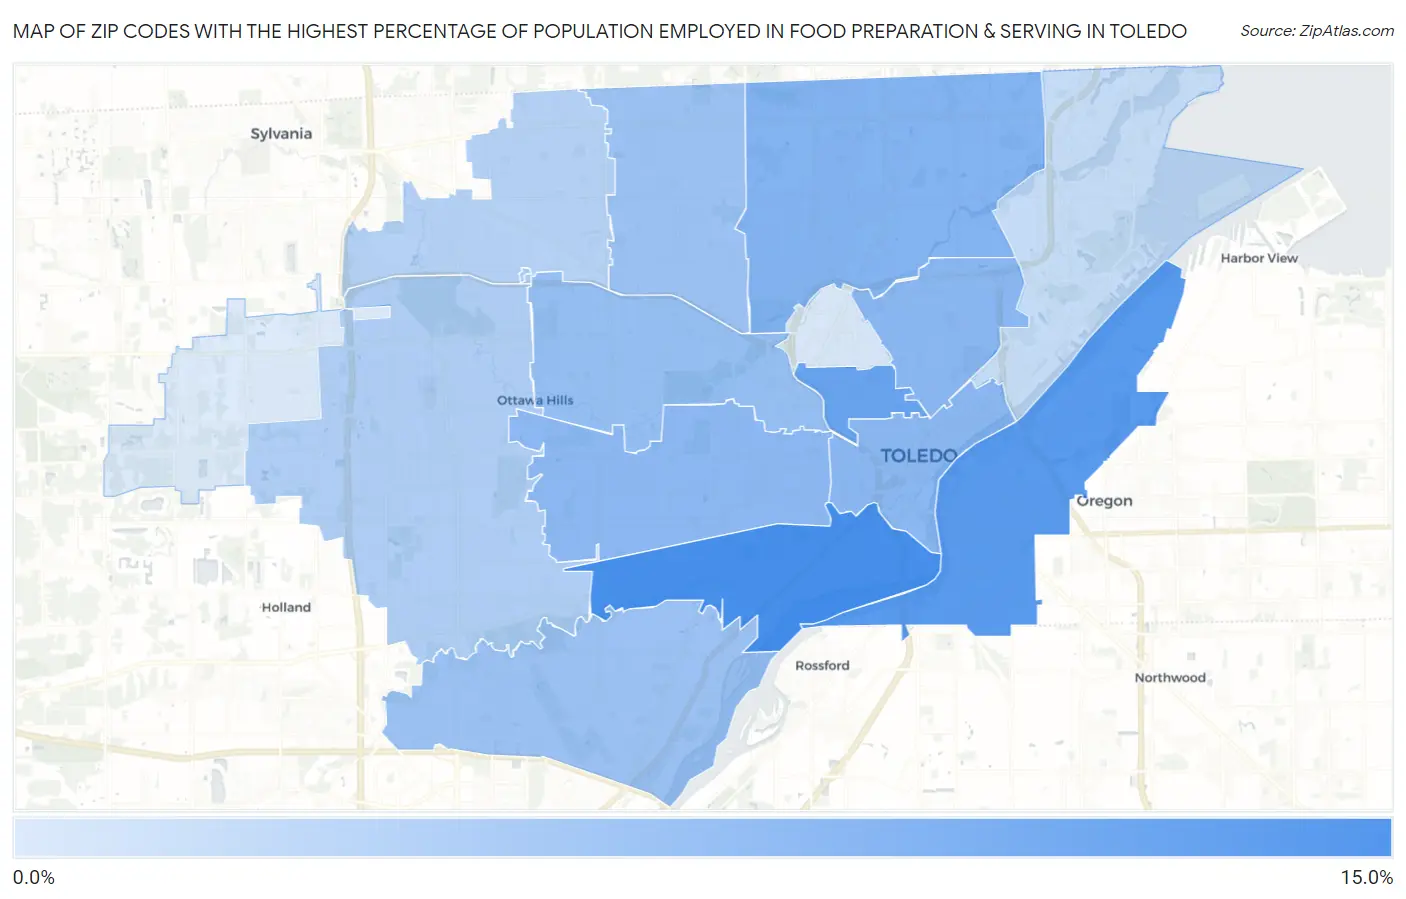
Map of Zip Codes with the Highest Percentage of Population Employed in Food Preparation & Serving in Toledo
2.7%
10.8%
Zip Codes with the Highest Percentage of Population Employed in Food Preparation & Serving in Toledo, OH
| Zip Code | % Employed | vs State | vs National | |
| 1. | 43609 | 10.8% | 5.6%(+5.22)#100 | 5.3%(+5.54)#2,143 |
| 2. | 43605 | 9.9% | 5.6%(+4.26)#124 | 5.3%(+4.58)#2,743 |
| 3. | 43620 | 8.9% | 5.6%(+3.34)#167 | 5.3%(+3.66)#3,579 |
| 4. | 43612 | 7.5% | 5.6%(+1.88)#256 | 5.3%(+2.20)#5,578 |
| 5. | 43604 | 7.2% | 5.6%(+1.57)#284 | 5.3%(+1.89)#6,175 |
| 6. | 43608 | 7.1% | 5.6%(+1.52)#292 | 5.3%(+1.84)#6,294 |
| 7. | 43607 | 7.0% | 5.6%(+1.44)#300 | 5.3%(+1.75)#6,458 |
| 8. | 43606 | 6.5% | 5.6%(+0.879)#349 | 5.3%(+1.20)#7,918 |
| 9. | 43613 | 6.3% | 5.6%(+0.684)#373 | 5.3%(+1.00)#8,462 |
| 10. | 43614 | 6.2% | 5.6%(+0.610)#388 | 5.3%(+0.930)#8,690 |
| 11. | 43615 | 5.2% | 5.6%(-0.419)#530 | 5.3%(-0.100)#12,210 |
| 12. | 43623 | 4.8% | 5.6%(-0.808)#605 | 5.3%(-0.488)#13,770 |
| 13. | 43611 | 3.9% | 5.6%(-1.66)#748 | 5.3%(-1.34)#17,356 |
| 14. | 43610 | 3.0% | 5.6%(-2.61)#901 | 5.3%(-2.29)#21,280 |
| 15. | 43617 | 2.7% | 5.6%(-2.91)#937 | 5.3%(-2.59)#22,433 |
1
Common Questions
What are the Top 10 Zip Codes with the Highest Percentage of Population Employed in Food Preparation & Serving in Toledo, OH?
Top 10 Zip Codes with the Highest Percentage of Population Employed in Food Preparation & Serving in Toledo, OH are:
What zip code has the Highest Percentage of Population Employed in Food Preparation & Serving in Toledo, OH?
43609 has the Highest Percentage of Population Employed in Food Preparation & Serving in Toledo, OH with 10.8%.
What is the Percentage of Population Employed in Food Preparation & Serving in Toledo, OH?
Percentage of Population Employed in Food Preparation & Serving in Toledo is 6.9%.
What is the Percentage of Population Employed in Food Preparation & Serving in Ohio?
Percentage of Population Employed in Food Preparation & Serving in Ohio is 5.6%.
What is the Percentage of Population Employed in Food Preparation & Serving in the United States?
Percentage of Population Employed in Food Preparation & Serving in the United States is 5.3%.