Zip Codes with the Highest Percentage of Population Employed in Food Preparation & Serving in Cuyahoga Falls, OH
RELATED REPORTS & OPTIONS
Food Preparation & Serving
Cuyahoga Falls
Compare Zip Codes
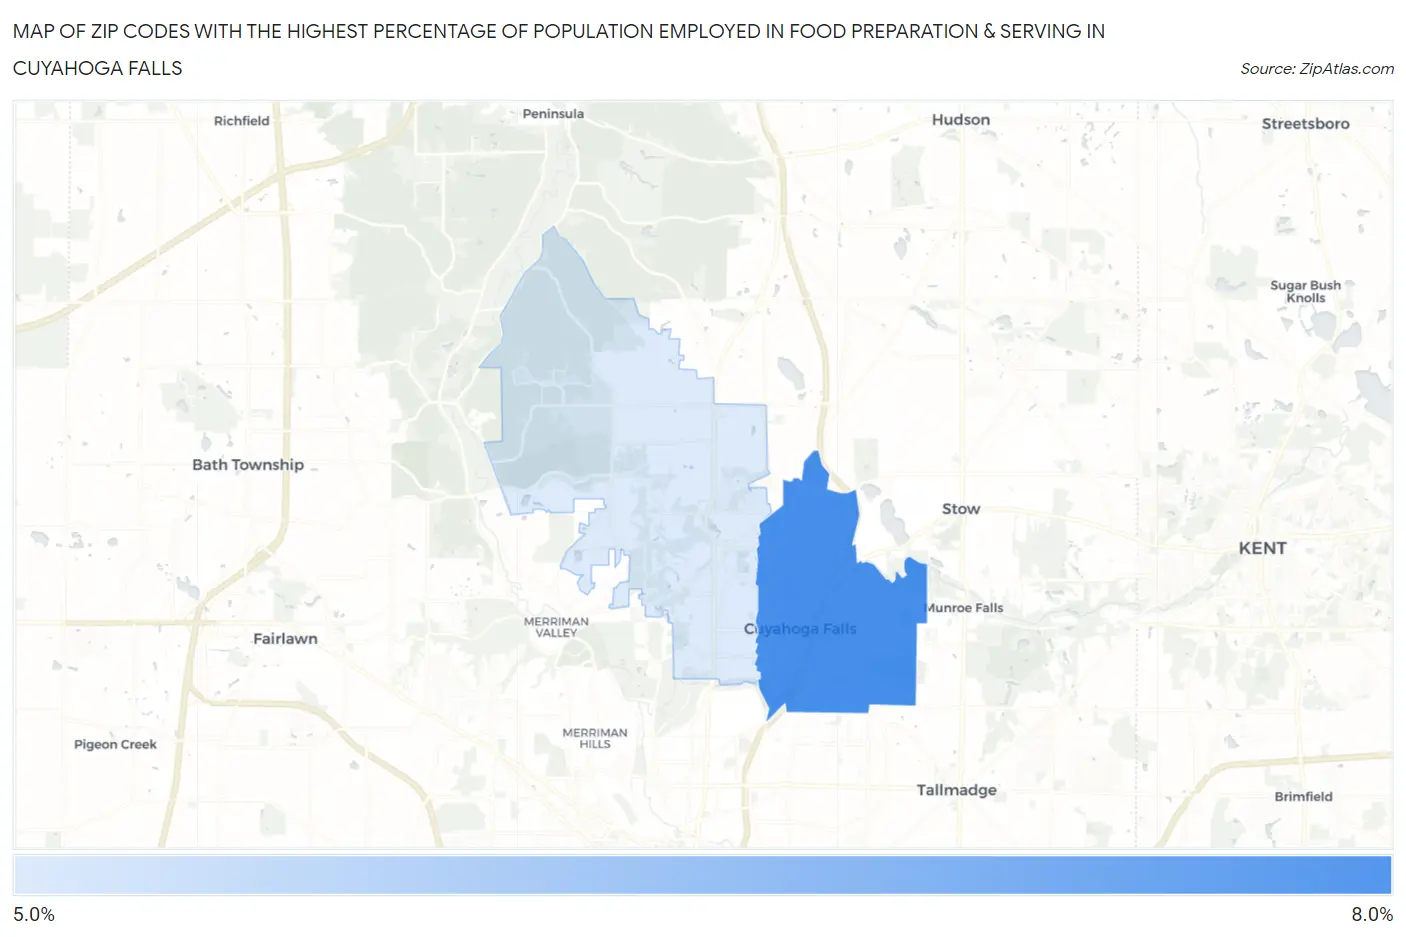
Map of Zip Codes with the Highest Percentage of Population Employed in Food Preparation & Serving in Cuyahoga Falls
5.1%
6.5%
Zip Codes with the Highest Percentage of Population Employed in Food Preparation & Serving in Cuyahoga Falls, OH
| Zip Code | % Employed | vs State | vs National | |
| 1. | 44221 | 6.5% | 5.6%(+0.897)#348 | 5.3%(+1.22)#7,867 |
| 2. | 44223 | 5.1% | 5.6%(-0.528)#547 | 5.3%(-0.208)#12,623 |
1
Common Questions
What are the Top Zip Codes with the Highest Percentage of Population Employed in Food Preparation & Serving in Cuyahoga Falls, OH?
Top Zip Codes with the Highest Percentage of Population Employed in Food Preparation & Serving in Cuyahoga Falls, OH are:
What zip code has the Highest Percentage of Population Employed in Food Preparation & Serving in Cuyahoga Falls, OH?
44221 has the Highest Percentage of Population Employed in Food Preparation & Serving in Cuyahoga Falls, OH with 6.5%.
What is the Percentage of Population Employed in Food Preparation & Serving in Cuyahoga Falls, OH?
Percentage of Population Employed in Food Preparation & Serving in Cuyahoga Falls is 6.2%.
What is the Percentage of Population Employed in Food Preparation & Serving in Ohio?
Percentage of Population Employed in Food Preparation & Serving in Ohio is 5.6%.
What is the Percentage of Population Employed in Food Preparation & Serving in the United States?
Percentage of Population Employed in Food Preparation & Serving in the United States is 5.3%.