Zip Codes with the Highest Percentage of Population Employed in Food Preparation & Serving in Youngstown, OH
RELATED REPORTS & OPTIONS
Food Preparation & Serving
Youngstown
Compare Zip Codes
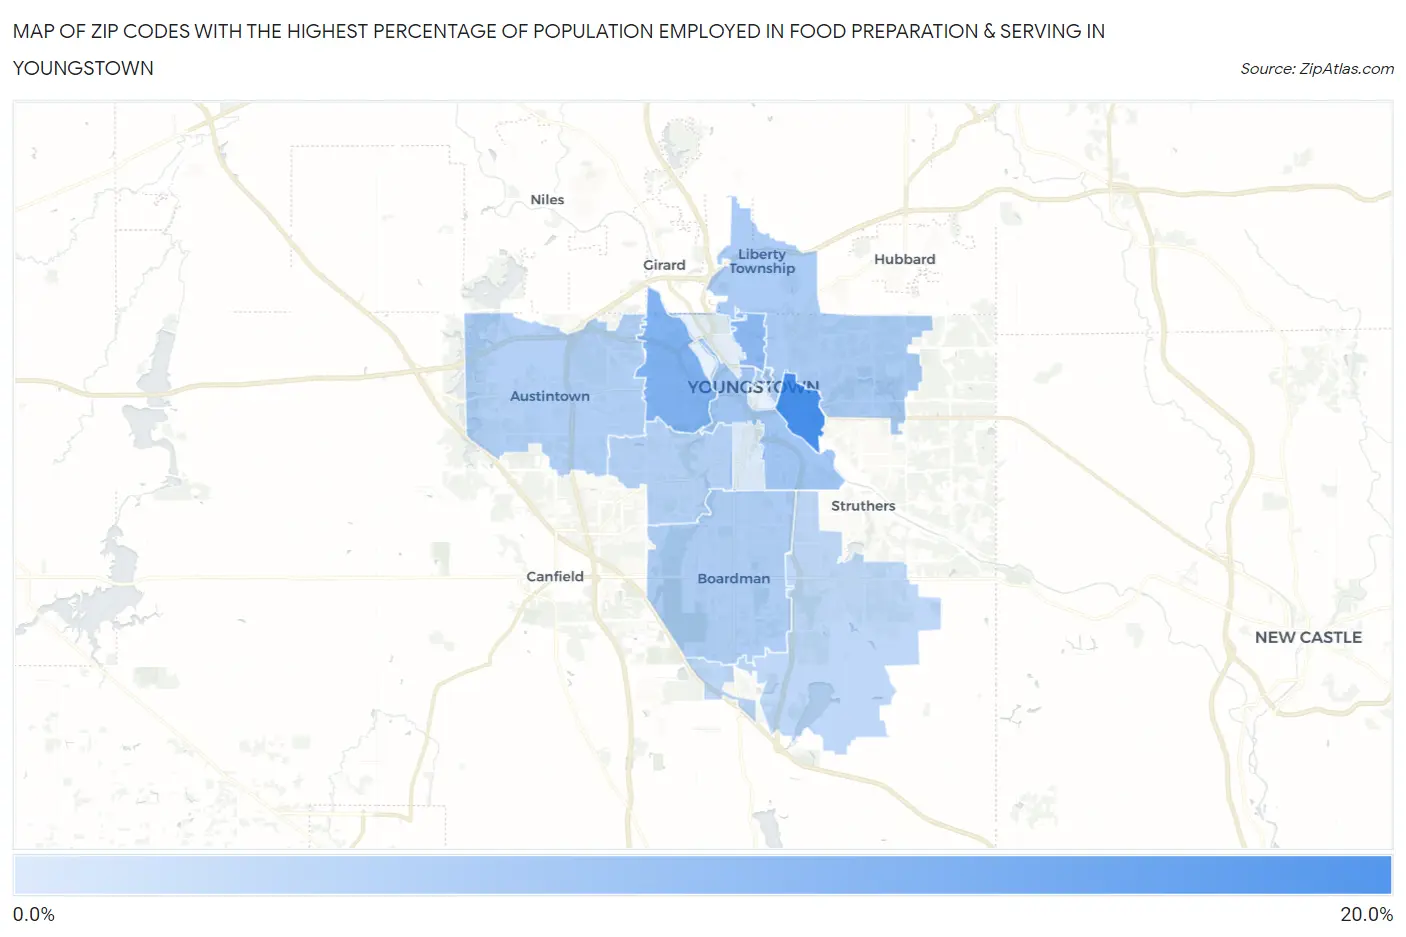
Map of Zip Codes with the Highest Percentage of Population Employed in Food Preparation & Serving in Youngstown
3.7%
18.0%
Zip Codes with the Highest Percentage of Population Employed in Food Preparation & Serving in Youngstown, OH
| Zip Code | % Employed | vs State | vs National | |
| 1. | 44506 | 18.0% | 5.6%(+12.4)#27 | 5.3%(+12.7)#657 |
| 2. | 44509 | 12.4% | 5.6%(+6.76)#70 | 5.3%(+7.08)#1,552 |
| 3. | 44504 | 10.9% | 5.6%(+5.28)#99 | 5.3%(+5.60)#2,115 |
| 4. | 44502 | 9.0% | 5.6%(+3.35)#166 | 5.3%(+3.67)#3,570 |
| 5. | 44555 | 8.2% | 5.6%(+2.64)#204 | 5.3%(+2.96)#4,378 |
| 6. | 44505 | 8.2% | 5.6%(+2.57)#207 | 5.3%(+2.89)#4,467 |
| 7. | 44512 | 7.9% | 5.6%(+2.32)#223 | 5.3%(+2.64)#4,851 |
| 8. | 44515 | 7.5% | 5.6%(+1.88)#257 | 5.3%(+2.20)#5,591 |
| 9. | 44511 | 7.3% | 5.6%(+1.74)#269 | 5.3%(+2.06)#5,845 |
| 10. | 44514 | 6.4% | 5.6%(+0.828)#352 | 5.3%(+1.15)#8,054 |
| 11. | 44507 | 3.7% | 5.6%(-1.89)#783 | 5.3%(-1.57)#18,248 |
1
Common Questions
What are the Top 10 Zip Codes with the Highest Percentage of Population Employed in Food Preparation & Serving in Youngstown, OH?
Top 10 Zip Codes with the Highest Percentage of Population Employed in Food Preparation & Serving in Youngstown, OH are:
What zip code has the Highest Percentage of Population Employed in Food Preparation & Serving in Youngstown, OH?
44506 has the Highest Percentage of Population Employed in Food Preparation & Serving in Youngstown, OH with 18.0%.
What is the Percentage of Population Employed in Food Preparation & Serving in Youngstown, OH?
Percentage of Population Employed in Food Preparation & Serving in Youngstown is 9.0%.
What is the Percentage of Population Employed in Food Preparation & Serving in Ohio?
Percentage of Population Employed in Food Preparation & Serving in Ohio is 5.6%.
What is the Percentage of Population Employed in Food Preparation & Serving in the United States?
Percentage of Population Employed in Food Preparation & Serving in the United States is 5.3%.