Zip Codes with the Highest Percentage of Population Employed in Food Preparation & Serving in Cincinnati, OH
RELATED REPORTS & OPTIONS
Food Preparation & Serving
Cincinnati
Compare Zip Codes
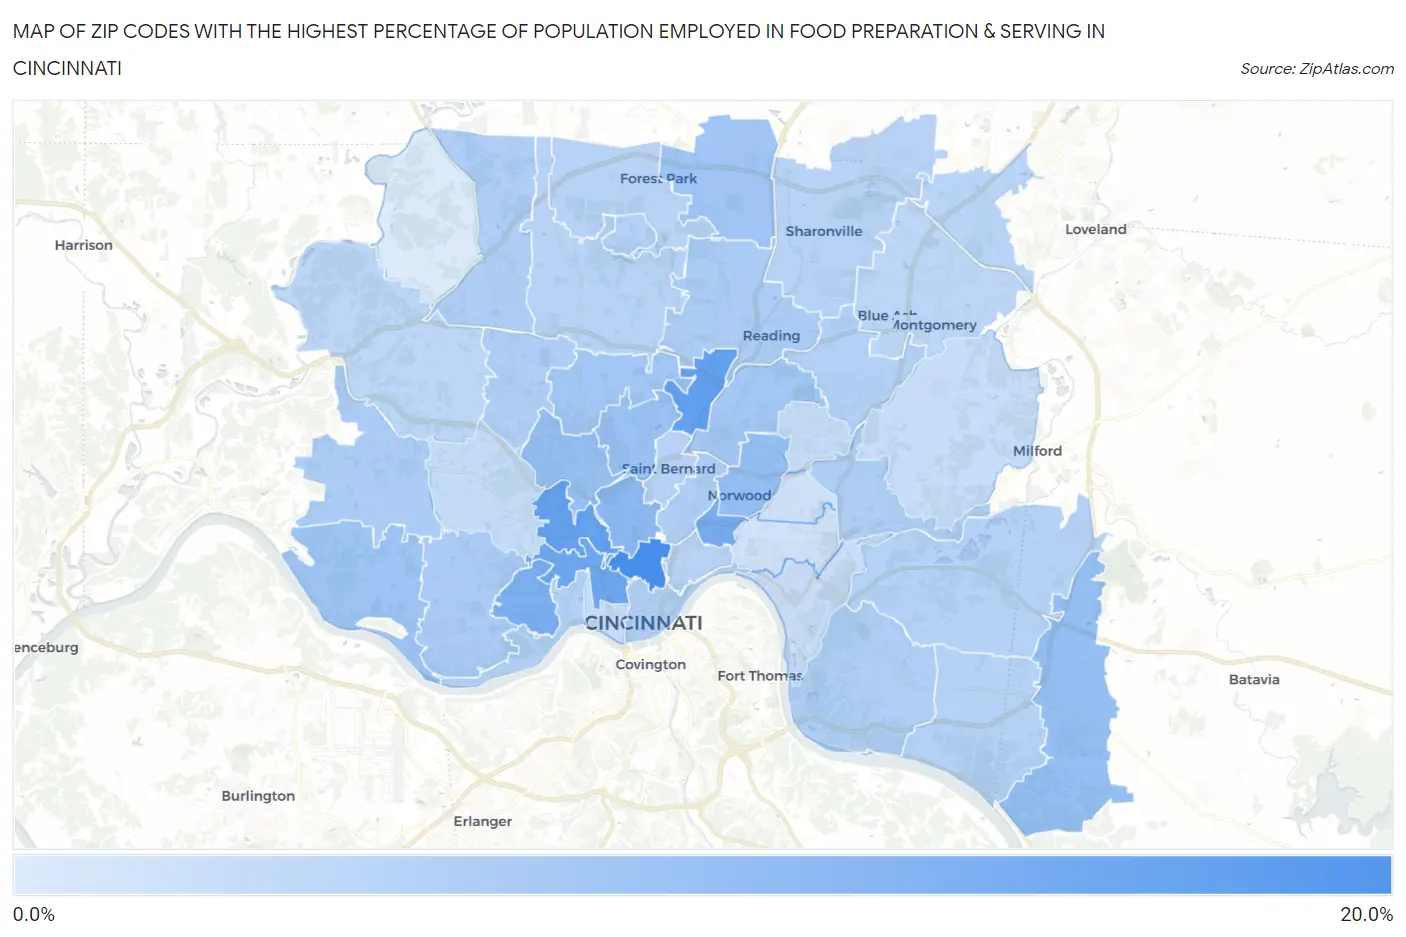
Map of Zip Codes with the Highest Percentage of Population Employed in Food Preparation & Serving in Cincinnati
0.53%
18.0%
Zip Codes with the Highest Percentage of Population Employed in Food Preparation & Serving in Cincinnati, OH
| Zip Code | % Employed | vs State | vs National | |
| 1. | 45219 | 18.0% | 5.6%(+12.4)#28 | 5.3%(+12.7)#660 |
| 2. | 45216 | 14.6% | 5.6%(+8.95)#44 | 5.3%(+9.27)#1,047 |
| 3. | 45225 | 14.4% | 5.6%(+8.76)#47 | 5.3%(+9.08)#1,085 |
| 4. | 45214 | 13.2% | 5.6%(+7.56)#57 | 5.3%(+7.88)#1,349 |
| 5. | 45207 | 12.1% | 5.6%(+6.48)#74 | 5.3%(+6.80)#1,631 |
| 6. | 45205 | 11.5% | 5.6%(+5.89)#84 | 5.3%(+6.21)#1,844 |
| 7. | 45220 | 9.5% | 5.6%(+3.88)#139 | 5.3%(+4.20)#3,069 |
| 8. | 45212 | 8.6% | 5.6%(+2.96)#187 | 5.3%(+3.28)#4,006 |
| 9. | 45245 | 8.4% | 5.6%(+2.77)#196 | 5.3%(+3.09)#4,208 |
| 10. | 45223 | 8.1% | 5.6%(+2.52)#210 | 5.3%(+2.84)#4,546 |
| 11. | 45232 | 8.0% | 5.6%(+2.43)#215 | 5.3%(+2.75)#4,685 |
| 12. | 45233 | 7.4% | 5.6%(+1.79)#265 | 5.3%(+2.11)#5,749 |
| 13. | 45246 | 7.1% | 5.6%(+1.50)#294 | 5.3%(+1.82)#6,332 |
| 14. | 45237 | 7.0% | 5.6%(+1.38)#304 | 5.3%(+1.70)#6,598 |
| 15. | 45224 | 6.8% | 5.6%(+1.21)#314 | 5.3%(+1.53)#7,024 |
| 16. | 45238 | 6.2% | 5.6%(+0.609)#389 | 5.3%(+0.928)#8,694 |
| 17. | 45215 | 5.9% | 5.6%(+0.304)#423 | 5.3%(+0.624)#9,647 |
| 18. | 45248 | 5.8% | 5.6%(+0.228)#436 | 5.3%(+0.547)#9,919 |
| 19. | 45239 | 5.7% | 5.6%(+0.098)#446 | 5.3%(+0.418)#10,323 |
| 20. | 45229 | 5.7% | 5.6%(+0.075)#451 | 5.3%(+0.395)#10,421 |
| 21. | 45251 | 5.6% | 5.6%(+0.021)#461 | 5.3%(+0.340)#10,619 |
| 22. | 45227 | 5.5% | 5.6%(-0.078)#476 | 5.3%(+0.242)#10,970 |
| 23. | 45202 | 5.3% | 5.6%(-0.275)#503 | 5.3%(+0.045)#11,648 |
| 24. | 45230 | 5.3% | 5.6%(-0.333)#514 | 5.3%(-0.013)#11,866 |
| 25. | 45236 | 5.2% | 5.6%(-0.413)#527 | 5.3%(-0.094)#12,178 |
| 26. | 45218 | 5.1% | 5.6%(-0.490)#540 | 5.3%(-0.170)#12,480 |
| 27. | 45204 | 5.1% | 5.6%(-0.546)#551 | 5.3%(-0.227)#12,690 |
| 28. | 45255 | 4.9% | 5.6%(-0.726)#589 | 5.3%(-0.407)#13,443 |
| 29. | 45244 | 4.7% | 5.6%(-0.905)#619 | 5.3%(-0.585)#14,156 |
| 30. | 45217 | 4.7% | 5.6%(-0.908)#620 | 5.3%(-0.588)#14,165 |
| 31. | 45206 | 4.7% | 5.6%(-0.925)#621 | 5.3%(-0.605)#14,240 |
| 32. | 45241 | 4.6% | 5.6%(-1.01)#638 | 5.3%(-0.694)#14,630 |
| 33. | 45231 | 4.6% | 5.6%(-1.03)#643 | 5.3%(-0.711)#14,717 |
| 34. | 45240 | 4.6% | 5.6%(-1.05)#644 | 5.3%(-0.726)#14,791 |
| 35. | 45249 | 4.4% | 5.6%(-1.24)#674 | 5.3%(-0.925)#15,600 |
| 36. | 45242 | 4.0% | 5.6%(-1.56)#725 | 5.3%(-1.24)#16,954 |
| 37. | 45247 | 4.0% | 5.6%(-1.65)#745 | 5.3%(-1.33)#17,287 |
| 38. | 45211 | 3.1% | 5.6%(-2.50)#884 | 5.3%(-2.18)#20,851 |
| 39. | 45213 | 3.0% | 5.6%(-2.61)#900 | 5.3%(-2.29)#21,264 |
| 40. | 45203 | 2.9% | 5.6%(-2.69)#909 | 5.3%(-2.37)#21,576 |
| 41. | 45243 | 2.9% | 5.6%(-2.71)#913 | 5.3%(-2.39)#21,681 |
| 42. | 45226 | 2.6% | 5.6%(-3.00)#945 | 5.3%(-2.68)#22,744 |
| 43. | 45209 | 2.1% | 5.6%(-3.46)#993 | 5.3%(-3.14)#24,270 |
| 44. | 45208 | 1.8% | 5.6%(-3.76)#1,016 | 5.3%(-3.44)#25,162 |
| 45. | 45252 | 0.53% | 5.6%(-5.08)#1,081 | 5.3%(-4.76)#27,655 |
1
Common Questions
What are the Top 10 Zip Codes with the Highest Percentage of Population Employed in Food Preparation & Serving in Cincinnati, OH?
Top 10 Zip Codes with the Highest Percentage of Population Employed in Food Preparation & Serving in Cincinnati, OH are:
What zip code has the Highest Percentage of Population Employed in Food Preparation & Serving in Cincinnati, OH?
45219 has the Highest Percentage of Population Employed in Food Preparation & Serving in Cincinnati, OH with 18.0%.
What is the Percentage of Population Employed in Food Preparation & Serving in Cincinnati, OH?
Percentage of Population Employed in Food Preparation & Serving in Cincinnati is 6.8%.
What is the Percentage of Population Employed in Food Preparation & Serving in Ohio?
Percentage of Population Employed in Food Preparation & Serving in Ohio is 5.6%.
What is the Percentage of Population Employed in Food Preparation & Serving in the United States?
Percentage of Population Employed in Food Preparation & Serving in the United States is 5.3%.