Zip Codes with the Highest Percentage of Population Employed in Food Preparation & Serving in Steubenville, OH
RELATED REPORTS & OPTIONS
Food Preparation & Serving
Steubenville
Compare Zip Codes
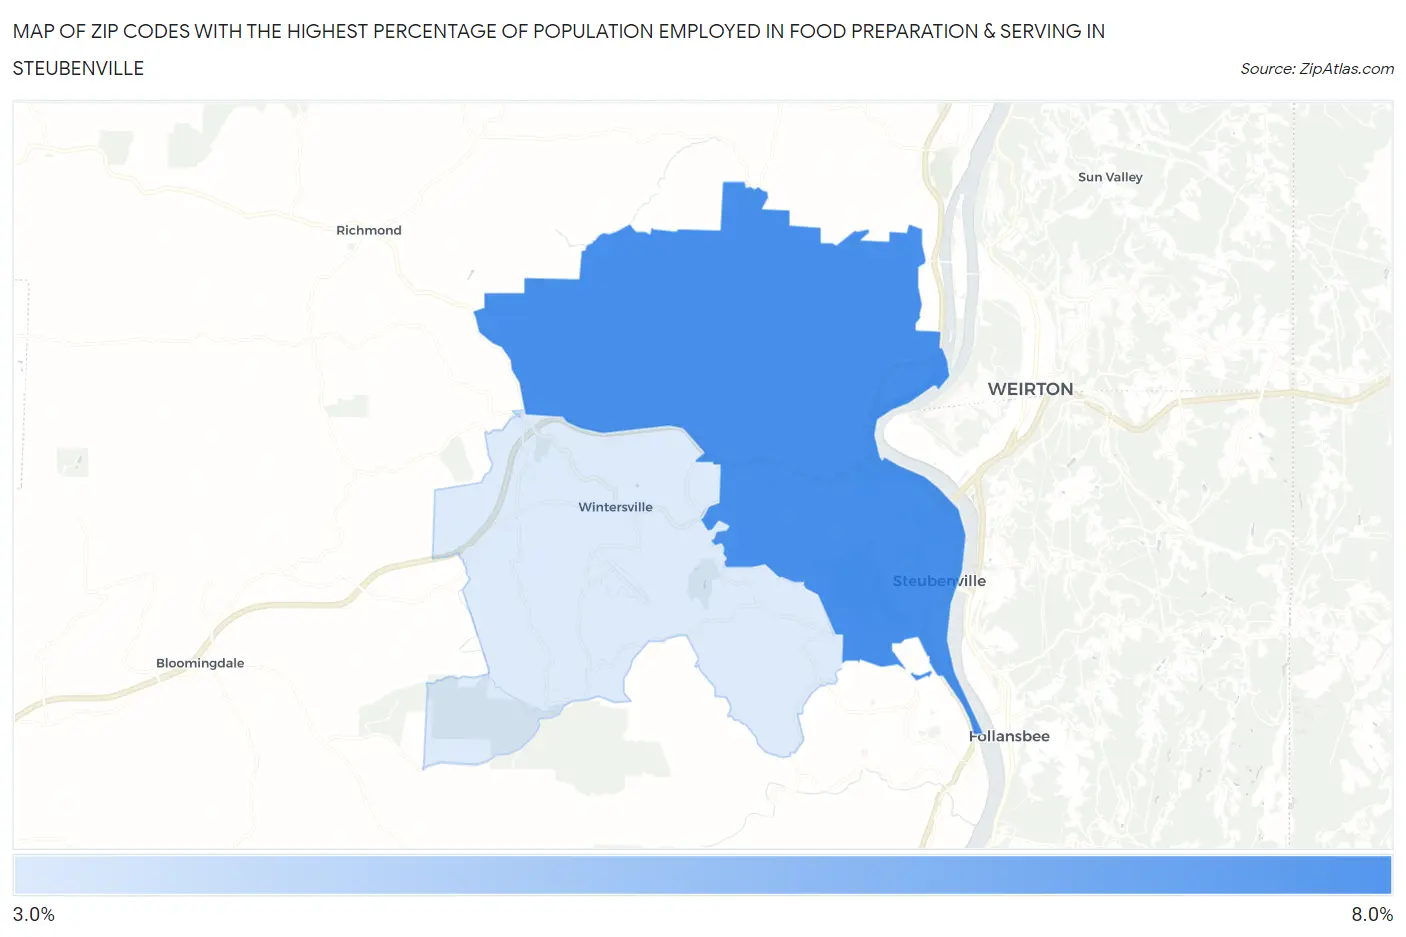
Map of Zip Codes with the Highest Percentage of Population Employed in Food Preparation & Serving in Steubenville
3.5%
7.1%
Zip Codes with the Highest Percentage of Population Employed in Food Preparation & Serving in Steubenville, OH
| Zip Code | % Employed | vs State | vs National | |
| 1. | 43952 | 7.1% | 5.6%(+1.46)#299 | 5.3%(+1.78)#6,406 |
| 2. | 43953 | 3.5% | 5.6%(-2.10)#819 | 5.3%(-1.78)#19,170 |
1
Common Questions
What are the Top Zip Codes with the Highest Percentage of Population Employed in Food Preparation & Serving in Steubenville, OH?
Top Zip Codes with the Highest Percentage of Population Employed in Food Preparation & Serving in Steubenville, OH are:
What zip code has the Highest Percentage of Population Employed in Food Preparation & Serving in Steubenville, OH?
43952 has the Highest Percentage of Population Employed in Food Preparation & Serving in Steubenville, OH with 7.1%.
What is the Percentage of Population Employed in Food Preparation & Serving in Steubenville, OH?
Percentage of Population Employed in Food Preparation & Serving in Steubenville is 6.2%.
What is the Percentage of Population Employed in Food Preparation & Serving in Ohio?
Percentage of Population Employed in Food Preparation & Serving in Ohio is 5.6%.
What is the Percentage of Population Employed in Food Preparation & Serving in the United States?
Percentage of Population Employed in Food Preparation & Serving in the United States is 5.3%.