Zip Codes with the Highest Percentage of Population Employed in Accommodation & Food Services in Cleveland, OH
RELATED REPORTS & OPTIONS
Accommodation & Food Services
Cleveland
Compare Zip Codes
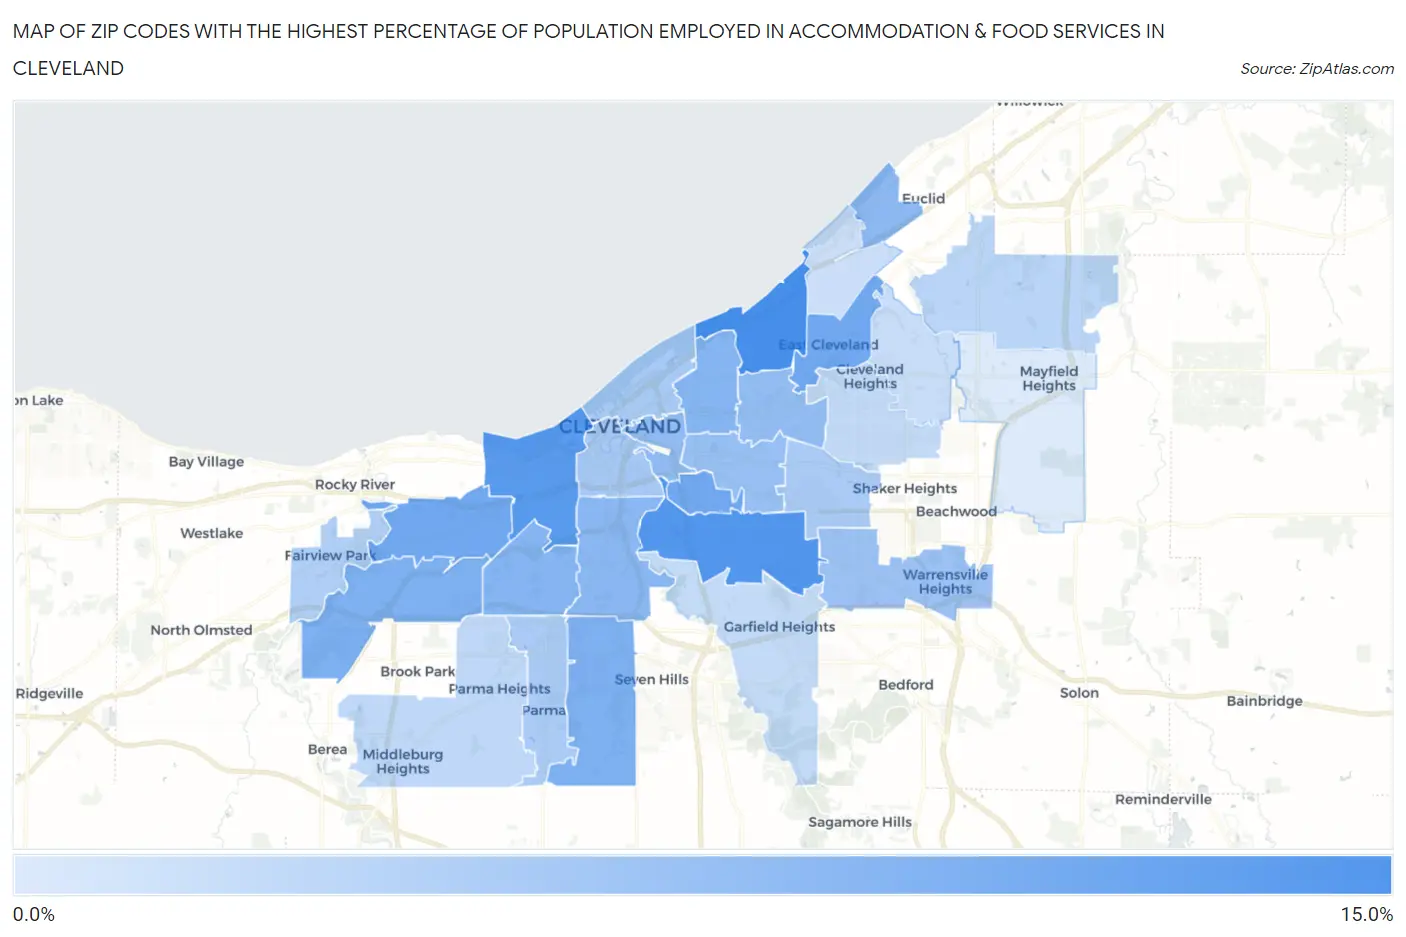
Map of Zip Codes with the Highest Percentage of Population Employed in Accommodation & Food Services in Cleveland
3.8%
11.8%
Zip Codes with the Highest Percentage of Population Employed in Accommodation & Food Services in Cleveland, OH
| Zip Code | % Employed | vs State | vs National | |
| 1. | 44108 | 11.8% | 7.0%(+4.80)#113 | 6.9%(+4.92)#2,953 |
| 2. | 44105 | 11.2% | 7.0%(+4.21)#136 | 6.9%(+4.34)#3,382 |
| 3. | 44102 | 10.9% | 7.0%(+3.91)#146 | 6.9%(+4.03)#3,624 |
| 4. | 44127 | 9.6% | 7.0%(+2.58)#222 | 6.9%(+2.70)#5,092 |
| 5. | 44111 | 9.6% | 7.0%(+2.55)#224 | 6.9%(+2.68)#5,129 |
| 6. | 44112 | 9.5% | 7.0%(+2.50)#227 | 6.9%(+2.63)#5,194 |
| 7. | 44135 | 8.8% | 7.0%(+1.84)#281 | 6.9%(+1.97)#6,194 |
| 8. | 44134 | 8.8% | 7.0%(+1.77)#287 | 6.9%(+1.90)#6,328 |
| 9. | 44103 | 8.4% | 7.0%(+1.38)#318 | 6.9%(+1.51)#7,015 |
| 10. | 44144 | 8.4% | 7.0%(+1.35)#321 | 6.9%(+1.48)#7,076 |
| 11. | 44109 | 8.2% | 7.0%(+1.18)#332 | 6.9%(+1.31)#7,444 |
| 12. | 44119 | 8.1% | 7.0%(+1.07)#342 | 6.9%(+1.20)#7,669 |
| 13. | 44115 | 7.8% | 7.0%(+0.747)#374 | 6.9%(+0.874)#8,354 |
| 14. | 44106 | 7.7% | 7.0%(+0.687)#383 | 6.9%(+0.815)#8,503 |
| 15. | 44104 | 7.4% | 7.0%(+0.435)#408 | 6.9%(+0.563)#9,125 |
| 16. | 44128 | 7.2% | 7.0%(+0.207)#435 | 6.9%(+0.334)#9,769 |
| 17. | 44113 | 6.8% | 7.0%(-0.252)#492 | 6.9%(-0.124)#11,024 |
| 18. | 44114 | 6.5% | 7.0%(-0.476)#527 | 6.9%(-0.348)#11,735 |
| 19. | 44129 | 6.4% | 7.0%(-0.564)#545 | 6.9%(-0.436)#12,018 |
| 20. | 44120 | 6.4% | 7.0%(-0.589)#550 | 6.9%(-0.461)#12,092 |
| 21. | 44126 | 6.1% | 7.0%(-0.892)#589 | 6.9%(-0.764)#13,070 |
| 22. | 44143 | 5.6% | 7.0%(-1.42)#645 | 6.9%(-1.29)#14,752 |
| 23. | 44130 | 5.4% | 7.0%(-1.57)#669 | 6.9%(-1.44)#15,269 |
| 24. | 44118 | 5.1% | 7.0%(-1.88)#716 | 6.9%(-1.76)#16,375 |
| 25. | 44125 | 5.1% | 7.0%(-1.90)#717 | 6.9%(-1.77)#16,440 |
| 26. | 44121 | 4.8% | 7.0%(-2.16)#754 | 6.9%(-2.03)#17,327 |
| 27. | 44110 | 4.8% | 7.0%(-2.17)#755 | 6.9%(-2.04)#17,360 |
| 28. | 44124 | 3.8% | 7.0%(-3.18)#870 | 6.9%(-3.05)#20,699 |
1
Common Questions
What are the Top 10 Zip Codes with the Highest Percentage of Population Employed in Accommodation & Food Services in Cleveland, OH?
Top 10 Zip Codes with the Highest Percentage of Population Employed in Accommodation & Food Services in Cleveland, OH are:
What zip code has the Highest Percentage of Population Employed in Accommodation & Food Services in Cleveland, OH?
44108 has the Highest Percentage of Population Employed in Accommodation & Food Services in Cleveland, OH with 11.8%.
What is the Percentage of Population Employed in Accommodation & Food Services in Cleveland, OH?
Percentage of Population Employed in Accommodation & Food Services in Cleveland is 8.8%.
What is the Percentage of Population Employed in Accommodation & Food Services in Ohio?
Percentage of Population Employed in Accommodation & Food Services in Ohio is 7.0%.
What is the Percentage of Population Employed in Accommodation & Food Services in the United States?
Percentage of Population Employed in Accommodation & Food Services in the United States is 6.9%.