Zip Codes with the Highest Percentage of Population Employed in Accommodation & Food Services in Youngstown, OH
RELATED REPORTS & OPTIONS
Accommodation & Food Services
Youngstown
Compare Zip Codes
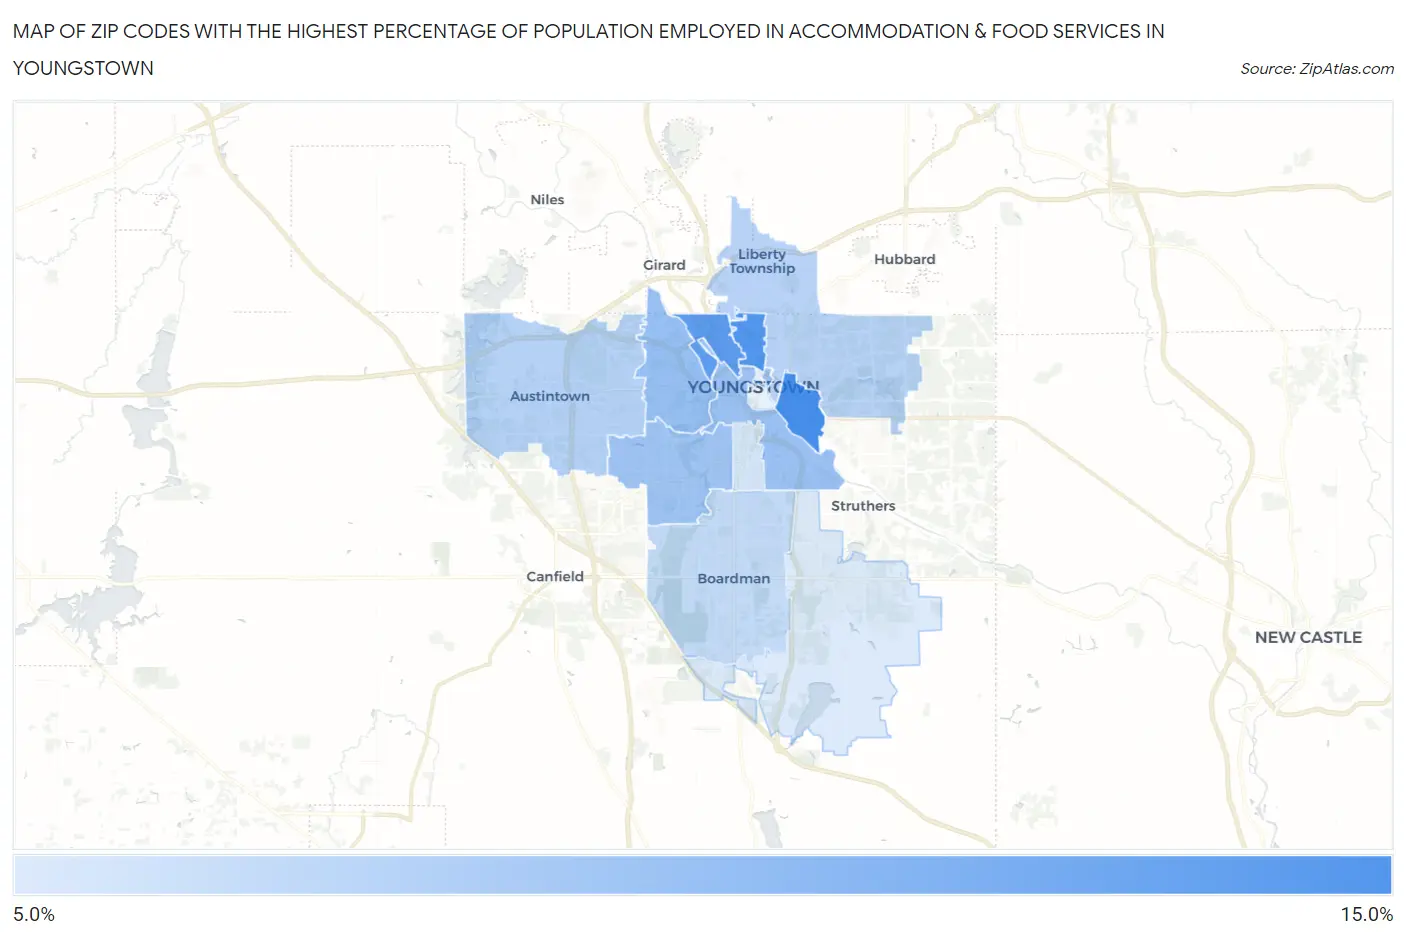
Map of Zip Codes with the Highest Percentage of Population Employed in Accommodation & Food Services in Youngstown
7.8%
14.5%
Zip Codes with the Highest Percentage of Population Employed in Accommodation & Food Services in Youngstown, OH
| Zip Code | % Employed | vs State | vs National | |
| 1. | 44506 | 14.5% | 7.0%(+7.51)#66 | 6.9%(+7.64)#1,813 |
| 2. | 44504 | 14.0% | 7.0%(+6.96)#73 | 6.9%(+7.09)#1,981 |
| 3. | 44510 | 13.4% | 7.0%(+6.41)#80 | 6.9%(+6.54)#2,171 |
| 4. | 44509 | 10.9% | 7.0%(+3.84)#149 | 6.9%(+3.97)#3,673 |
| 5. | 44502 | 10.7% | 7.0%(+3.73)#156 | 6.9%(+3.86)#3,771 |
| 6. | 44511 | 10.4% | 7.0%(+3.42)#172 | 6.9%(+3.55)#4,067 |
| 7. | 44515 | 9.4% | 7.0%(+2.43)#233 | 6.9%(+2.56)#5,291 |
| 8. | 44505 | 9.3% | 7.0%(+2.33)#240 | 6.9%(+2.45)#5,449 |
| 9. | 44512 | 8.9% | 7.0%(+1.85)#278 | 6.9%(+1.98)#6,179 |
| 10. | 44507 | 8.1% | 7.0%(+1.05)#343 | 6.9%(+1.18)#7,710 |
| 11. | 44514 | 7.8% | 7.0%(+0.747)#375 | 6.9%(+0.874)#8,355 |
1
Common Questions
What are the Top 10 Zip Codes with the Highest Percentage of Population Employed in Accommodation & Food Services in Youngstown, OH?
Top 10 Zip Codes with the Highest Percentage of Population Employed in Accommodation & Food Services in Youngstown, OH are:
What zip code has the Highest Percentage of Population Employed in Accommodation & Food Services in Youngstown, OH?
44506 has the Highest Percentage of Population Employed in Accommodation & Food Services in Youngstown, OH with 14.5%.
What is the Percentage of Population Employed in Accommodation & Food Services in Youngstown, OH?
Percentage of Population Employed in Accommodation & Food Services in Youngstown is 10.5%.
What is the Percentage of Population Employed in Accommodation & Food Services in Ohio?
Percentage of Population Employed in Accommodation & Food Services in Ohio is 7.0%.
What is the Percentage of Population Employed in Accommodation & Food Services in the United States?
Percentage of Population Employed in Accommodation & Food Services in the United States is 6.9%.