Zip Codes with the Highest Percentage of Population Employed in Accommodation & Food Services in Hamilton, OH
RELATED REPORTS & OPTIONS
Accommodation & Food Services
Hamilton
Compare Zip Codes
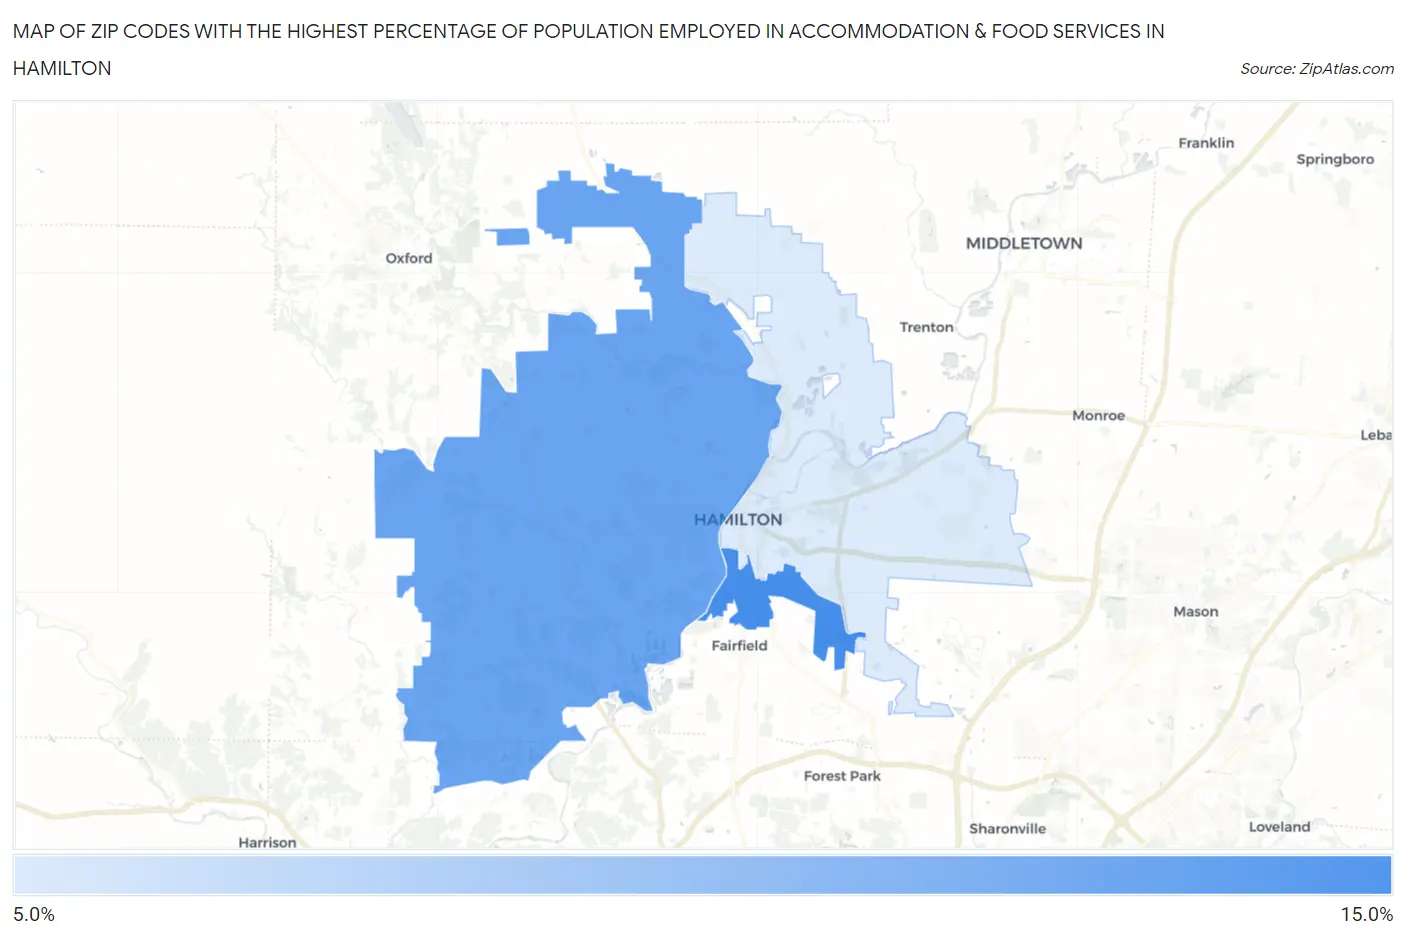
Map of Zip Codes with the Highest Percentage of Population Employed in Accommodation & Food Services in Hamilton
7.7%
10.6%
Zip Codes with the Highest Percentage of Population Employed in Accommodation & Food Services in Hamilton, OH
| Zip Code | % Employed | vs State | vs National | |
| 1. | 45015 | 10.6% | 7.0%(+3.60)#160 | 6.9%(+3.72)#3,884 |
| 2. | 45013 | 9.9% | 7.0%(+2.93)#203 | 6.9%(+3.05)#4,628 |
| 3. | 45011 | 7.7% | 7.0%(+0.686)#384 | 6.9%(+0.814)#8,508 |
1
Common Questions
What are the Top Zip Codes with the Highest Percentage of Population Employed in Accommodation & Food Services in Hamilton, OH?
Top Zip Codes with the Highest Percentage of Population Employed in Accommodation & Food Services in Hamilton, OH are:
What zip code has the Highest Percentage of Population Employed in Accommodation & Food Services in Hamilton, OH?
45015 has the Highest Percentage of Population Employed in Accommodation & Food Services in Hamilton, OH with 10.6%.
What is the Percentage of Population Employed in Accommodation & Food Services in Hamilton, OH?
Percentage of Population Employed in Accommodation & Food Services in Hamilton is 11.1%.
What is the Percentage of Population Employed in Accommodation & Food Services in Ohio?
Percentage of Population Employed in Accommodation & Food Services in Ohio is 7.0%.
What is the Percentage of Population Employed in Accommodation & Food Services in the United States?
Percentage of Population Employed in Accommodation & Food Services in the United States is 6.9%.