Zip Codes with the Highest Percentage of Households with Income Above $200,000 in Las Vegas, NV
RELATED REPORTS & OPTIONS
Household Income | $200k+
Las Vegas
Compare Zip Codes
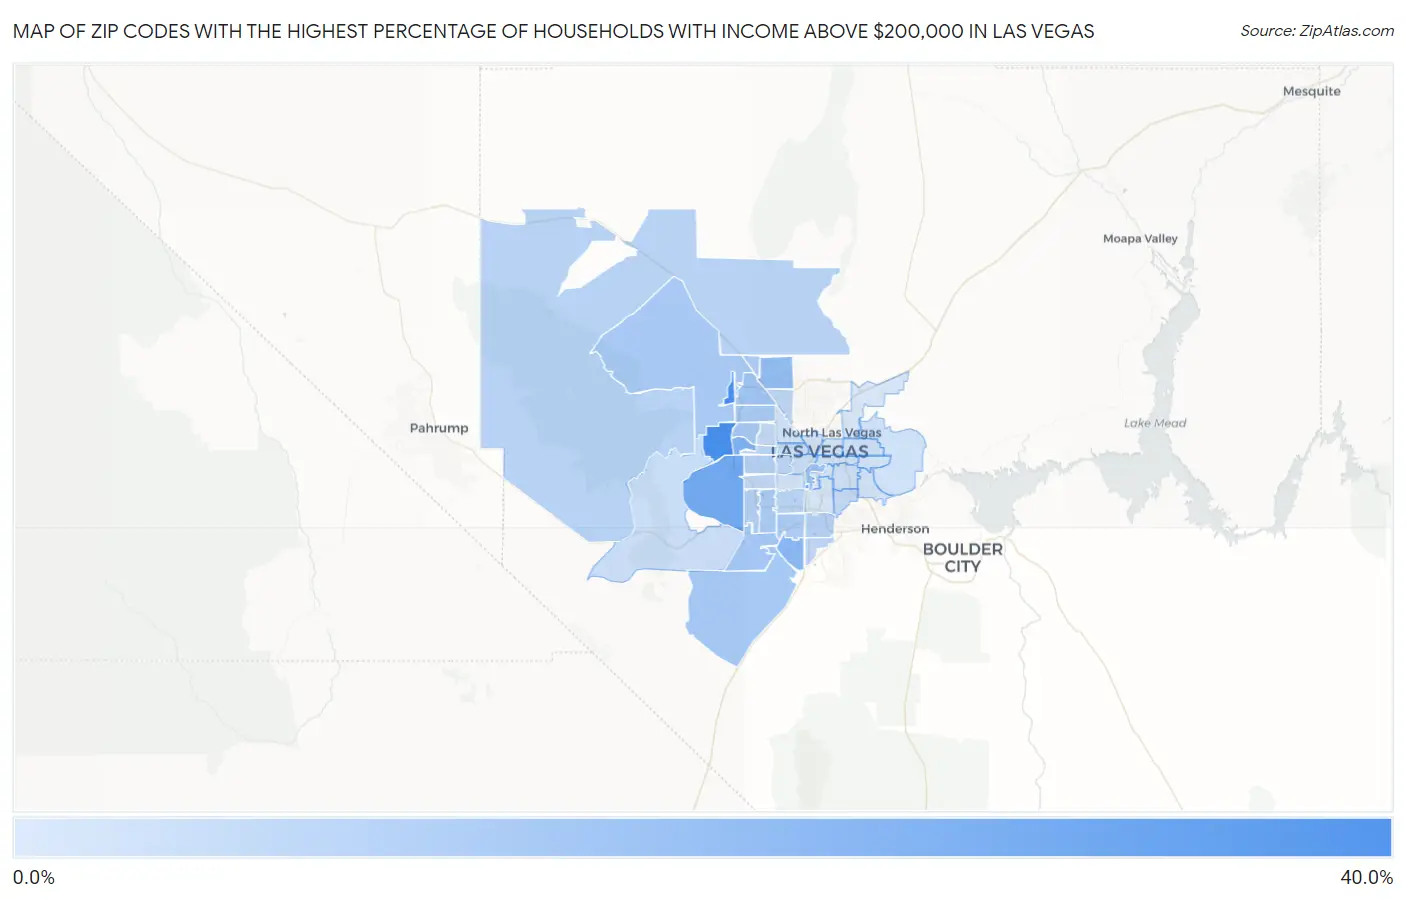
Map of Zip Codes with the Highest Percentage of Households with Income Above $200,000 in Las Vegas
1.1%
36.5%
Zip Codes with the Highest Percentage of Households with Income Above $200,000 in Las Vegas, NV
| Zip Code | Households with Income > $200k | vs State | vs National | |
| 1. | 89138 | 36.5% | 8.7%(+27.8)#6 | 11.4%(+25.1)#875 |
| 2. | 89158 | 28.2% | 8.7%(+19.5)#9 | 11.4%(+16.8)#1,694 |
| 3. | 89135 | 25.2% | 8.7%(+16.5)#10 | 11.4%(+13.8)#2,145 |
| 4. | 89144 | 21.1% | 8.7%(+12.4)#14 | 11.4%(+9.70)#3,000 |
| 5. | 89141 | 19.2% | 8.7%(+10.5)#18 | 11.4%(+7.80)#3,510 |
| 6. | 89131 | 16.5% | 8.7%(+7.80)#19 | 11.4%(+5.10)#4,362 |
| 7. | 89109 | 15.0% | 8.7%(+6.30)#22 | 11.4%(+3.60)#4,993 |
| 8. | 89149 | 13.6% | 8.7%(+4.90)#28 | 11.4%(+2.20)#5,676 |
| 9. | 89178 | 12.7% | 8.7%(+4.00)#31 | 11.4%(+1.30)#6,195 |
| 10. | 89179 | 12.6% | 8.7%(+3.90)#32 | 11.4%(+1.20)#6,280 |
| 11. | 89134 | 12.3% | 8.7%(+3.60)#34 | 11.4%(+0.900)#6,471 |
| 12. | 89166 | 12.0% | 8.7%(+3.30)#37 | 11.4%(+0.600)#6,670 |
| 13. | 89129 | 11.8% | 8.7%(+3.10)#38 | 11.4%(+0.400)#6,785 |
| 14. | 89113 | 11.5% | 8.7%(+2.80)#41 | 11.4%(+0.100)#7,017 |
| 15. | 89139 | 10.7% | 8.7%(+2.00)#43 | 11.4%(-0.700)#7,606 |
| 16. | 89143 | 10.6% | 8.7%(+1.90)#44 | 11.4%(-0.800)#7,715 |
| 17. | 89148 | 9.8% | 8.7%(+1.10)#49 | 11.4%(-1.60)#8,427 |
| 18. | 89117 | 9.1% | 8.7%(+0.400)#52 | 11.4%(-2.30)#9,117 |
| 19. | 89123 | 8.8% | 8.7%(+0.100)#54 | 11.4%(-2.60)#9,409 |
| 20. | 89124 | 8.6% | 8.7%(-0.100)#58 | 11.4%(-2.80)#9,719 |
| 21. | 89118 | 8.1% | 8.7%(-0.600)#61 | 11.4%(-3.30)#10,246 |
| 22. | 89145 | 7.5% | 8.7%(-1.20)#63 | 11.4%(-3.90)#11,055 |
| 23. | 89183 | 7.4% | 8.7%(-1.30)#66 | 11.4%(-4.00)#11,186 |
| 24. | 89146 | 7.4% | 8.7%(-1.30)#67 | 11.4%(-4.00)#11,203 |
| 25. | 89130 | 6.8% | 8.7%(-1.90)#72 | 11.4%(-4.60)#12,065 |
| 26. | 89147 | 6.6% | 8.7%(-2.10)#74 | 11.4%(-4.80)#12,388 |
| 27. | 89128 | 6.5% | 8.7%(-2.20)#75 | 11.4%(-4.90)#12,560 |
| 28. | 89120 | 6.1% | 8.7%(-2.60)#82 | 11.4%(-5.30)#13,268 |
| 29. | 89102 | 4.6% | 8.7%(-4.10)#96 | 11.4%(-6.80)#16,514 |
| 30. | 89161 | 4.5% | 8.7%(-4.20)#97 | 11.4%(-6.90)#16,980 |
| 31. | 89107 | 4.1% | 8.7%(-4.60)#101 | 11.4%(-7.30)#17,813 |
| 32. | 89121 | 3.6% | 8.7%(-5.10)#105 | 11.4%(-7.80)#19,135 |
| 33. | 89110 | 3.3% | 8.7%(-5.40)#109 | 11.4%(-8.10)#19,989 |
| 34. | 89122 | 2.8% | 8.7%(-5.90)#113 | 11.4%(-8.60)#21,416 |
| 35. | 89104 | 2.8% | 8.7%(-5.90)#114 | 11.4%(-8.60)#21,422 |
| 36. | 89156 | 2.8% | 8.7%(-5.90)#115 | 11.4%(-8.60)#21,429 |
| 37. | 89103 | 2.7% | 8.7%(-6.00)#117 | 11.4%(-8.70)#21,713 |
| 38. | 89106 | 2.7% | 8.7%(-6.00)#118 | 11.4%(-8.70)#21,738 |
| 39. | 89142 | 2.5% | 8.7%(-6.20)#121 | 11.4%(-8.90)#22,327 |
| 40. | 89108 | 2.4% | 8.7%(-6.30)#122 | 11.4%(-9.00)#22,606 |
| 41. | 89119 | 2.0% | 8.7%(-6.70)#129 | 11.4%(-9.40)#23,734 |
| 42. | 89101 | 1.9% | 8.7%(-6.80)#130 | 11.4%(-9.50)#24,034 |
| 43. | 89169 | 1.7% | 8.7%(-7.00)#133 | 11.4%(-9.70)#24,556 |
| 44. | 89115 | 1.1% | 8.7%(-7.60)#136 | 11.4%(-10.3)#25,942 |
1
Common Questions
What are the Top 10 Zip Codes with the Highest Percentage of Households with Income Above $200,000 in Las Vegas, NV?
Top 10 Zip Codes with the Highest Percentage of Households with Income Above $200,000 in Las Vegas, NV are:
What zip code has the Highest Percentage of Households with Income Above $200,000 in Las Vegas, NV?
89138 has the Highest Percentage of Households with Income Above $200,000 in Las Vegas, NV with 36.5%.
What is the Percentage of Households with Income Above $200,000 in Las Vegas, NV?
Percentage of Households with Income Above $200,000 in Las Vegas is 8.2%.
What is the Percentage of Households with Income Above $200,000 in Nevada?
Percentage of Households with Income Above $200,000 in Nevada is 8.7%.
What is the Percentage of Households with Income Above $200,000 in the United States?
Percentage of Households with Income Above $200,000 in the United States is 11.4%.