Zip Codes with the Highest Percentage of Households with Income Above $200,000 in Carson City, NV
RELATED REPORTS & OPTIONS
Household Income | $200k+
Carson City
Compare Zip Codes
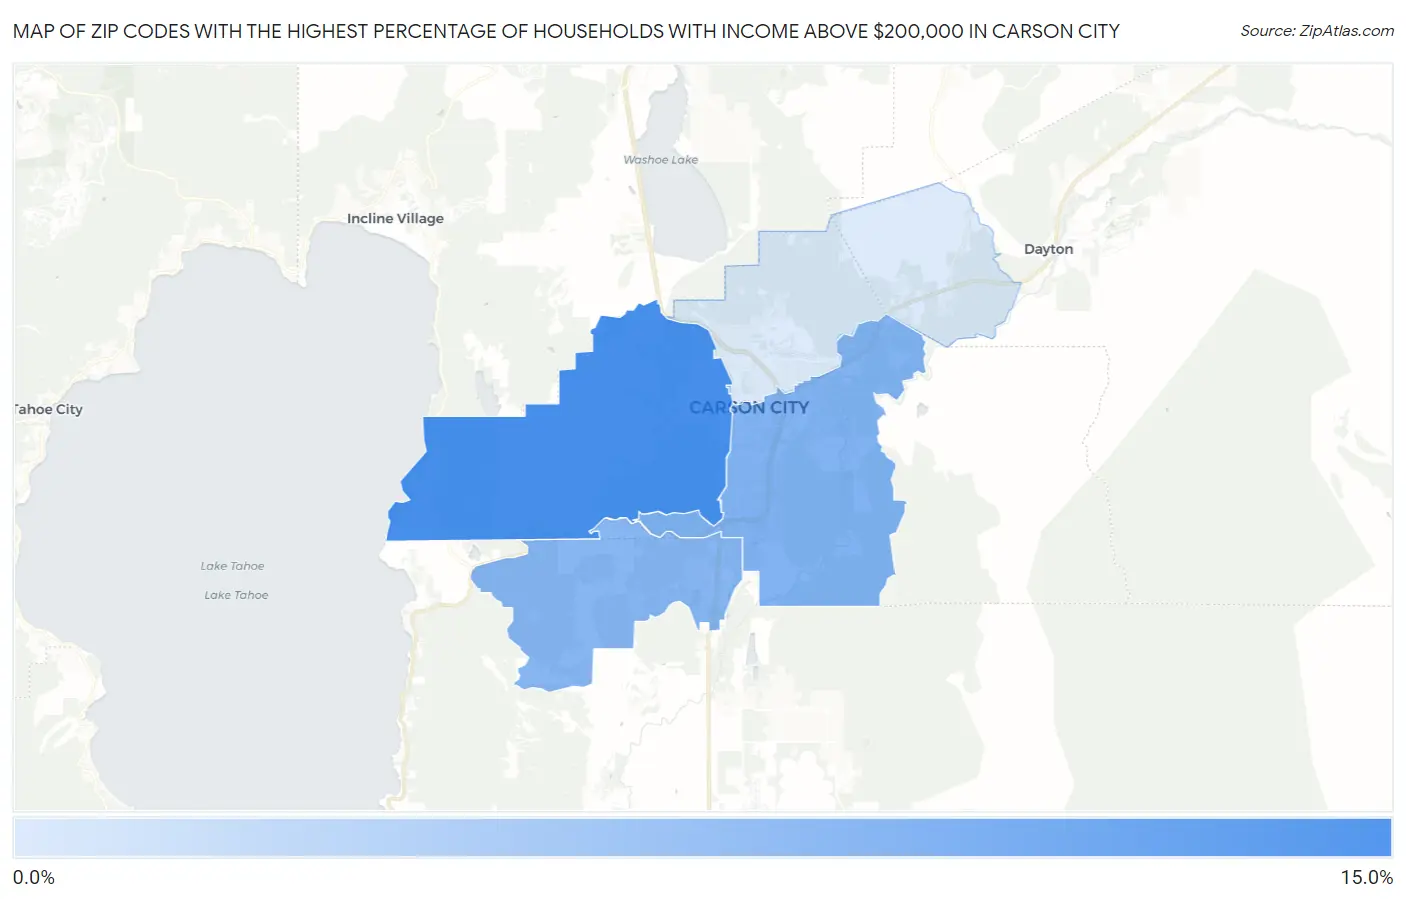
Map of Zip Codes with the Highest Percentage of Households with Income Above $200,000 in Carson City
2.2%
13.4%
Zip Codes with the Highest Percentage of Households with Income Above $200,000 in Carson City, NV
| Zip Code | Households with Income > $200k | vs State | vs National | |
| 1. | 89703 | 13.4% | 8.7%(+4.70)#29 | 11.4%(+2.00)#5,806 |
| 2. | 89701 | 9.0% | 8.7%(+0.300)#53 | 11.4%(-2.40)#9,216 |
| 3. | 89705 | 8.4% | 8.7%(-0.300)#59 | 11.4%(-3.00)#9,914 |
| 4. | 89706 | 2.2% | 8.7%(-6.50)#127 | 11.4%(-9.20)#23,188 |
1
Common Questions
What are the Top 3 Zip Codes with the Highest Percentage of Households with Income Above $200,000 in Carson City, NV?
Top 3 Zip Codes with the Highest Percentage of Households with Income Above $200,000 in Carson City, NV are:
What zip code has the Highest Percentage of Households with Income Above $200,000 in Carson City, NV?
89703 has the Highest Percentage of Households with Income Above $200,000 in Carson City, NV with 13.4%.
What is the Percentage of Households with Income Above $200,000 in Nevada?
Percentage of Households with Income Above $200,000 in Nevada is 8.7%.
What is the Percentage of Households with Income Above $200,000 in the United States?
Percentage of Households with Income Above $200,000 in the United States is 11.4%.